[ Crypto Trading by Identifying Support and Resistance ]-Steemit Crypto Academy | S6W3 | Homework Post for @shemul21
Hello everyone, this is week 3 of the sixth season of the steemit crypto academy. This week's lecture was delivered by professor @shemul21 and the topic for discussion is on Identifying Support and Resistance. After going through this lecture and understanding it I decided to try my hands on the given task.


What is the Support and Resistance zone?
The levels at which traders use in the prediction of the next movement of the prices of assets can be referred to as the support and resistance levels.
When the buying pressure is very high in a certain zone, that zone can be referred to as the support zone. When the price touches the support zone, it makes an uptrend because the buying pressure is very high within that zone. The buyers mostly outwit the sellers within the support zone.
Before we conclude that one zone is a support zone, then we have seen that the price has retested on several occasions and then made an upward movement again. So the traders observe the price and when it retest at the support level again, they place their buy order.
The buying pressure is very high at this point so the order placed at the support zone by the traders is likely to get some profit. The support zone is illustrated on the chart below.
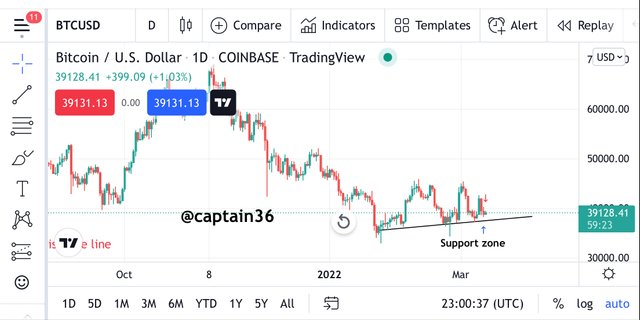
Screenshot from Tradingview
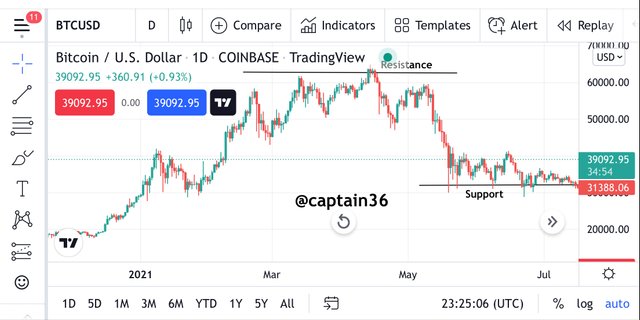
When the selling pressure is very high in a certain zone, that zone can be referred to as the resistance zone. When the price touches the resistance zone, it makes a downtrend because the selling pressure is very high within that zone. The sellers mostly outwit the buyers within the support zone.
Before we conclude that one zone is a support zone, then we have seen that the price has retested on several occasions and then made a downward movement again. So the traders observe the price and when it retest at the resistance level again, they place their buy order.
The selling pressure is very high at this point so the order placed at the resistance zone by the traders is likely to minimize loss. The support zone is illustrated on the chart below.
Screenshot from Tradingview

Explain different types of support and resistance with proper demonstration
The support and resistance are basically grouped into 3 different categories. These include; Sloping, Horizontal and Dynamic support and resistance levels. Let's take a look at them separately.
Horizontal Support and Resistance levels
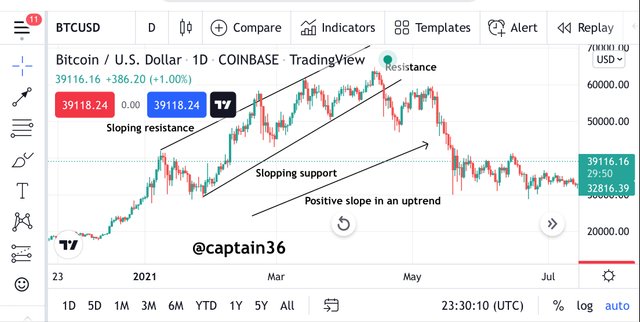
These horizontal support and resistance levels are formed when some points are joined to form a horizontal line. These points are joined at an area where the price seems to be having some difficulty in it's movement. The horizontal support and resistance is very simple to understand and implement hence most beginner traders use them during their analysis. This type is illustrated on the chart below.
Screenshot from Tradingview
The chart above illustrates that the price was struggling at some points so they can be joined to get a horizontal line.
Sloping Support and Resistance level
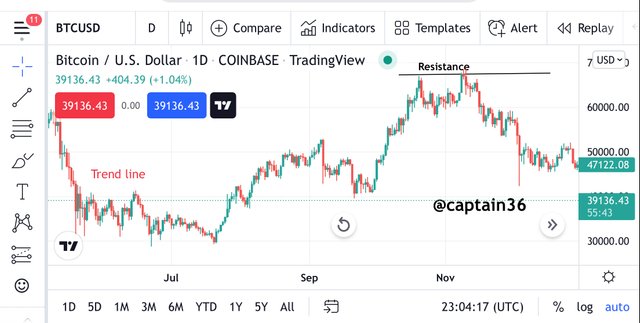
In this type of support and resistance, the points around the area where the price is struggling are joined to form a sloping line but not a horizontal line in this case. The direction of the sloping line shows whether the price is on an uptrend or a downtrend. The sloping line moving upward shows an uptrend whilst in the case when the sloping line is moving downward it shows a downtrend. This can be seen in the chart below.
Screenshot from Tradingview
In the chart above I showed a scenario where the slope was moving upward and this is an indication of an uptrend of the price.
Dynamic Support and Resistance levels
The dynamic support and resistance levels differ from the previous two we discussed above because this one is not in a straight line. The direction changes periodically. This dynamic support and resistance levels are determined by the use of some indicators. Some of them include Bollinger bands, Moving Average etc. An example is seen on the chart below.
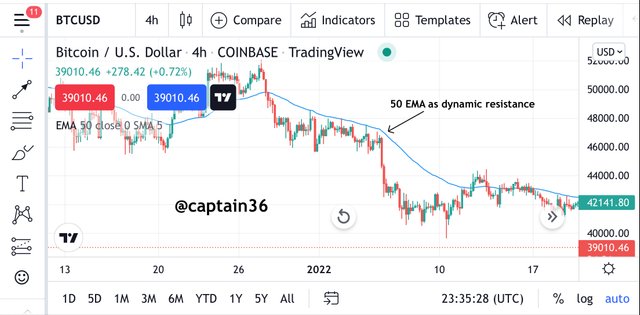
Screenshot from Tradingview
Here I decided to add 50 EMA to the chart. We can see clearly that the 50 EMA is serving as a resistance to the price as well as it moves in the same direction as the price.
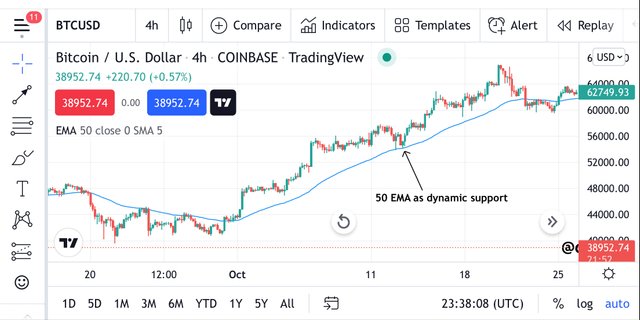
Screenshot from Tradingview
We can also see from the chart above that the 50 EMA is serving as a support to the price. We can see a point where the price is struggling and the price hits the 50 EMA support and reverses downward. The 50 EMA in this case is serving as the dynamic support.

Identify the False and Successful Breakouts. (demonstrate with screenshots)
Breakouts can happen at both support and resistance levels. These breakouts occur when the price breaks a key resistance or support level. These breakouts can either be successful or false depending on the situation. Let's discuss these two.
A breakout is said to be a successful one when it breaks a key level and then continues to trend in that direction.
The successful breakouts can further be grouped into two. These are the continuation breakout and reversal breakout.
In the case of the continuation breakout, when the trend breaks a resistance level it continues to make an upward trend and also if the price continues to make a downward trend after it breaks a support level. This is how the continuation breakout works. The chart below shows an illustration of the continuation breakout.
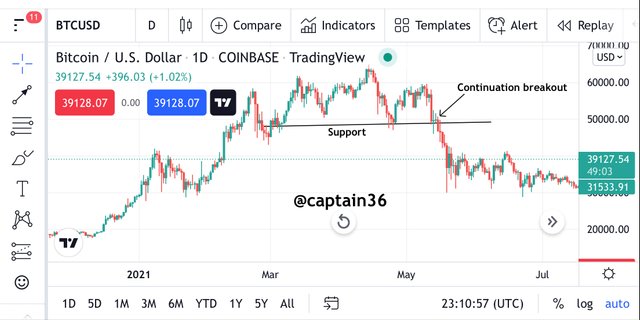
Screenshot from Tradingview
In the case of the reversal breakout, when the price is moving in a particular direction and it breaks the support or resistance level, the price will then change direction and move in the opposite direction. The trend will reverse in this case after touching the support or resistance level. This is demonstrated in the chart below.
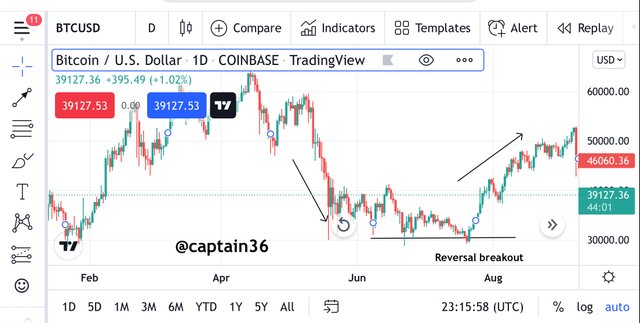
Screenshot from Tradingview
Lets now discuss the false breakout. A breakout is said to be false when the price breaks a key support or resistance level and then after a very short period of time it reverses its direction again. This action is usually influenced by the whales in the market so as they can manipulate the small traders. Traders can work around this by the use of some indicators such as the EMA etc. For this reason traders must confirm signals before entering the market. The chart below illustrates the false breakout.
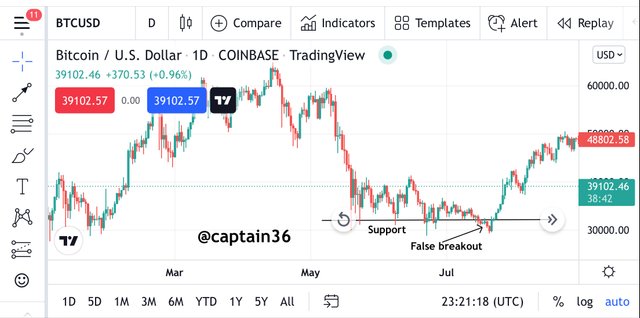
Screenshot from Tradingview

Use Volume and RSI indicator combined with breakouts and Identify the Entry point. (demonstrate with screenshots).
The RSI and Volume indicators are very capable of determining whether a breakout is legit or it is a false breakout. In the RSI, we look at the 50 level to know whether the support or resistance has been broken. After that we use the volume indicator to confirm the breakout. We can place a buy position when we see that the follow is high as this is an indication the breakout is more likely to be legit.
Buy Trade
Screenshot from Tradingview
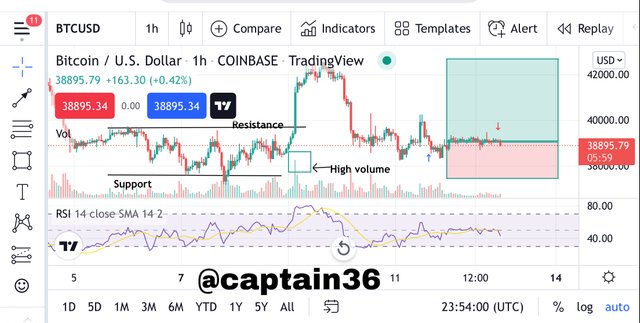
Looking at the chart above, we can see that the RSI moved above 50 towards the overbought at the point the price broke the resistance. We then turn to look at the volume indicator to confirm the breakout. We can see that the volume will increase. It is an indication of an uptrend. So I made all the required confirmations and then placed my buy trade at 1:2 RR.
Sell Trade
Screenshot from Tradingview
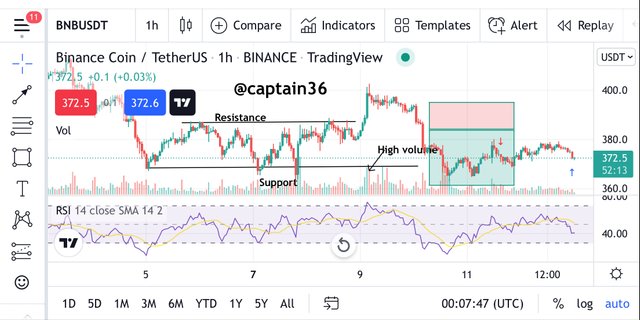
Looking at the chart above, we can see that the RSI moved below 50 as the price broke the support level. We then turn to look at the volume indicator to confirm the breakout. We can see that the sell volume will increase. It is an indication of a downtrend. So I made all the required confirmations and then placed my sell trade.

Take a Real Trade(crypto pair) on your account after a successful Breakout. (Transaction screenshot required).
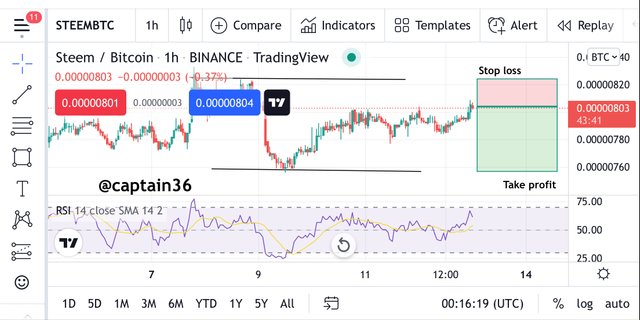
In this section, I will be performing a real trade using breakouts. I have decided to choose the BTC/STEEM pair to make this transaction. The analysis can be seen in the chart below.
Screenshot from Tradingview
Looking at the chart above, I marked the support and resistance levels.
We can see that the price is moving towards the support level. The RSI indicator is also making a downward movement so it went on to confirm my position in the market.
So I went on to place my order on the binance exchange. The details can be seen below.
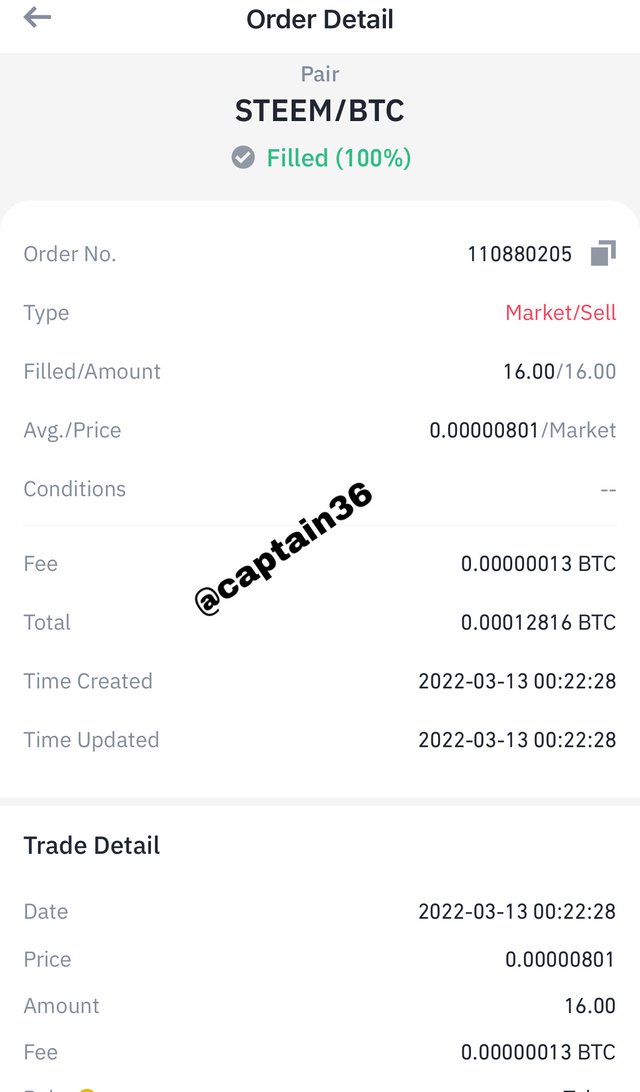 Screenshot from Binance
Explain the Limitations of Support and Resistance (false breakout).
Much as support and resistance are very helpful in trading, they have their own limitations as well. These levels can deceive some traders sometimes and they might lose some of their valuable assets due to this. This is called a false breakout as we discussed already. We can battle these false breakouts by allowing the price to retest the support or resistance level it broke before we enter the market. This is the best way of confirming the breakout before making our trading decisions.
The support and resistance levels are not at only one point but can be found around a particular zone and due to this reason the identification of these support and resistance levels is not straightforward.

Conclusion
Like I said earlier support and resistance is not easy to identify on the chart. Beginner traders must practice this constantly so they can identify these levels and that will help them to benefit from this knowledge of support and resistance.
Thank you once again professor @shemul21 for this detailed.