Understanding Trends - Crypto Academy / S5W1- Homework Post for @reminiscence01
Source

1) a) What do you understand by a trending market?
A trending market in the cryptocurrency space is one that is observed to be in a particular trend. Usually, this trend is referred to as a market trend. A market trend refers to a situation whereby a tendency for the price action or movement of price of an underlying asset is perceived to be moving along a particular direction over a period of time. Generally, when trends occur over a long period of time they are classified as secular trends. When they occur over a short period of time they are referred to as secular trends.
In a trending market, prices continually close either above or below a defined average number of periods or price points over a period of time. In an upward trending market, the price would fluctuate upwards and downwards but would periodically tend to close on average above a certain high price point. A downtrending market periodically closes below a certain price point irrespective of interim price movements that could push upwards. It could be observed on a longer time frame that price seems not to be trending in any particular direction but on a smaller time frame there could be an intermittent short term trend.
In trying to identify market trends, traders rely on technical analysis as a framework which is able to predict trending markets as a tendency of the market to reach support and resistance levels in a varying sinusoidal movement over time. It is understandable to agree that it is more technically correct to say that determining a trend can only be based on hindsight. This is based on the fact that it is never really very possible to predict or know for certain the likely future trend of any market. A primary trend could be one which lasts for a long period of, say, about six months to one year or more and would typically have smaller trends within it.
Secular trends is a term that is generally used in the financial market to describe a market trend that has been observed to have lasted from 5 to 25 years and can be interspersed by a series of other primary trends within it. Consequently, a secular trend could be one where the price of an asset is observed to be increasing overtime but can be marked by smaller decreases in price in between. Conversely, it could be one where the price of the asset has been observed to be decreasing over a longer period of time but can be marked by smaller increases in price in between this period.
b) What is a bullish and a bearish trend? (screenshot required)
Bull market or bear market are terms that are used in the financial world to describe upward and downward movement of price action respectively. The terms can be used to describe the entire market - that is, crypto market - in general or it can be narrowed down to specific assets, sectors or areas of the crypto market like yield farming or DeFi protocols that come with their native tokens.
In this case, the entire cryptocurrency market can be said to have been in a general bullish trend from the time the very first of it - Bitcoin - was introduced in 2009 till now. This has been interspersed by secondary bearish trends in between. Some coins have tremendously experienced bearish moments while some have even rug pulled or simply turned out to be scams.
Bullish Trend
A bullish trend is one in which the price or value of an asset is rising and generally the condition of the market or economy is regarded to be favourable. Typically, the bullish market experiences increases in the price of an asset which is sustained. The term bullish can also be used to denote the sentiment or interest of investors on the asset at that time as this is observed to have increased or to have been boosted by optimism as more investors develop more faith in the asset.
This can result in the price of the particular asset increasing even higher in the longer-term. The economy of such an asset is typically stronger and traders can profit by trading along the rising trend or market. In a bullish run, there is usually the presence of more buyers in the market who help to support and push the price upwards. These buyers put in more buying pressure which overpowers that of the sellers who would have otherwise pushed prices lower.
Bearish Trend
A bearish trend, on the other hand, is one in which the economy or price of an asset is receding or falling and generally the value of the asset is observed to be declining. Usually, the term bearish is equally used to describe the perceived attitude of investors in the market as the crypto market is directly affected or influenced by this. There is a general feeling of pessimism among investors especially when these bearish trends last for a longer time.
Normally, this would result in the price of that particular asset reducing or decreasing even lower in the longer term. The economy of the asset is typically weaker but traders can profit by shorting the market in this case. In a bearish run, there is usually the presence of more sellers in the market who resist further upward movement in the price. These sellers put in more selling pressure which overpower that of the buyers who would have otherwise pushed prices higher.
2) Explain the following trend identification and give an example of each of them. (Original screenshot needed from your chart). Do this for a bullish and a bearish trend.i) Market Structure.ii) Trendlines
Market Structure
By definition, market structure is actually the simplest format in which price action can be read in the market of any crypto asset. Usually, these would act as basic resistance and support levels on the chart of the cryptocurrency asset. This would result in the creation of swing highs and swing lows on the chart. These levels can be identified easily and would hold continually for the observed trend until they are eventually broken. Sometimes, market structure can be called price action.
The whole market moves in this particular pattern so it is generally termed the market structure of the price action. It is basic to understand this structure in order to be able to anticipate the likely price move, especially in the short-term. Then, you can combine it with other tools for technical analysis like moving averages, pivot points, etc to make more accurate predictions. The market structure may be used as a tool to follow the trend and can exist in bullish, bearish and even sideways markets.
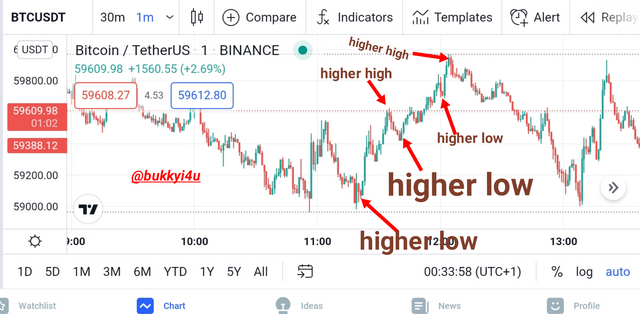
Bullish Market Structure
Whichever way you look at the market or chart, you would find a sort of price movement. This is irrespective of whatever time frame. In order to identify a bullish trend it is key to understand that this would be marked by higher highs and higher lows being consistently created. The higher low represents the first part of the movement. Normally, it is created when the price which had pushed higher suddenly pulls back.
In a worst-case scenario an equivalent low would be created with the preceding one in a bullish trend. Ordinarily, the subsequent low is expected to be higher than the previous one. We would be on the watch out to see whether a new high would be made by the move. Failure to do this should provide caution to observe whether the support will successfully hold or break when tested.
Source
In the image above of the crypto asset chart, you would observe the higher highs and higher lows created by the price action. This continues until an equal low is created with a preceding one. When the price stops printing higher highs in a bullish market and breaks the previous low, this could be the end of the uptrend.
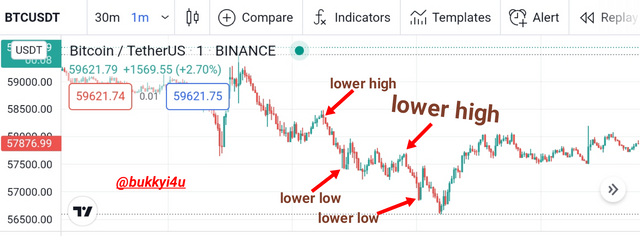
Bearish Market Structure
The bearish market structure is marked by a price action which follows the pattern of lower lows and lower highs. Usually, this continues and lasts for as long as the market continues to print lower highs. The lower high represents the higher part of the pattern while the lower low is the lower part of it. The lower high is normally created when the price that had pushed lower suddenly pulls backwards in an upward direction.
Ordinarily, once a higher high comes into place the trend may have come to an end. Price creating equal highs or printing higher highs could signal a reversing bear trend. The worst case scenario is created when an equivalent high is created with a preceding one in a bear trend. Ordinarily, the subsequent high is expected to be lower than the previous one. If the price movement fails to make a new lower low, there should be caution observed as to whether the resistance will successfully hold or break when tested.
Source
In the image above of the crypto asset chart, you would observe the lower highs and lower lows created by the price action. This continues until an equal high is created with a preceding one. The end of the bear trend was signalled by price not printing lower lows but rather breaking the previous high.
Trendlines
Whenever it is necessary to define whether a downtrend or an uptrend is in place in the trading of financial markets or cryptocurrency markets the trend line can be used. It can be used as a type of technical analysis that can be instrumental for monitoring the movement of price action in trying to predict the market sentiment. It can often be called a trend support line because it gives an idea of the direction the trend is moving.
Normally, at least two bottoms or tops are required to draw a valid trendline. However, three of such bottoms or tops would confirm the trend line. When the trend line becomes steeper it becomes less reliable and more likely to be broken. The more a trend line is tested the stronger it becomes. You should never force the bottoms or tops to fit in. If the bottoms or tops do not fit in then the trend line is not valid.
Bullish Trendline
Source
In drawing a trend line, it is important to identify a series of patterns that is likely to define the trend in the future. In drawing a bullish trend line, a series of higher highs and higher lows should be sought. The minimum points which coincide with the higher lows should be connected when possible in this case to form the trendline in a bullish trend.
In drawing a bullish trend line:-
You should wait for the price to bounce off from a downtrending market and create a low which is higher than the preceding one. This shows that the previous downtrend is losing its strength.
After that, you should wait for the price to create a new high which is higher than the previous lower high. Once this previous high is violently broken we now have two points.
Then, you should connect the two points and extend the trendline to the right of the chart.
Bearish Trendline
Source
In drawing a bearish trend line it is necessary to search for a series of lower lows and lower highs. The maximum points which coincide with the lower highs, in this case, should be connected when possible to form the trendline in a bearish trend.
In drawing a bearish trend line the idea is to create a sort of resistance that future price action would test. If it is tested on a longer timeframe it becomes stronger and more difficult to break. In drawing a bearish trend line:-
You should wait for the price to break from a previous bullish trend and create a lower low which is lower than the previous higher low in the bullish trend. This shows that the previous bullish trend is losing its strength.
After that, you should wait for the price to create a new low which is lower than the previous higher low. Once this previous low is broken we now have two points.
Then, you should connect the two points and extend the trend line to the right of the price chart.
3) Explain trend continuation and how to spot them using market structure and trendlines. (Screenshot needed). Do this for both bullish and bearish trends.
A trend continuation pattern is one which suggests that the ongoing trend will continue its move in its prior direction. Several technical indicators can be used as confirmations for possible trend continuation. These include rectangles, triangles, pennants and flags.
It is important to note that market structure can be combined with the trendline in an interesting way to identify trend continuation. Already we have studied that market structure either creates a pattern of higher highs together with higher lows or that of lower lows together with lower highs. The trendline is now drawn in such a way that at least two of the points of either the higher lows or lower highs are connected and extended to the right.
Trend Continuation With Market Structure And Trendline
Bullish Trend:-
Already, we now understand that the market structure in a bullish trend is usually formed with the creation of a pattern that prints higher highs with higher lows. A trend line is drawn to connect at least two points of the higher lows and extended to the right of the price chart. In using this entire system of market structure and trend line in the bullish trend to determine possible continuation of the trend we should be watching out to see how the price action would react at the trendline.
In this case the trend line is now acting as a sort of support area. However, each succeeding higher low which is connected in the trend line is expected to be higher than the previous one. At worst, it should just be equivalent to the previous higher low. A situation whereby the price action breaks below the previous higher low and, hence, goes below the trend line shows that the bullish trend is possibly coming to an end as it is obviously losing its strength.
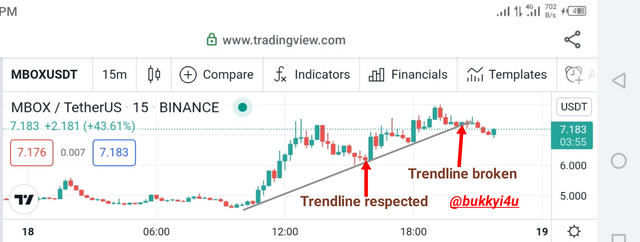
Source
If this trend line is respected in a situation where the price action does not break below it but simply gets to it and reverses in the original bullish direction to continue its upward movement signifies the continuation of the trend. This can be used to confirm trend continuation, especially when the trend line has been respected or tested severally on a higher time frame.
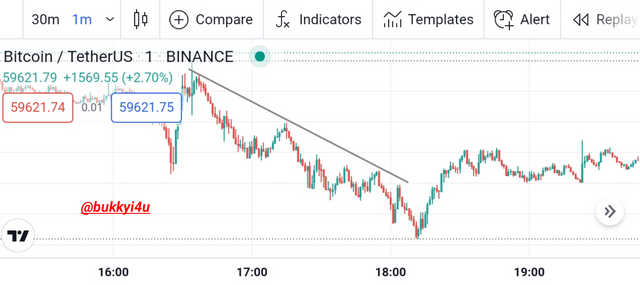
Bearish Trend:-
When a bearish trend is formed with the creation of a pattern that prints lower lows with lower highs, a trend line is drawn to connect at least two points of the lower highs and extended to the right of the price chart. In this case we would be watching to see how the price reacts at the trendline.
The trend line is now acting as a sort of resistance area. Nevertheless, each succeeding lower high is expected to be lower than the previous one. At worst, it should just be equivalent to the previous lower high. A situation whereby the price action breaks above the previous lower high and, hence, goes above the trend line shows that the bearish trend is possibly coming to an end as it is obviously losing its strength.
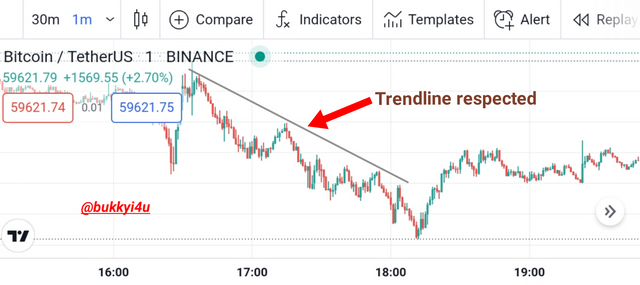
Source
If this trend line is respected in a situation where the price action does not break above it but simply gets to it and reverses in the original bearish direction to continue its downward movement, it can be said that this signifies the continuation of the trend. This can be used to confirm a trend continuation especially when the trend line has been respected or tested severally on a higher time from.
4) Pick up any crypto-asset chart and answer the following questions -
i) Is the market trending?ii) What is the current market trend? (Use the chart to back up your answers).
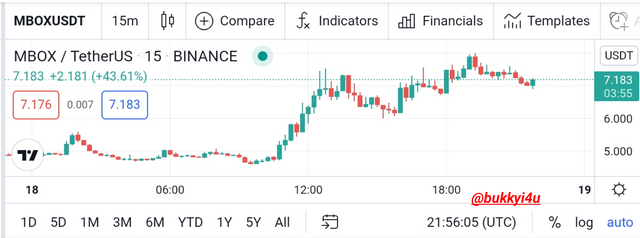
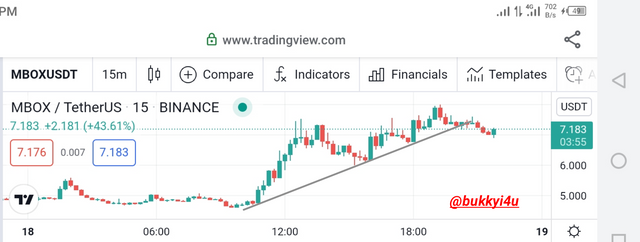
Source
The MBOX/USDT crypto chart above is actually in a trending phase currently on the 15-Minute time frame on the tradingview platform. Currently, the market is experiencing a correction which seems to be culminating in the direction of a downtrend having broken the trendline of the previous bullish trend.
The market had earlier been in a ranging phase with resistance created around $4.991 region. Eventually, this resistance was broken and an uptrend which continued up to as high as around $7.494 followed. A retracement was made after that level. The retracement had gotten as low as $6.063. This higher low was higher than the initial higher low created around $4.991.
Eventually, the retracement reversed in the original direction and got as high as $7.990. Another retracement followed and this time it broke the trend line and has gotten as low as $6.927. This is actually the worst case scenario as it now oscillates around the point of the preceding higher low. A further break below this could invalidate the prior bullish trend.
CONCLUSION
A trending market is one where it is observed that the price of a crypto asset is moving in a particular direction. Usually, in a bullish trend, the price creates higher highs and higher lows while in a bearish trend it prints lower lows and lower highs. A trendline can usually be drawn in these two scenarios by connecting at least two of the higher lows or lower highs and extending the line to the right of the price chart.
In the bullish trend the price of an asset increases in value and the economy is generally stronger. In a bearish trend the price reduces and the value decreases as a result of pessimism in the market. To confirm whether a trend would continue you can watch out to see the reaction of price at the trend lines. When a market structure is created with a trend line drawn, if the price does not break below it - in the case of an uptrend - or above it - in the case of a downtrend - then, it can be said that the ongoing trend is likely to continue.
Cc:
@reminiscence01
Hello @bukkyi4u, I’m glad you participated in the 1st week Season 5 of the Beginner’s class at the Steemit Crypto Academy. Your grades in this task are as follows:
Observations:
This is correct.
Recommendation / Feedback:
Thank you for submitting your homework task. Good job
This post pays out in barely 23 hours and has not yet been upvoted by either @steemcurator01 or @steemcurator02