Steemit Cryptoacademy Week 14 Homework Submitted To Professor @kouba01| Cryptocurrency Trading With MACD| By @bukkyi4u
What is the MACD indicator simply?
MACD is an acronym which stands for Moving Average Convergence Divergence. This is a tool which can be used as a trading indicator. It falls under the family of oscillators and was developed by Gerard Appel in the 1970s. The indicator is created to reveal changes in the momentum and the strength of a trend. Also, it shows the direction and duration of the trend and can be used for price analysis of cryptocurrencies when undertaking technical analysis. Moreover, being an oscillator it goes in the direction of the trend and can, therefore, be used to follow a trending market. The MACD oscillator or indicator is made up of time series which are three in number and which are usually calculated from the historical closing prices of the market under review. Normally, these time series consist of the MACD series itself, the signal series (which can also be called the average series) and then the divergence series which is actually the difference between the other two.
Usually, the MACD and signal series are displayed as continuous lines which are plotted on a time horizontal axis. The divergence series itself is always represented as a bar chart that is actually a histogram. The fast or short period EMA mostly responds to recent changes in market prices more quickly than the slow or long period EMA. Consequently, MACD reviews the difference in the market prices of a trending market by making a comparison between its EMAs in different periods. Furthermore, the MACD is a slow lagging indicator. This is based on the fact that it is built on moving averages. Hence, it cannot be used as a metric to predict the future prices of non-trending markets. Also, it cannot be used in markets whose prices are usually unpredictable.
Is the MACD Indicator Good for Trading Cryptocurrencies?
Personally, deciding on whether or not an indicator is good for trading cryptocurrencies would be based on how reliable such an indicator has proven to be over time. Be that as it may, the MACD is a very popular indicator for technical analysis. It has the characteristics of being both a lagging and leading indicator. Again, it comes with a moving average trigger line. This gives it a multi-functionality and also makes it a versatile indicator for technical analysis. Actually, this is what a lot of traders are looking for.
Furthermore, the indicator has the ability to follow trends and forecast momentum in a way that is easily understandable. The lack of complexity in interpreting and confirming these two important factors makes it easily acceptable to even novice traders and experienced traders as well. These factors make the MACD to be seen as a reliable and efficient indicator by a lot of traders. The interaction created between the two moving averages of the MACD, together with its own nine-day EMA as well as the price action line gives it a strong basis for the interpretation of momentum and forecasting of trading signals. However, it is understandable that no indicator can forecast with utmost certainty. Also, there is no tool that can absolutely remove risks and guarantee trading profits. Although it can serve very well in helping to identify potential trend reversals, it has its own failings and would not be reliable in the sideways market. Generally, I consider it a very good indicator for trading purposes. I personally do not enter any trade without first looking at the MACD signals.
Which is better, MACD or RSI?
Actually, deciding on which indicator would be better between the MACD and RSI may not be an easy choice to make. This is based on the fact that there is no single litmus test to determine an indicator which can be outrightly praised as being better than the other. However, it will be necessary to compare the strengths and weaknesses of the two indicators in forecasting price momentum since this is the bulk of what traders will be looking for when using any of the two indicators for trading purposes. Nonetheless, there are a lot of situations in which the RSI has been observed to give better trading signals than the MACD.
Still, the MACD has quite some comparative advantages when compared to the RSI. In a research that was conducted by the Worcester Polytechnic in 2028, it was discovered that the MACD has the ability of giving better signals than the RSI when it comes to trending markets. Again, based on a 2013 research by Ziba Habibilashkary, the MACD provides more reliable signals on both long and short time frames and in different market conditions but the RSI works better on longer time frames. Furthermore, in a 2014 research by Business Perspective it was discovered that the MACD is better suited for short-selling and the RSI. Conversely, it has been observed that though the RSI gives less frequent trading signals, it could give more reliable signals especially in longer time frames and in non-trending markets.
Finally, I would like to point out that no single indicator is the ultimate in price forecasting and may not be outrightly written as being better than any other. Therefore, both the MACD and RSI could have comparative advantages. Hence, deciding on which one would be better than the other may not be an easy choice. However, I use the both simultaneously and look for areas of confluence when making market analysis.
How to add the MACD indicator to the chart
Adding the MACD indicator to a cryptocurrency price chart is a quite simple process. Usually, it could be accomplished in two simple steps:
- First, add the indicator itself
- Implement the indicator settings
Step 01
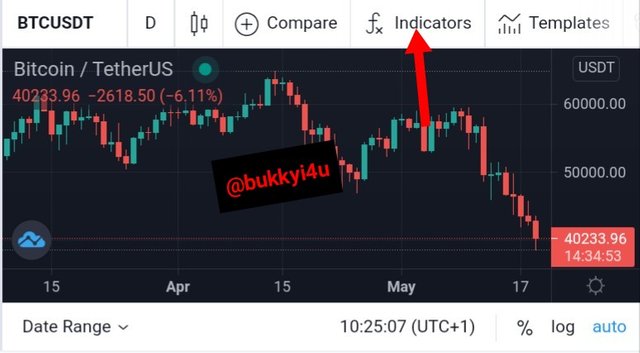
- Select fx indicator from the top bar
- Input MACD on the page that opens up
- Select 'MACD'
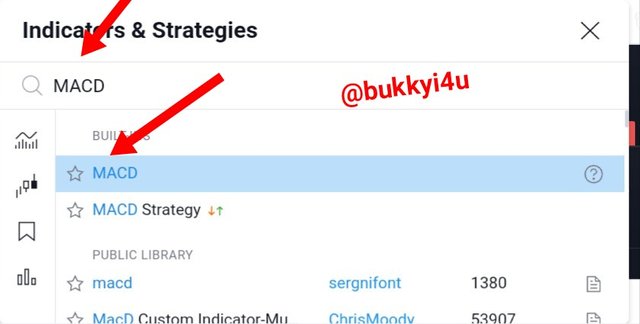
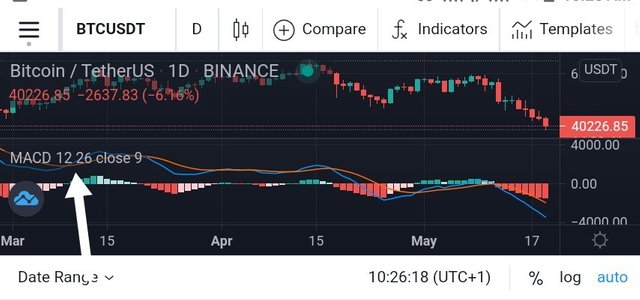
The MACD indicator would be successfully added to your price chart.
Step 02
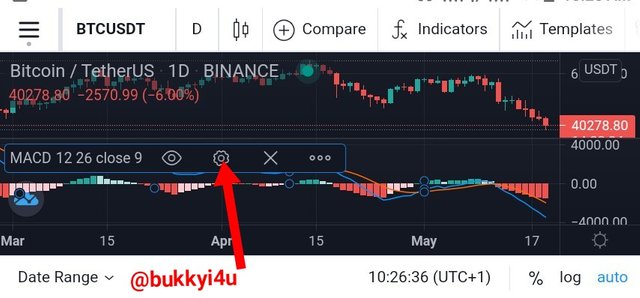
- Tap the MACD indicator that has been added to the price chart to reveal the settings button
- Tap the settings button to open up the settings page
- Fill up the 'Inputs' section that appears
- Fill up the 'Style' section that appears
What are its settings?
There are two prominent settings on the MACD. These include 'Input' and 'Style' settings.
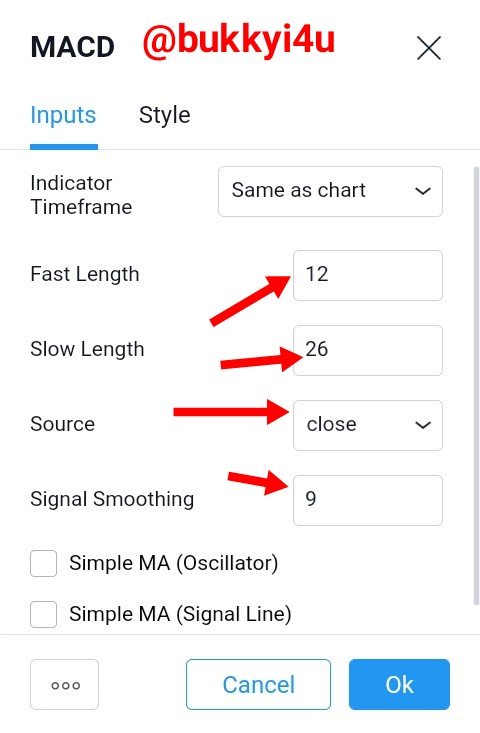
Input settings:
The MACD comes with a default setting. Usually, this typical setting is denoted as (12, 26, 9) which consists of the following time series:
- The 12 period Exponential Moving Average which is also the fast line
- The 26 period Exponential Moving Average which is also the slow line
- The 9 period EMA line which is known as the signal line
Usually, the difference between the 12 period EMA line and the 26 period EMA line is what represents the MACD line itself.
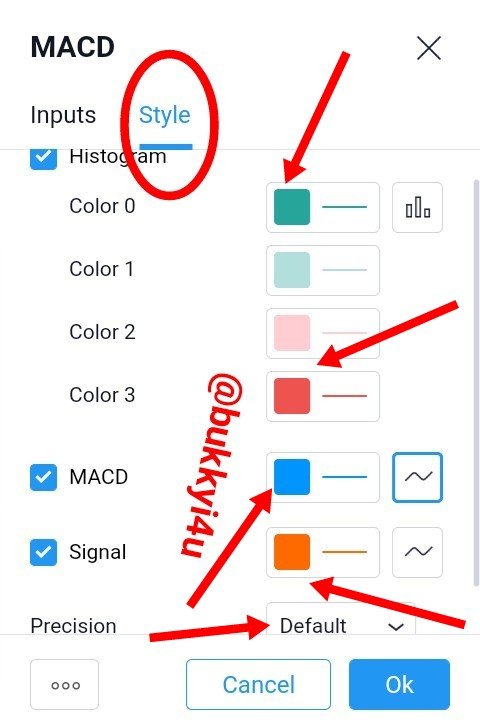
Style settings:
On the 'Style' settings you would usually select the colours you want the histogram to appear on. Normally, this is set at green for 'Colour 0' which represents the time the histogram is above the zero line and red for 'Colour 3' which stands for the time the histogram is below the zero line.
Also, on the 'Style' settings you would select the colour for the MACD line itself (which is blue in this case) and the colour for the signal lin(which is orange in this case).
Finally, on 'Style' settings there is precision which represents the number of digits which you would like the MACD readings to indicate.
Ways to benefit from the settings?
These MACD settings come with a lot of inherent benefits for traders. Interestingly, both novice and experienced traders can all benefit so much from the settings which bring out the MACD line itself (as a difference between the short period and long period EMA) and the 9 period EMA signal line. Also, the MACD has the histogram which is actually a plot of the difference between the MACD line itself and then the signal line.
The crossing of the MACD and the signal line help to tell buyers when to buy or sell. The crossing of the histogram towards the upside or downside of the zero line gives an imagery of trend reversals in crypto price action. Also, the crossing of the MACD and signal lines below or above the zero line is equally beneficial in telling when the market experiences trend reversal.
How to use MACD with the crossing of the signal line?
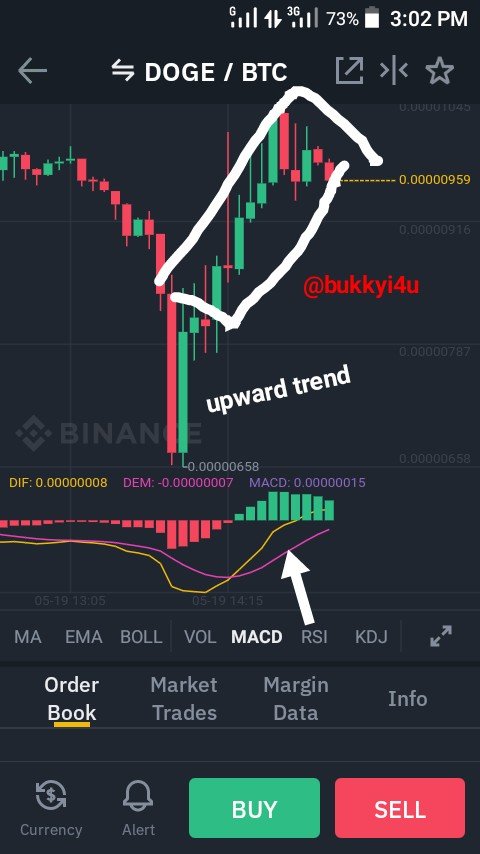
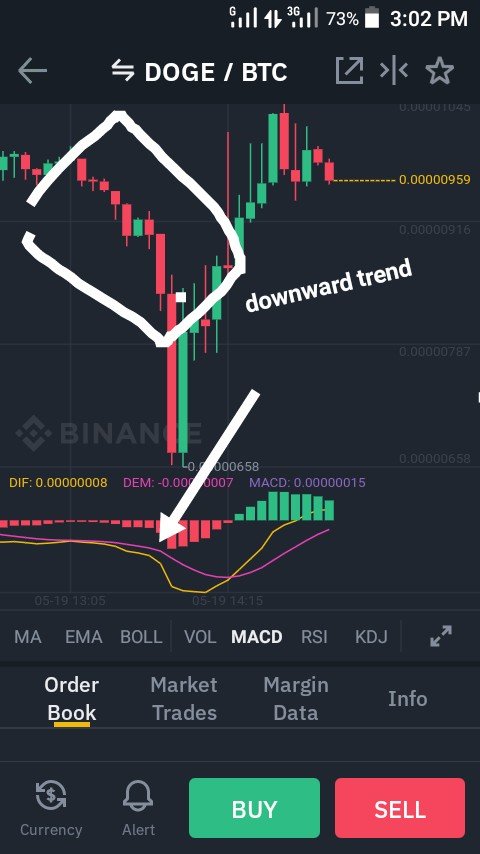
The MACD crossing the signal line is always an important signal and indication. Whenever the MACD goes above the signal line, then it is time to go long or buy. However, if the MACD should go below the signal line then it would be time to go short or sell.
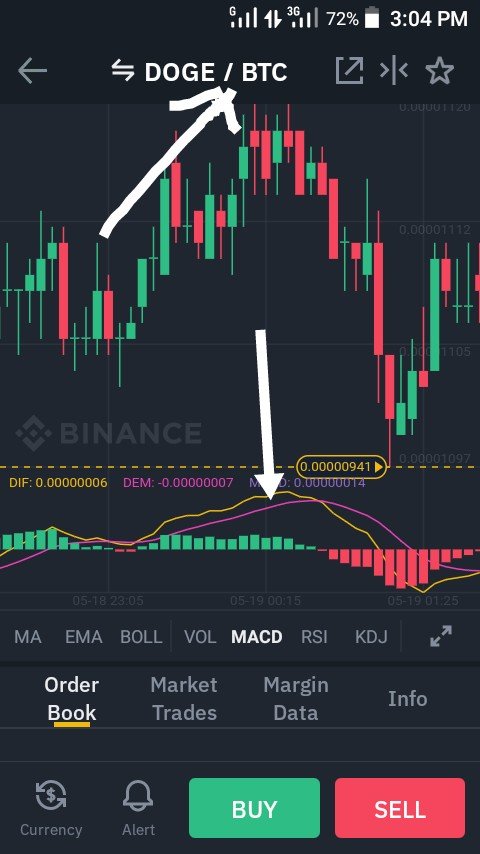
This is illustrated in the price chart below. From the price chart below you will discover that the MACD crossing below the signal line coincides with the upward trend of the price. Hence, it is a good time to sell. Conversely, the MACD crossing above the signal line coincides with the downward trend of the price which is a good time to buy.
How to use the MACD with the crossing of the zero line?
When the MACD crosses and moves above the zero line it represents a bullish signal. Conversely, when the MACD moves below the zero line it represents a bearish signal. The further away the indicator is from the zero line when it crosses the stronger the signal is. The MACD crossing usually results in market trend reversal and could be more accentuated if they coincide with the creation of divergence with the price chart.
The MACD crossing above the zero line in the screenshot above represents a bullish signal and is, therefore, a good time to sell since prices have gone up.
The MACD crossing below the zero line in the screenshot above represents a bearish signal and is therefore a good time to buy since prices are down.
How to detect a trend using the MACD
Detecting a trend with the MACD would be based on the slope of the histogram. Interpreting the direction of trends from the histogram of the slope of the histogram can be done or approved from two angles:
- When the histogram crosses the zero line
- When the slope of the histogram changes
When the histogram crosses the zero line
The crossing of the histogram bars from one side of the zero line to the other indicates trend reversal. The histogram crossing from the upside of the zero line to the downside indicates a trend reversal in the downward direction.
On the other hand, the histogram crossing from the downside of the zero line to the upside indicates a market trend reversal in the upward direction.
When the slope of the histogram changes
Usually, the histogram makes small bars which become elongated as they move away from the zero line. These elongated bars eventually flatten out at the point of resistance or support. After this flattening out, the bars change their direction and begin to shorten again as they continue their journey towards the zero line. Interestingly, the point where the bars begin to shorten after flattening out represent the point of market trend reversal. That is the point where, it can be said that, the slope of the histogram changes.
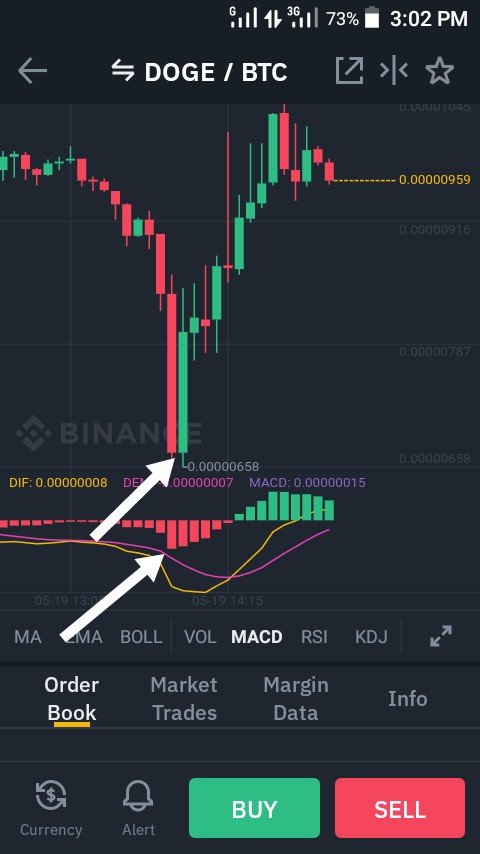
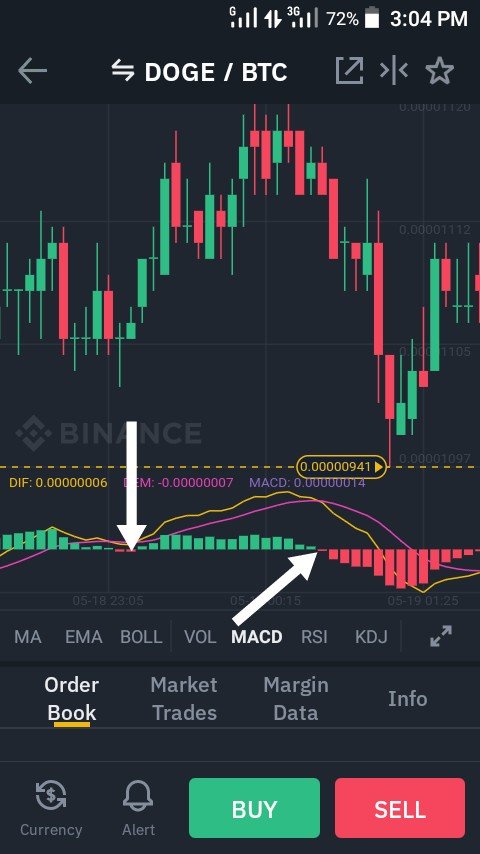
How to filter out false signals (Screenshot required)
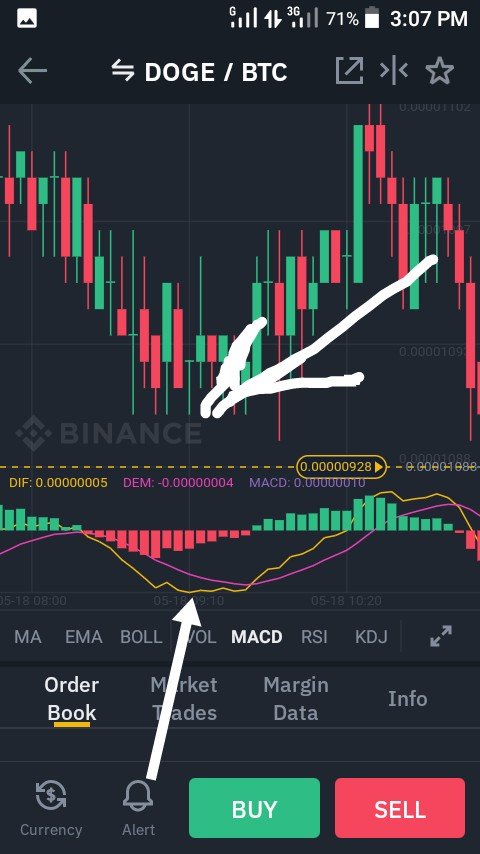
From the price chart above at the points where I marked, it can be noticed that while the price chart has evidently marked a market trend reversal and the price begins to go up thereby representing the point from where traders can go short since price is now going up, it can be seen that the MACD signal remains below the signal line. Since both lines are above the zero line this is a false signal from the MACD.
As the price begins to go up from the point of reversal signifying an upward price action the MACD remains below the signal line. Relying on the MACD at this point would make me not sell and miss out on an important opportunity to make some profits. However, it should be noted that even the histogram bars have recognised this point of reversal and begun to move in the opposite direction in line with the upward price action reversal. So, in this case traders should rather rely on the histogram to make informed market decisions.
How can the MACD indicator be used to extract points or support and resistance levels on the chart? Use an example to explain the strategy. (Screenshot required)
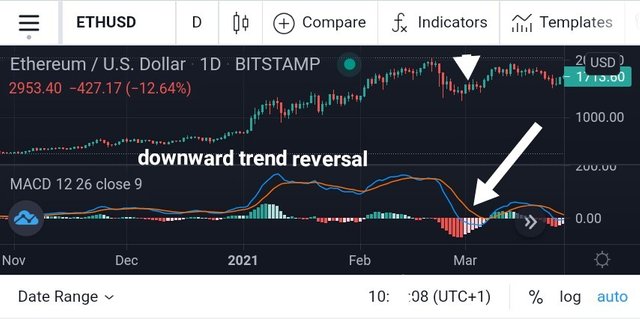
In detecting or extracting points from the MACD, it can be seen that some points could become points of bullish divergence or bearish divergence. These points of divergence usually represent a point where the market trend is about to change. However, this may not always be the case. The point where the price chart itself makes higher highs but the MACD makes lower lows represent points of bullish divergence.
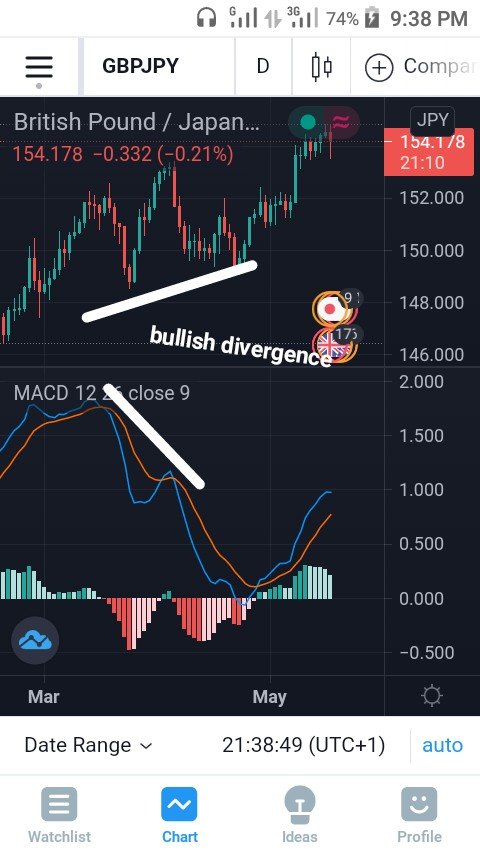
They could signal a downward market trend reversal. Also, the point where the price chart makes lower highs while the MACD makes higher lows represent points of bearish divergence. They could signal an upward market trend reversal. Market trend reversal from MACD divergence is more likely when the divergence occurs at the extremes of the MACD - that is, far above or below the zero line. These can be seen below.
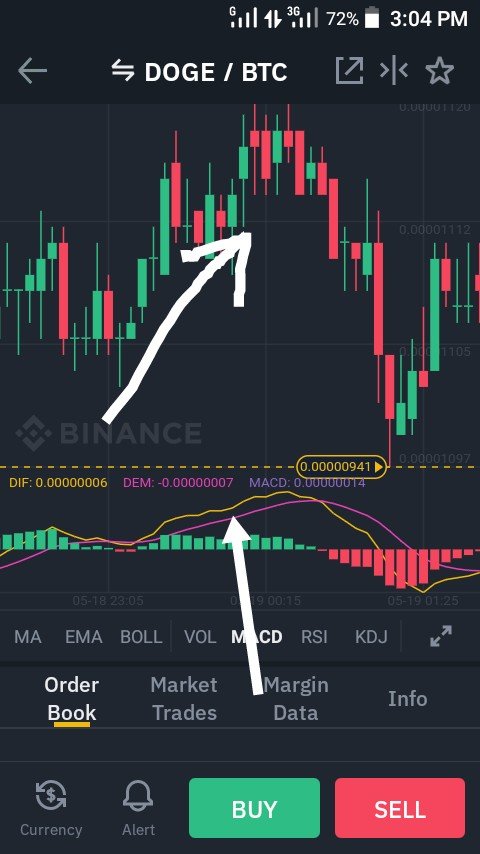
Again, points can be extracted when the histogram itself converges towards the zero line as a point where the market trend is about to reverse. This can be seen as represented below.
Furthermore, points of resistance or support can be extracted from the MACD indicator by taking a close look at the histogram. From the histogram the bars straighten out from the point of convergence at the zero line. The bars move away from the point where they converge on the zero line and become elongated until they get to a particular point where they flatten out. Eventually, the bars start to shorten out and begin to make their journey towards convergence on the zero line. The point where the elongated bars occur below the zero line represent points of support. On the other hand, when the flattened points occur above the zero line they represent points of resistance.
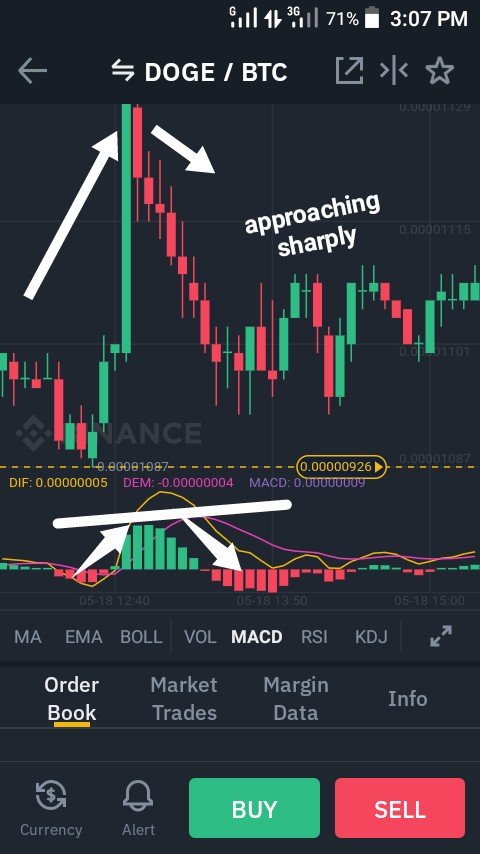
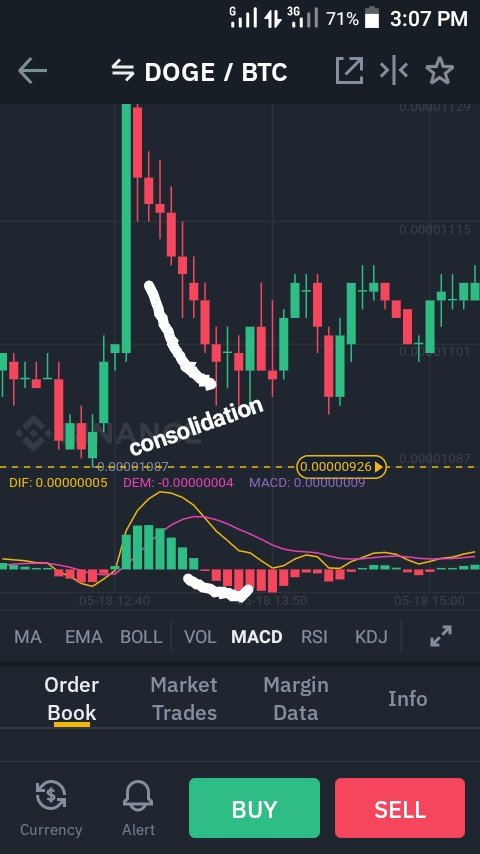
When the bars approach the points of resistance or support sharply there would redound from there but when they approach with greater amount of consolidation then there is likely to be a price breakout. The histogram represents this very nicely and distinctly.
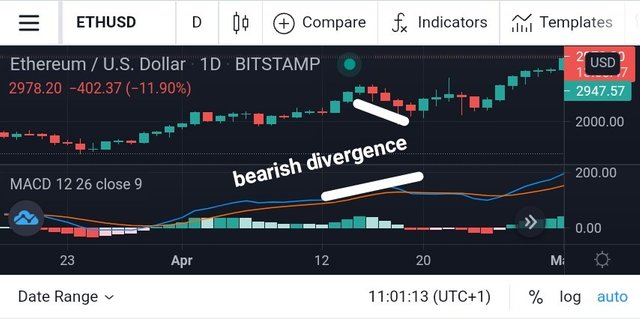
Review the chart of any pair and present the various signals from the MACD. (Screenshot required)
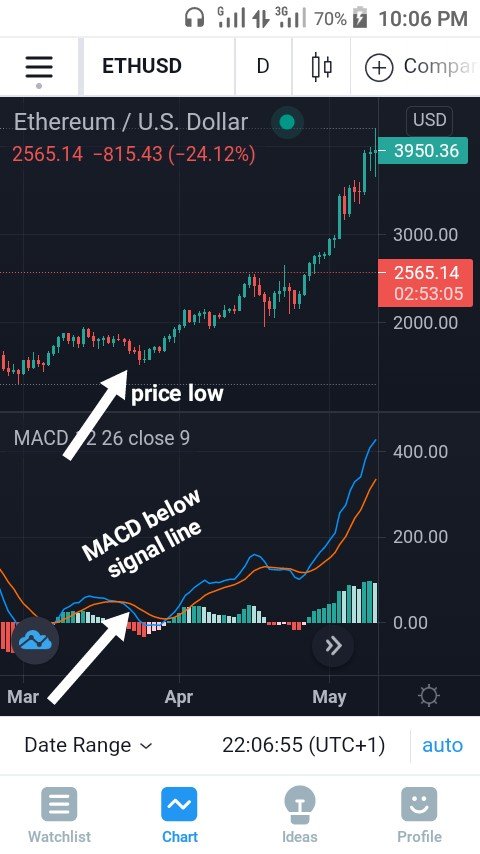
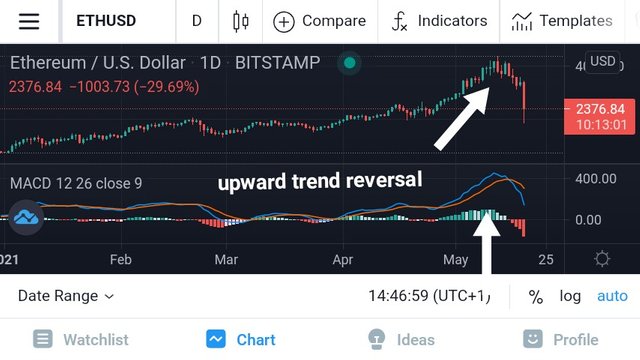
From the Ethereum/USD price chart above the MACD shows several signals for going long or short. The signals for going long occur at the point where the MACD line goes below the signal line while both are above the zero line. The signals for going short occur when the MACD lines go above the signal line as both remain above the zero line. Generally, the price chart is a trending upward market price action. However, at some point the price does come down to retest support before going up in an attempt to form double tops.
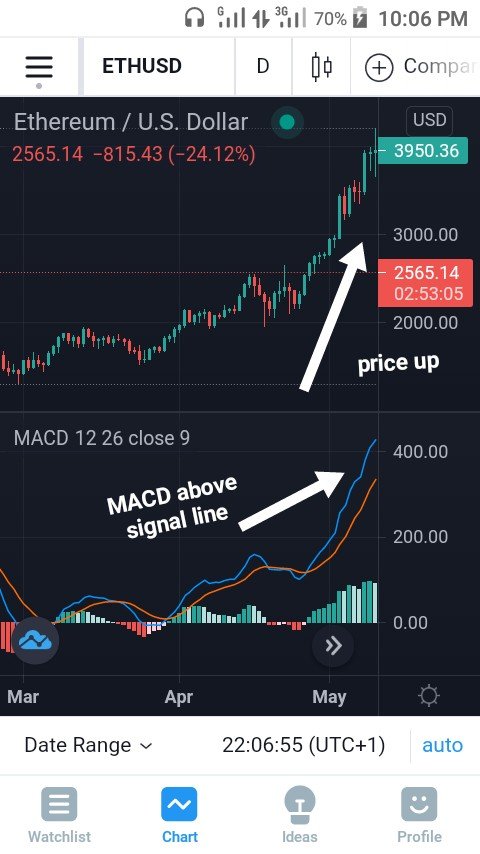
When forming a double top becomes impossible there is usually price breakout. At the beginning of the chart there is lower volatility after a long period of time. This continues till May when there is a price spike. This in itself is another signal of a long period of volatility proceeding a tremendous price breakout. The MACD represents this long period of low-volatility by maintaining a close gap between the MACD line and the signal line. When this happens over a long time there could usually be a price spike. The more the distance between the MACD line and the signal line the more the volatility in the market.
CONCLUSION
The MACD is a very interesting market technical analysis tool which falls in the family of oscillators. It can be used to follow the market trend. As an oscillator it is also good in forecasting price momentum and will therefore be good for trading.
However, care should be taken to avoid false signals from the indicator. Interestingly, it can be used with the RSI when looking for points of confluence to make better trading decisions.
Unfortunately @bukkyi4u, this week's submission time has expired.