Steemit Crypto Academy Season 4 Beginner's Course - Task 10 : Candlestick Patterns by @reminiscence01
Source

2 a) In your own words, explain the candlestick patterns and their importance in carrying out effective technical analysis.
b) In your own words, explain the psychology behind the formation of the following candlestick patterns.
-Bullish engulfing Candlestick pattern
-Doji Candlestick pattern
-The Hammer candlestick pattern
-The morning and evening Star candlestick pattern.
-The Harami Candlestick pattern
Candlestick patterns in cryptocurrency trading refers to a tool which is useful for the analysis of charts produced by the movement of price action of an underlying crypto asset which can be very instrumental in helping traders determine when to enter trading positions based on potentially profitable structures formed in the price action. Normally, it makes use of historic price data and by gauging the previous trends that have been formed by the price of the asset in question. When the candlestick patterns that are formed by the price action of underlying assets our combined with some other forms of fundamental and technical analysis of an asset, it can be very valuable in determining the possible reversal of an ongoing trend, determining possible continuation or likely breakout of price action in the market.
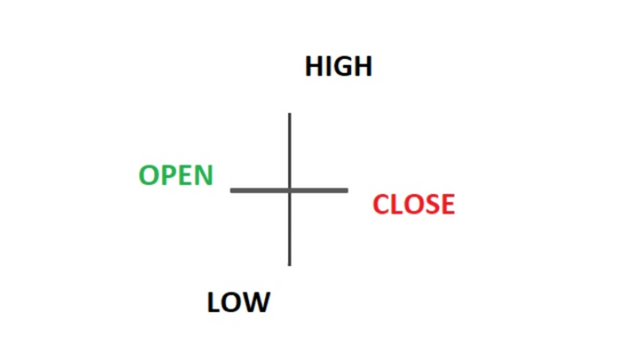
Actually, the kind of candlestick pattern which were first invented in the 18th century were known as the Japanese candlesticks and had their origin in Japan. Wins Japanese candlesticks have been extensively utilised even in the Western world for the analysis of financial markets and has lasted for more than a century in its usage. They are based on past or previous price action as a way of determining possible movement of price in the future. It is visualised on the chart and gives information on the high, low, open and close prices for any crypto asset you may decide to trade on.
These candlestick patterns can be very helpful when trying to determine potential trading positions and one has to learn how to effectively utilise and apply them for profitable trading. Normally, the difference between the opening and closing price of an asset for any particular day is given by the body of the candlestick. Generally, the candlesticks come with colours because this makes it possible for a bearish trend to be distinguished from a bullish trend. The body is hollow in nature and has areas below and above them which are known as shadows. When the candlestick comes with a black or red color, it would mean that the opening price of the asset in that particular time span was higher than the closing price. Also, the colour could be green, white or of a transparent body showing that the opening price was lower than the closing price for that particular time span.
There are more than 40 recognisable candlestick chart patterns in the market. In any case, these chart patterns would be more reliable when they are used to determine possible movement of price in a short term. In a candlestick pattern which is set to the daily time frame each candle with a shadow or wick above the body or at the top of the body would show the highest point the price had reached for that day. The shadow or wick which is below the body would show the lowest point the price had reached on that same day. Equally, this would be the case for the weekly, monthly or even hourly candlesticks pattern as the wicks would either indicate highest or lowest points for the week, month or for an hour respectively.
Bullish Engulfing Candlestick Pattern
Source
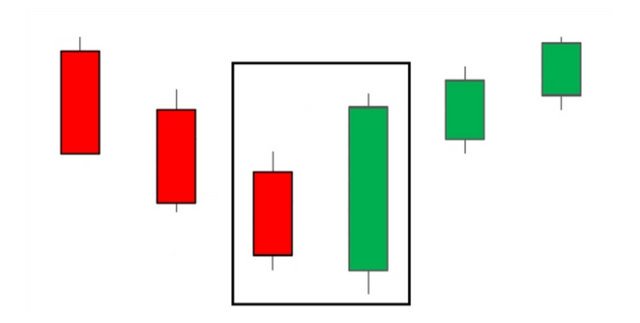
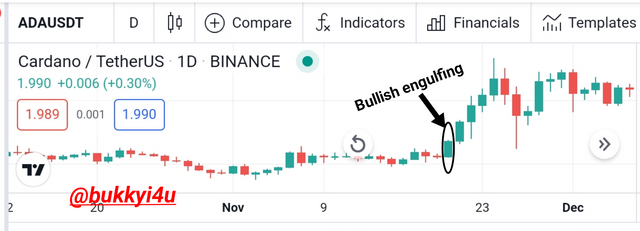
A bullish engulfing candlestick pattern is a candlestick which can be white, transparent or green in colour which occurs with a closing point that is higher than the opening point of the immediately preceding candle after it had opened lower than the closing point of the immediately preceding candle. Usually, it is identifiable in the situation that a small red or black candlestick which represents a bearish trend is immediately followed on the next candle by a large green or white candlestick which identifies a bullish trend with a body that engulfs or encircles completely the body of the immediately preceding bearish candlestick.
The bullish engulfing candlestick pattern is the exact opposite of the bearish engulfing candlestick pattern. This system of the bullish engulfing candlestick pattern functions as a two-candle reversal pattern. It occurs in a situation where the second candle would engulf or completely encircle the real body, not the wick or shadow of the first or immediately preceding one. Of course, it is always seen in a downtrend and comes as a combination of a smaller red candle which is followed by a larger green candle. Usually, this larger green candle foretells a buying pressure which has pushed price to a higher point even after it had opened at a lower point but has now been pushed higher to a point above the high of the previous or immediately preceding bearish candle. This shows that the buyers are winning.
Characteristics Of A Bullish Engulfing Candlestick Pattern
Source
- It is characterized by the formation of a green candle which is very strong I which engulfs or completely encircles the body of the red candle before it
- It occurs at the bottom or the end of a downtrending market
- If the red candle is a doji or if the closing of the succeeding green candles is above the highest point of the bullish engulfing candle then this can be taken as a much stronger signal
What It Tells Traders
The bullish engulfing candlestick pattern conveys the information that:-
- There is the likelihood of a trend reversal in the bullish direction
- The selling pressure is losing its momentum at this point
Advantages Of The Bullish Engulfing Candlestick Pattern
The bullish engulfing candlestick pattern:-
- Is easy to identify when it occurs in a downtrending market
- When it is confirmed by a bullish reversal it could provide a very profitable signal
| Pattern | Bullish engulfing candlestick pattern |
|---|---|
| Characteristics | Green candle which encircles the previous much smaller red candle |
| Location Occurs | Bottom of a downtrending market |
| Signal Given | Bullish market reversal |
Doji Candlestick Pattern
Source
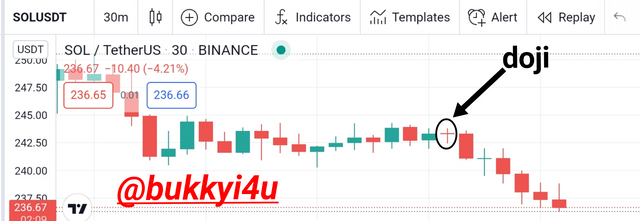
A doji is a name which is given to a candlestick pattern that is marked by a session of trading where it can be observed that the candlestick for an asset occurs with opening and closing points that are virtually equal. A doji pattern can look like a plus sign, an inverted cross or a cross.
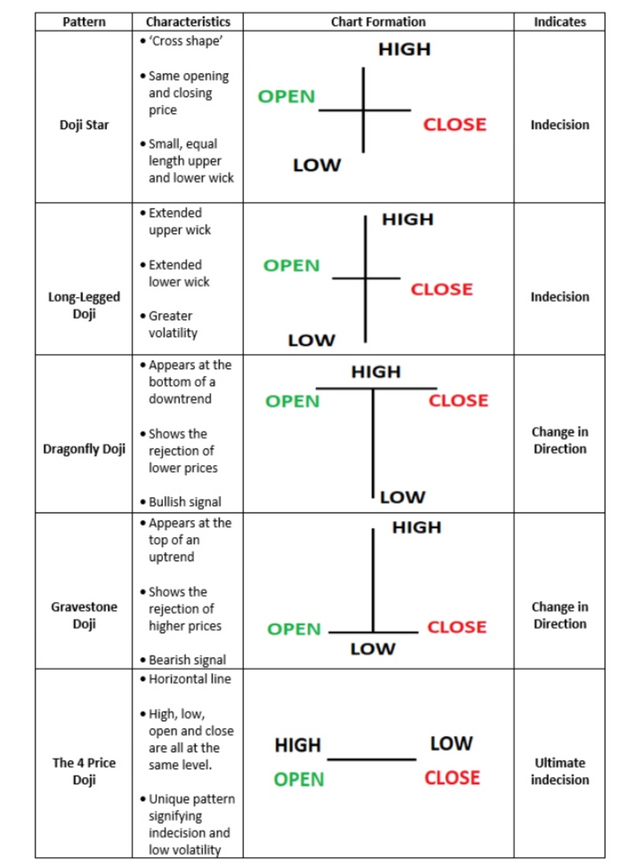
Most times when these patterns which come with equal open and close prices for an asset in any given period occur, it is often interpreted by most technical analysts as a pattern which signals possible reversal of the ongoing trend. The Japanese doji word means mistake or blunder. This underscores the rarity of obtaining a period where the open and close price of an asset is exactly or virtually the same. Doji patterns on their own are neutral. They can come out as dragonfly, long-legged doji or the gravestone doji as the three major types. This will depend on where the open or close points fall.
Source
Doji, which refers to both singular and the plural form of the word, would be printed when the close and open prices of a crypto asset are virtually the same and it could look like a plus sign or cross which has a body that is either non-existent or very small. Most times it is understood as a period of indecision in the market where neither the buyers or sellers are winning.
Everyone seems to have been matched equally resulting in price not going in any direction. It is often interpreted by most analysts as a pattern for reversal. Nevertheless, it could also be a period where sellers or buyers are gathering greater momentum to continue the ongoing trend. Most commonly, it occurs during market consolidations and can also inform possible or potential price breakouts.
The different types of the doji pattern are shown below:-
Source
The Hammer Candlestick Pattern
Source
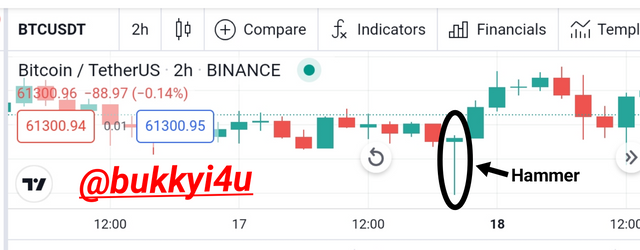
The hammer candlestick pattern is a type of price chart that occurs when an asset is observed to have traded at a price that is significantly lower than the price at which it had opened but then rallies upwards within the same period under review to now close at a point which is near to the price where it had opened. Invariably, this price action forms the shape of a hammer in the chart pattern.
The lower shadow of the pattern is always at least two times the size of the real body of the pattern or candlestick. Of course, the candlestick has a body which signifies the difference in price between the opening and closing prices. The shadow itself signifies the highest and lowest points where the price had gotten to in the period under review. It has been observed that the hammer candlestick pattern would occur typically after a decline has been observed in the price.
Source
Hence, the real body is actually small while the lower shadow appears longer. This candlestick pattern is always observed when the sellers make an entry into the market in the period where decline has occurred in the price. As the market closes the buyers seem to have absorbed the selling pressure. This results in them pushing the market price nearer to the point where it had earlier opened. Eventually, the price could close either above or below the point where it had opened.
However, it is always expected that the clothes would be near the point where it had opened so that the real body of the pattern in this period would be actually small. Equally, the shadow which appears beneath or lower must be at least twice the height represented by the real body itself. Usually, the hammer candlestick pattern can be interpreted as a potential upward price reversal. Consequently, it is expected that the price would begin moving upwards once the hammer is formed. This should serve as the confirmation.
The Morning And Evening Star Candlestick Pattern
The Morning Star
Source
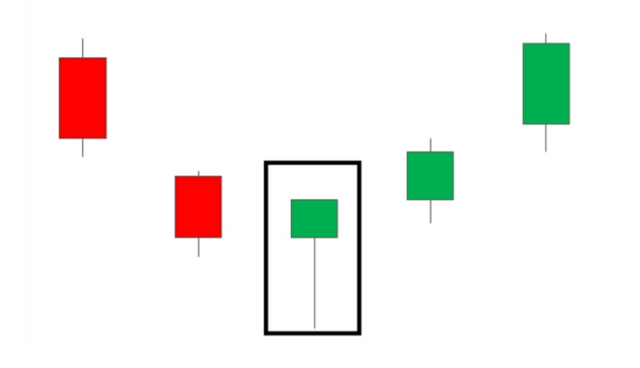
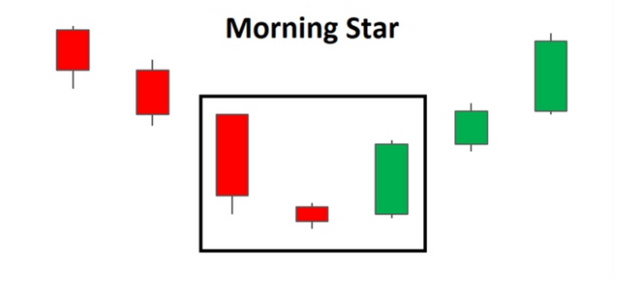
The Morning Star is a candlestick pattern which is visually represented on the chart and which is made up of three candlesticks which usually are interpreted to portend bullish sentiment in the market by technical analysts. It is normally formed at the end of a downtrending market and shows that an upward climb of the price action is beginning. Therefore, it is a reversal pattern indicating potential reversal of the current trend. Once it is formed, traders will be on the watch out to confirm the reversal pattern by the use of additional indicators.
Normally, it consists of a tall red candle, a smaller red candle that has a short body with long wicks and a third green candlestick which is tall. Usually, the middle candle in this system signifies indecision in the market and the bears are understood to be giving way to the bulls. The confirmation for the reversal usually comes with the third candle that could mark the beginning of an uptrend. The evening star is the opposite pattern to this particular candlestick pattern and itself captures the reversal of an uptrending market into a potential downtrend.
Source
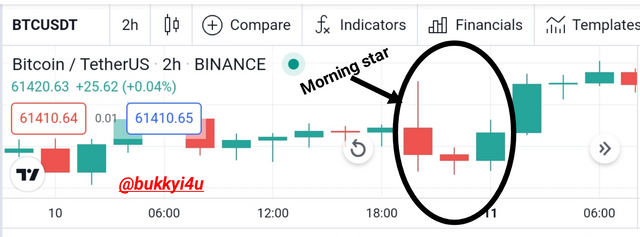
Normally, it is visually represented and is not calculated. It occurs on the chart with a three candle system where the low point of the system occurs on the second candle. However, this low point can only be determined once the third candle has closed.
It is always beneficial and more useful to combine other technical indicators with the morning star when it is formed to determine important market interpretations before entering any trade. This would help define whether the price action is actually close to a support zone and the RSI can be instrumental in determining whether it has been oversold or undervalued.
The Evening Star
Source
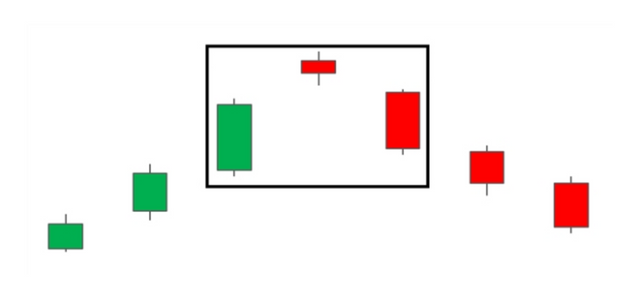
The evening star is a candlestick pattern that has been used by technical analysts to help determine whether a potential reversal of an ongoing market trend is about to occur. It is formed as a bearish candlestick pattern that is made up of three candles which include a large green candle, a red candlestick of small body and another large red candle. Normally, it is identifiable when an uptrend has got to its top. This means that an uptrending market is near or already at its apex.
The Morning Star is the opposite pattern of the evening star and is in itself interpreted as a bullish indicator. The evening star can, therefore, be useful in predicting possible price reversals to the downside, at least, in the short-term. Many traders view it as a very reliable bearish indicator and it occurs very rarely.
Source
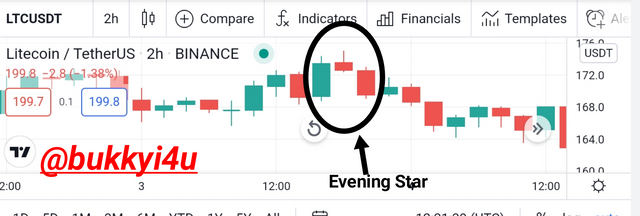
Usually, the psychology behind this trading system is that prices continue rising with the first candle. The second candle represents an increase in the price which is more modest and less aggressive. The third candle in this period under review signifies a large red candle whose opening price is actually below that of the immediately preceding candle but eventually closes at a point which is near to the middle of the candlestick which precedes it.
It is quite rare but when the evening star occurs it should be utilised with other indicators to give trading confirmations. It is not the only bearish indicator and different traders have various preferences when it comes to utilising candlestick patterns in determining potential reversal.
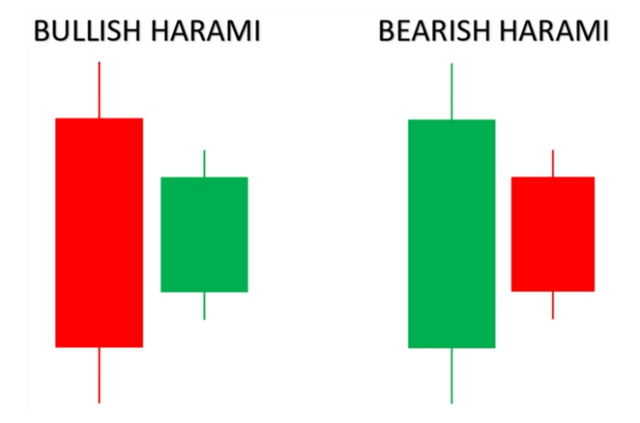
The Harami Candlestick Pattern
The Harami Candlestick Pattern has become a very commonly used chart pattern in trading which is quite instrumental in identifying possible market extensions or reversals of ongoing trends. It is a Japanese candlestick pattern which is made up of two candles. These two candles indicate possible reversal of the ongoing trend or portend a continuation of the already existing trend.
Harami is a Japanese word which stands for "pregnant" and represents the entire psychology behind the Harami candlestick pattern. The Harami candlestick pattern can be important in identifying both bullish or bearish signals as is represented in the image below:
Source
Bullish Harami
The Bullish Harami can be identified by the following situations or conditions:-
- A downtrend which is identified to be in place
- A larger bearish or red candle as the leading candle
- A trailing smaller green or bullish candle whose price gaps upwards after the leading bearish candle and which is actually contained within the opening and closing prices of the larger leading bearish candle.
Bearish Harami
The Bearish Harami can be defined or established by the conditions below:-
- An uptrend which is observed to be in place
- A large green or bullish candle as the leading candle
- A trailing smaller red or bearish candle whose price gaps downwards following the bullish candle and which is actually contained within the opening and closing prices of the identified leading bullish candle.
As is already shown in the images above the first candle which is the pregnant candle is represented by a large candle which is continuing the already existing trend. The trailing candle is represented by a small candle which protrudes in the manner of a pregnant woman. We should note that the second candle should technically gap inside or within the larger first candle.
Nevertheless, gapping occurs on very rare occasions since the market trades continuously especially in the crypto-currency space. So, the most technically right version of this particular candlestick pattern rarely occurs in the cryptocurrency market due to minimal occurrence of gaps.
The Harami Candlestick pattern indicates signals which can either be in a bullish or bearish direction. This would depend on the validating candle.
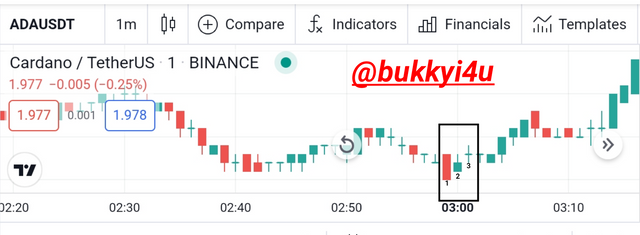
Source
The bullish harami above is actually a reversal of the already ongoing downtrending market. However, it is not all Haramis that would indicate reversals in the market.
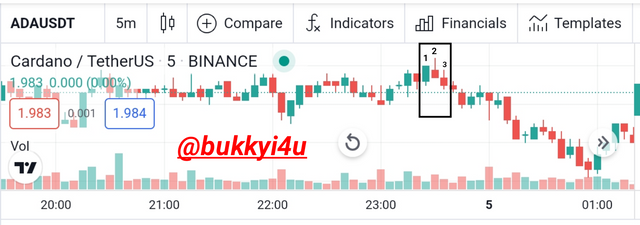
Source
The bearish Harami above is also a reversal pattern. Once the bearish Harami had been formed the validating or confirming or third candle actually indicates a movement in the bearish direction. So, attention should be paid to the validating or confirming candle when trying to trade with this pattern.
CONCLUSION
In cryptocurrency trading, candlestick patterns have become a very important system which is produced by price action as it continues its movement and can be very instrumental to traders when trying to identify possible price movements especially on the short-term. Some candlestick patterns can be instrumental in identifying possible continuation of the ongoing trend, a consolidation in the market or even possible reversal of trend.
There are over 40 recognisable candlestick patterns in the world of trading today. Actually, one should try to study and understand their useful applications when trying to trade with such candlestick patterns. However, it is necessary to remember that there is no candlestick pattern which can be said to be hundred percent correct in predicting the market. Some of the more popular candlestick patterns which we have studied include the bullish engulfing candlestick pattern, the doji candlestick pattern, the hammer candlestick pattern, the morning and evening star candlestick patterns and the Harami candlestick patterns.
Please do not use the #club5050 tag unless you have made power-ups in the last month that are equal or greater than any amount you have cashed out.
Please, @steemcurator02 from when do you start calculating the #club5050 because for the past 2 weeks now I have been powering up more than 50% of all my earnings and the criteria is seven days.