[Average True Range (ATR) Indicator]- Crypto Academy /S5W1-Homework Post for kouba01
Source

1. Discuss your understanding of the ATR indicator and how it is calculated? Give a clear example of calculation
The Average True Range (ATR) was invented by J. Welles Wilder Jr, who was a market technician, as a tool for technical analysis of price action. This indicator was introduced in his now famous book New Concepts In Technical Trading Systems. The tool is very useful and necessary for the measurement of volatility in the market. It does this through a system that involves the decomposition of the whole range of an asset being considered for any particular period of time. In obtaining the true range for this system we would consider the current high minus the current low, the absolute value obtained from subtracting the previous close from the current high, and then the absolute value obtained from subtracting the previous close from the current low.
Generally, the ATR exists as an entire system of a moving average which most widely uses the 14 day periods of the true ranges. So, a series of true range values would be obtained and the 14-day simple moving average of them will be used to constitute the indicator. Originally, the indicator was developed to be used majorly or primarily in trading or predicting the commodities markets. However, it has been applied and tested on other types of financial markets and securities including the cryptocurrency markets.
Calculation Of ATR
Usually, in calculating the ATR you would have to first determine a series of values for the true range of the asset. Ordinarily, the price range for a cryptocurrency asset would be obtained by simply subtracting the day's low from the high of the day. Meanwhile, a formula which defines the true range is shown below:-
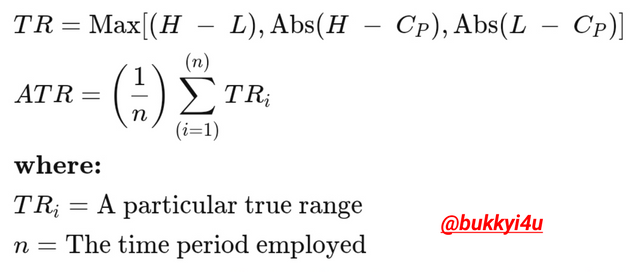
Source
The first step in calculating the ATR is to determine what the TR is. In doing this will take the steps below:-
- Current High - Previous Close
- Current Low - Previous Close
- Current High - Current Low
We would take the absolute value or the highest among all the results gotten from the above calculations. This becomes the TR.
We would finally calculate the ATR in the manner below:-
ATR = [(Previous ATR x 13) + Current TR] / 14
Typically, this is for a look-back period that considers 14 as its default setting. In a case where 14 is not the default setting, then the ATR can be calculated thus:-
ATR = [(Previous ATR x (n-1)) + Current TR] / n
Illustration:-
Assuming the following values:-
Current High = $1.241
Current Low = $1.062
Previous Close = $1.328
Previous ATR = $1.2
To obtain the TR:-
Current High - Previous Close:-
1.241 - 1.328 = -0.087
Current Low - Previous Close:-
1.062 - 1.328 = -0.266
Current High - Current Low:-
1.241 - 1.062 = 0.179
The absolute value is 0.179
So, TR = 0.179
Calculating ATR:-
ATR = [(Previous ATR x 13) + Current TR] / 14
[(1.2 x 13) + 0.179]/14
15.779 / 14 = 1.139857143
So the value of the ATR is approximately $1.14
2. What do you think is the best setting of the ATR indicator period?
By default the best setting of the ATR indicator is the 14 period. Changing the basic or default setting actually affects the sensitivity of the indicator. This standard setting of 14 signifies that the ATR would take a measurement of the price volatility by basing its results on the 14 most recent period for which it has been set. As has already been said, 14 days is the most typical of all these periods. Generally, as regards the changing of the settings of the ATR we should note that:-
When an ATR setting that is lower than 14 is used with the indicator it becomes more sensitive and gives out a moving average line that can be observed to be choppier in nature
Using a setting that is more than 14 periods would make the indicator to become less sensitive and this would make it to produce signals that are smoother in nature
The reason for the phenomenon above is because when lower settings are used on the indicator it now has a smaller number of variables or samples to deal with. Therefore, the sensitivity to recent price action is much more increased and this produces a reading that is actually faster in nature.
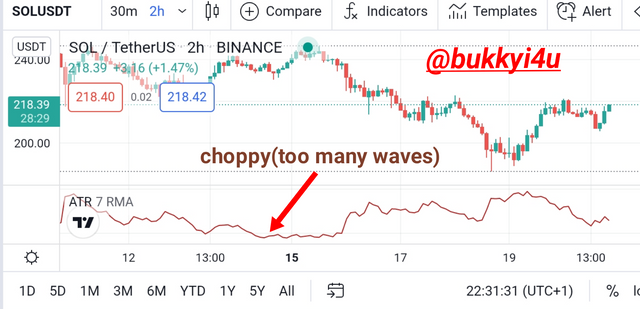
Source
By looking at the price chart above you will discover that the ATR has been set to a lower value of 7. This is actually half of 14 which is supposed to be the standard value. As can be observed, the ATR line appears to be quite choppy.
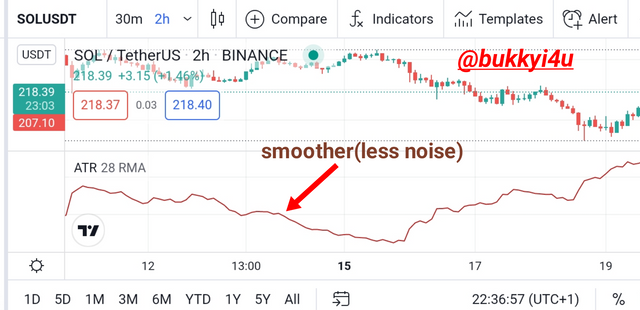
Source
From the cryptocurrency price chart above you will notice that I have increased the reading to a period of 28. Interestingly, you will observe that the result becomes much smoother.
What should be noted any time you decide to change the basic or default settings of the ATR is whether the changes you have implemented are actually making your trading results better or making them worse. To decide on this time you have to check out a series of trades based on your trading style and personal strategy. You should implement different settings for these trades as a test. Finally, you should take the time to compare the results to decide which of these settings was actually the most profitable for you.
3. How to read the ATR indicator? And is it better to read it alone or with other tools? If so, show the importance. (Screenshot required)
Actually, reading the ATR indicator can be straightforward because it simply appears like a single line that is located below the price action on the chart. From its general appearance it simply moves up and down in accordance with the price action. Whenever the ATR rises it means that there is more volatility in the market. On the other hand, when the ATR gets lower it is a signal which foretells lower volatility in the market. Nevertheless, we should not forget that the ATR itself does not actually give a signal of what direction the trend is likely to follow; it is only useful in indicating what is happening at the moment with regards to the price volatility.
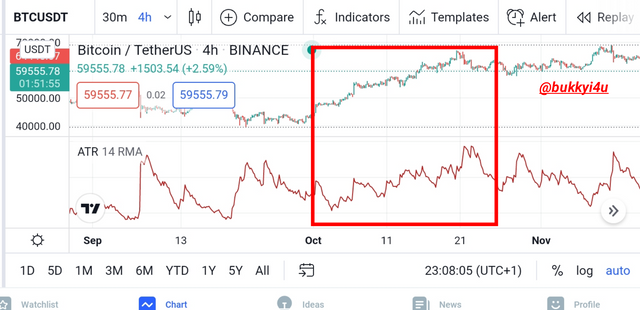
Source
From the image of the cryptocurrency chart above you will discover that whenever the uptrend or downtrend becomes stronger, the volatility of the ATR increases.
Consequently, the ATR is useful to determine the happening with the price action or the strength behind a current move since this is related to the volatility in the market. Nevertheless, a caution to remember is that the indicator should never be used alone. It would be useful to combine the indicator with an analysis of the price action as well as other indicators to give more credible signals, especially after weighing market momentum and likely short-term price direction.
ATR With SMA
This strategy combines the 20 Period Simple Moving Average (SMA) with the 14 Period Average True Range (ATR). In this simple strategy we would be watching out for when the price action will either cross above or below the SMA.
If the crossing of the price above the SMA is accentuated by an upward movement of the ATR then we should enter long on this signal. Conversely if the price breaks below the SMA and the ATR begins to move downwards we should enter short on this.
Usually, the stop loss should be placed with the chandelier technique that will be discussed in a subsequent section.
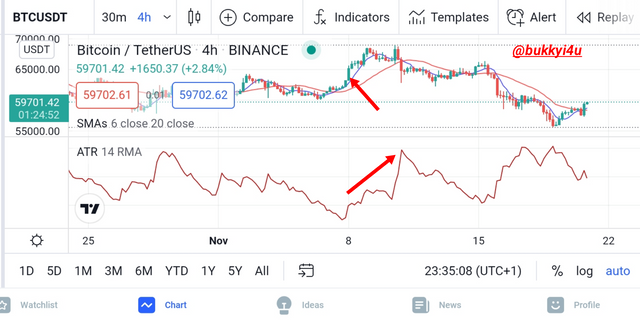
This is clearly demonstrated in the chart above in which case an upwards breakout above the SMA 20 is followed by an upward movement of the ATR confirming a bullish momentum.
4. How to know the price volatility and how one can determine the dominant price force using the ATR indicator? (Screenshot required)
In order to use the ATR to determine the volatility, you should remember that the ATR line prints higher points when the market is in a phase of high price volatility. Conversely, whenever the ATR line becomes depressed it should signify that the volatility of the price in the market has become relatively low.
Although the indicator does not give actual points for entry, its rising and falling can give a sense of the volatility and traders can decide to enter the market whenever it is discovered that the volatility is high. This is because whenever the volatility rises then there is bound to be much dynamism and faster movement of price action. In this case traders can benefit from either moves of the market whether upwards or downwards, especially when trading in futures. Low volatility being indicated by the ATR shows that the market is generally quieter and probably in a period of consolidation.
The ATR indicator may not be widely recognised or utilised as a momentum based indicator on a large scale. However, one of its important purposes is for traders who are conscious of volatility because it would help them to gauge the level of the volatility currently as a way of trying to anticipate the possibility of a potential break out of the price action. This is because when you become experienced in trading you understand that the market is likely to move from a period of low volatility to a breakout either upwards or downwards which would be marked by high volatility.
Source
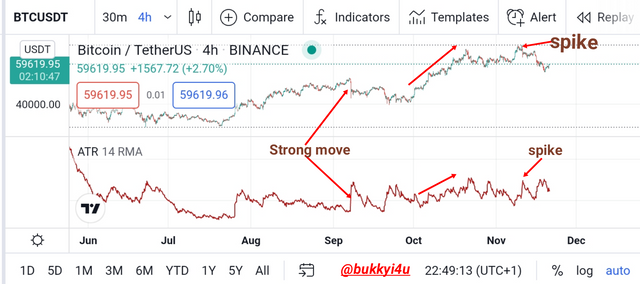
From the image above you will discover that anytime there is a spike in the price action the indicator equally experiences a spike in its movement. When the volatility is low it remains majorly flat. Anytime the price starts moving strongly in any direction either upwards or downwards the indicator begins to rise higher in a stronger way.
Discovering The Dominant Force
It is necessary to understand that this indicator can be used to determine whether the bulls or the bears are actually winning in the market at any point in time. In doing this we should remember that generally periods with high values for volatility as indicated by the ATR would correspond to the times when the trend is strong.
Source
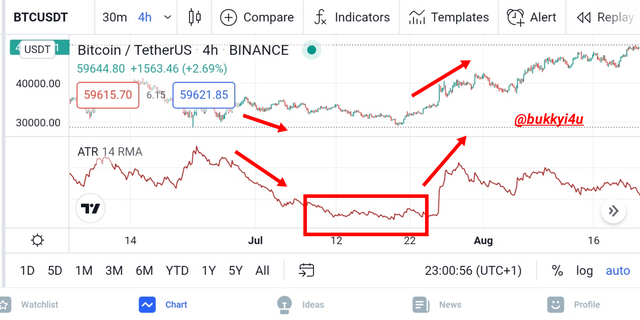
By looking at the image above you will discover that the point where the price rises but the indicator does not rise in accordance actually shows that the bulls are not in control. Instead, the bears are winning in the market and the strength presented in the buying pressure is quite insignificant. From the part where the market seems to be falling but the ATR is still rising it can be deduced that the bears are not controlling the market. Rather, the bulls are still in charge. These important situations tell us which of the forces are dominant in the market.
Consequently, we can decipher whether a move is just a minor correction or a major reversal incident. From the other part you would see that the price rises tremendously and the ATR rises equally this shows that indeed the bulls are in charge and are set to push prices further.
In the case where a reversal occurs, you would discover that the true reversals are marked by ATR values that begin to move in the direction of the reversal. If a reversal occurs but the ATR value does not move in the direction of the breakout or perceived reversal, then it could be a false signal to trade in the direction of such reversals.
5. How to use the ATR indicator to manage trading risk ?(screenshot required)
Normally, as a trader you would be faced with the challenge of determining how best to profit from the market cycle that has gone into a phase of volatility. This usually has to do with deciding on when the best time would be to exit either in gain or by cutting down tremendously on your losses. Already it is known that the ATR will not actually give us a sense of the direction a breakout will probably occur.
PHowever, it is possible to add the value of the ATR to the closing price and a trader would be hoping to enter a buy position the next day any time the price begins to trade above this value of the closing price. The rationale behind this is that anytime the price closes at a value that is higher than the ATR when the ATR is actually oscillating at a point that is over the most recent close, it can be deduced that a change has occurred in the volatility.
Exit With ATR
In using the ATR to determine exit either in gain or in loss, traders would usually follow the practice of trading based on signals that are derived from subtracting the current value that is observed on the ATR from the most recent close. Again, the logic with this rule is that for the price to close below the most recent close by more than one ATR, the nature of the market must have experienced a change significantly. In this scenario it is best to close a long position. This is due to the possibility that the price would likely enter a trading range or may even experience complete reversal at that point
Interestingly, the ATR can be applied to determine exit no matter the side which you are trading from. This has to rely on the Chandelier exit technique developed by Chuck LeBeau. This chandelier exit makes use of a trailing stop that would be placed below the highest high the asset may have attained from the time you entered the trade. Hence, the stop price would be placed at a place that is below the highest high with a value that meets the ATR when it is multiplied with some value. For instance three times the value of the ATR can be subtracted from the highest high attained to determine the stop loss.
6. How does this indicator allow us to highlight the strength of a trend and identify any signs of change in the trend itself? (Screenshot required)
I have actually touched on this in the previous sections. The ATR may not actually be able to identify direction. Nonetheless, I have said that it is very useful in telling the strength of the underlying trend or the strength of an infantile trend.
Periods of low volatility are often succeeded by periods of high volatility as a result of price breakout which can tend towards the upside or the downside. What's the price boxes off from either a resistance or support level and begins to move in any particular direction with increased momentum the ATR can be used to determine whether this is a likely favorable reversal or a false one.
In the previous sections we saw how prices were either rising and ATR falling or prices were falling while ATR rises. If a breakout occurs and the ATR does not begin to move in the direction of the new breakout it is most likely a fake out and should be avoided. When a breakup or cause the ATR should begin to move in the same direction as a confirmation of renewed strength of the trend in that same direction.
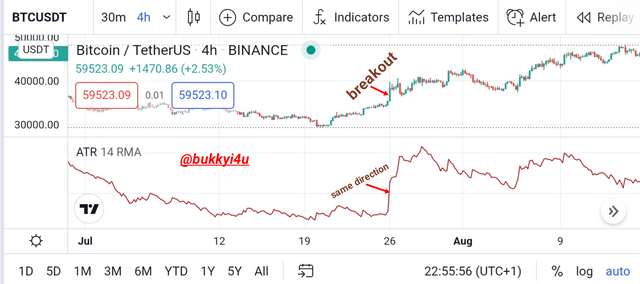
Source
From the image above you can see how a breakout occurred and the ATR actually begins to move in the same direction as the breakout. The result was that it was a favorable breakout having been confirmed by the signal of the ATR.
Reversal With ATR
Furthermore, it is possible to determine signs of trend reversal by resorting to signals generated by the ATR. When the volatility is high either to the downside or the upside the ATR rises in confirmation and shows that the bulls or the bears are currently winning in a particular direction at the time. When a period of low volatility is observed in the ATR it is obvious that neither bears or bulls are winning. This is a major sign that reversal is imminent as the current trend may have just approached a period of exhaustion.
Source
From the image above you can see the ATR falling with a strongly falling market in a downtrend. However, the ATR suddenly enters a phase of low volatility as a way of signalling that the current downtrend may have just gotten to a point of exhaustion. This indicates that this trend is waning. Eventually, an upward reversal has occurred and the ATR begins to rise in the direction of the new reversal as a confirmation that renewed vigor has entered the market in the opposite direction.
7. List the advantages and disadvantages of this indicator
Advantages
The ATR is known to change depending on the characteristics of the asset being traded because it is able to decipher the varying volatility presented by different market conditions
The break out systems of the ATR can be usefully applied to any time frame and especially for day trading strategies
It helps to determine accurate exit points for traders very easily and works by making it possible for stop losses to be placed in such a way that it can close the trades in small losses in a situation that the price goes back to the close that had been recorded by the first bar of any particular day.
Disadvantages
The ATR may not give any particular entry signal but they only provide information on the volatility of the market
The ATR may have to be used in conjunction with other trading systems or tools to make it more useful in giving out better signals
The ATR may also be useful in measuring the volatility and not in determining the possible direction of the price of an asset; this may often result in the production of mixed signals.
The ATR is subjective in its interpretation in that is does not recognise any particular value that could identify points of possible price reversal
CONCLUSION
The average true range (ATR) which was invented by J. Welles Wilder Jr is very important for analysing the action of a crypto asset's price. It is possible for the indicator to do this by making use of a true range which considers the current high, the current low, absolute value gotten from the current high minus the previous close and absolute value gotten from the current low minus the previous close.
Setting the indicator at a value that is lower than its default 14-day period would make it more sensitive and produce choppier signals whereas setting it at a value that is above that default setting would give it a smoother representation of the price action. The indicator has a lot of important applications which makes it possible for it to be used to determine which side of the market is currently winning especially in a situation whereby a minor correction could be confused for a total reversal.