On-chain Metrics(Part-3)- Steemit Crypto Academy- S4W5- Homework Post for @sapwood
Hello steemians, welcome to my blog again, In respect to the task given to us by our dear prof @sapwood on the study of on-chain metrics III. I will be attempting the task given below.
Calculation of Relative Unrealized Profit/Loss

To be able to calculate the Relative Unrealized Profit/Loss, we need to determine two important values,
- First the market capitalization (market cap)
- Realized capitalization (realized cap)
The market capitalization is the total amount of
Let's take BTC as an example, the market capitalization can be computed as thus:
Market Capitalization = 54,788.99 x 18,836,893
Market Cap of BTC = 1,032,054,419,849.34 (1.03 trillion)
On the other hand, Realized capitalization is calculated by adding up the price of all unspent transaction outputs (UTXO) based on their price when it was last moved [i.e. the amount of digital currency a trader have left after executing a transaction using Bitcoin (BTC) or any Bitcoin-based altcoins]; and then multiplying the UTXO with the circulating supply of the asset. The Realized Cap can be expressed mathematically as follows:
Usually, the UTXO is generated on a per transaction/user basis, and the circulating volume of a cryptocurrency could be easily ascertained by visiting CoinMarketCap.
Here is an example:
Let’s say I carried out three transactions on bitcoin, and I was left with some UTXOs worth the following: 0.2356 BTC (12,726USD), 0.103 BTC (5,563.58USD), and 0.0029 BTC (156.65USD), the Realized cap could be computed as thus:
- Realized capitalization = 18,446.23USD x 18,836,893
- Our realized capitalization is therefore: 341,469,661,000 (347.469661 billion USD)
Having identified our Market Capitalization and Realized Capitalization, we can go on to calculate the Relative Unrealized Profit/Loss (RUPL). This is calculated by subtracting the realized cap from the market cap and dividing the result by the market cap value. This is expressed mathematically as follows:
Example
Using the values we have obtained so far, let’s calculate the Relative Unrealized Profit/Loss (RUPL).
Relative Unrealized Profit/Loss (RUPL) = 1,032,054,419,849.34 - 341,469,661,000/1,032,054,419,849.34
Relative Unrealized Profit/Loss (RUPL) = 690584758849/1,032,054,419,849.34
Relative Unrealized Profit/Loss (RUPL)= 0.66913599279 approximately 0.67 RUPL
With the RUPL at 0.67, it is within the “Greed” zone, approaching and is approaching the 0.75 reading which is a profit-taking zone.
Calculating of SOPR - Spent Output Profit Ratio
SOPR is calculated by considering the value of a spent output in relation to the value when UTXO was created. Mathematically, SOPR is calculated using the formula below:
For example, the value of 1 BTC at point D (current value) (UTXO spent) is 53,972.70USD. However, this BTC/UTXO was created on September 1, 2021, at which point BTC was 46,919.51 (UTXO created). The SOPR can be calculated thus:
- SOPR = 53,972.70/46,919.51
- SOPR = 1.15032531243, approximately 1.15
As a rule of thumb, SOPR above 1 indicates profits, while SOPR below 1 indicates sales at loss. Thus, the SOPR value indicates a profit stage.
Relative Unrealized Profit/Loss, SOPR vs. MVRV Ratio
The Market Capital to Realized Capital Ratio (MVRV) is a market capital to realized capital ratio. The MVRV (Market Value to Realized Value) ratio is calculated by dividing an asset's market capitalization by its realized capitalization. By comparing these two variables, MVRV may be used to determine when pricing is over or below "fair value," making it easier to identify market tops and bottoms.
The Relative Unrealized Profit/Loss (RUPL) is used to evaluate the total paper profits/losses in Bitcoin. RUPL is the difference between the market capitalization and the realized capitalization divided by the market capitalization. It assists in identifying bullish and bearish cycle tops and bottoms. It is, in fact, the ratio of BTC profit-taking to market cap.
SOPR is a mathematical operation that determines whether or not a market is profitable. Its value is determined by dividing the unspent transaction output's selling and purchasing prices (UTXO). It is the ratio of UTXO's selling price to its buying price, and it helps identify bullish and bearish cycle tops and troughs.
Consider the on-chain metrics-- Relative Unrealized Profit/Loss & SOPR, from any reliable source.
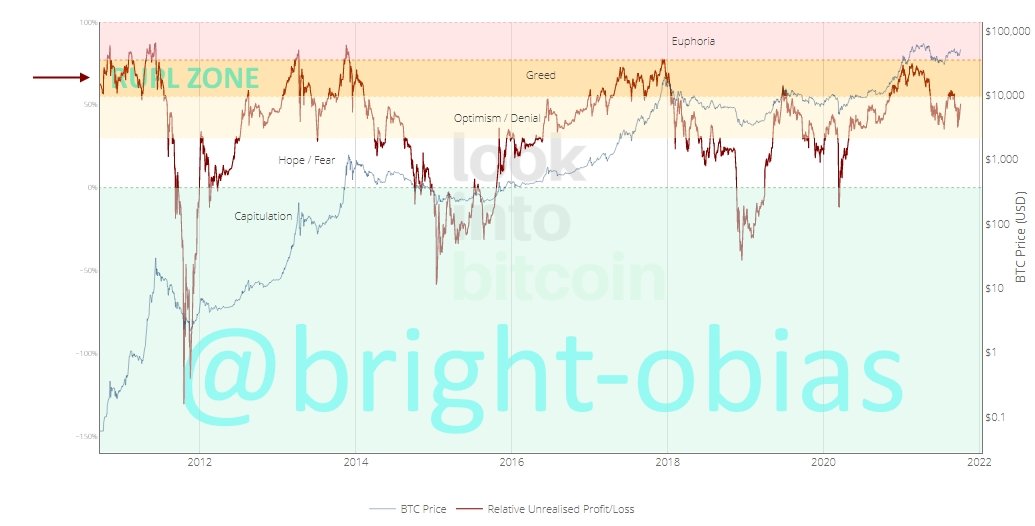
In this section, I will be considering the Relative Unrealized Profit/Loss & SOPR of BTC metrics. Now, begin I would like to glance at some points that should be taken into consideration.
In the chart, if the RUPL is between 0.00 and 0.75 it is actually indicating a bearish or a bullish trend which can also be verified using the cycle via the historical RUPL range.
It is also important to note that whenever the RUPL is above 0.75 or 75%, it signifies that the price of an asset is close to a profit-taking level which is called the cycle top, also seen as the highest price in the bullish cycle.
There is a lowest bearish cycle which is also known as the cycle bottom. Here, whenever the RUPL is below 0.00 or 0%, it means the price is close to the bottom.
Let's take a look at the chart below for further information.
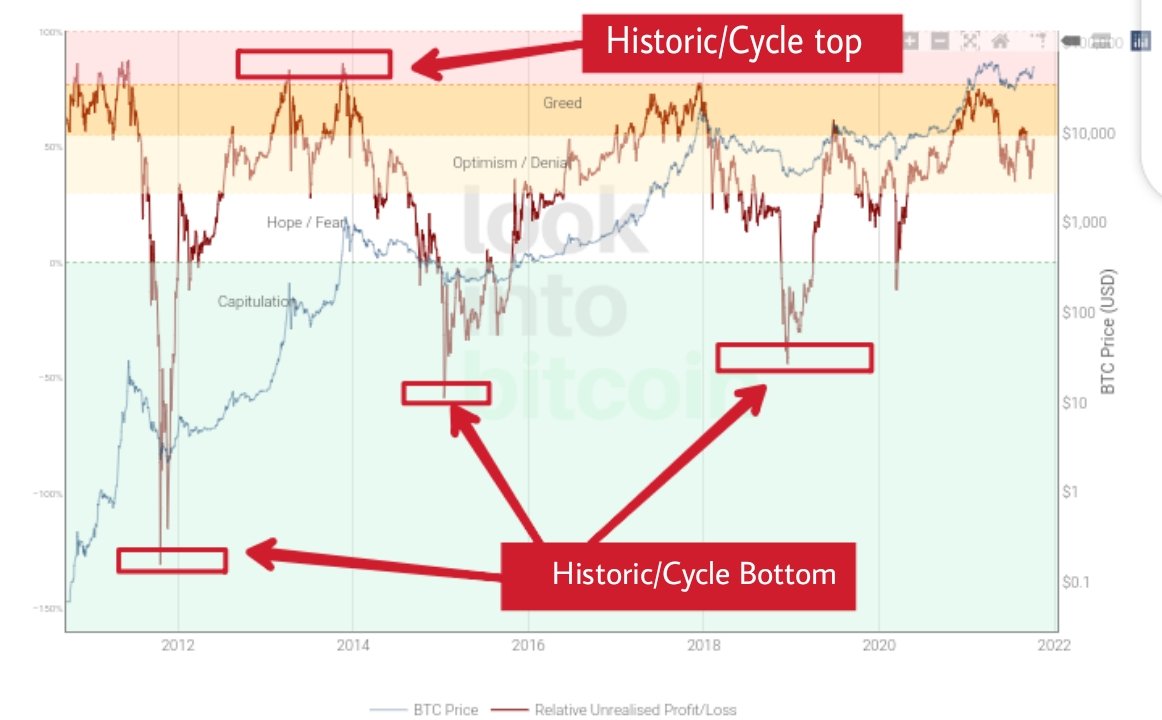
The above image shows the chart of the different points to consider. Now, looking at the chart, you will notice a negative RUPL in BTC assets as of March 2020 Where it had -0.11 RUPL and the price was trading at $5000 - $6k then.
When taken a close look, you will also notice that as of September 2021 the RUPL was 0.41 with a BTC price of $41,656, and to 0.49 at $49k all in October. Now with this methodology, it simply indicates a bullish trend where it is expected to increase to 0.75 RUPL.
Looking at the chart with a brief explanation, it is very clear that RUPL would have clear strength with the price this is because as the price of the asset increases so the relative unrealized value decreases.
Spent Output Price Ratio(SOPR)
This another on-metric is used to determine the local buttons and tops of a market cycle. Just like the RUPL, there are points to consider in order to understand this on-chain metric. Let's take a glance at them from the chart below.
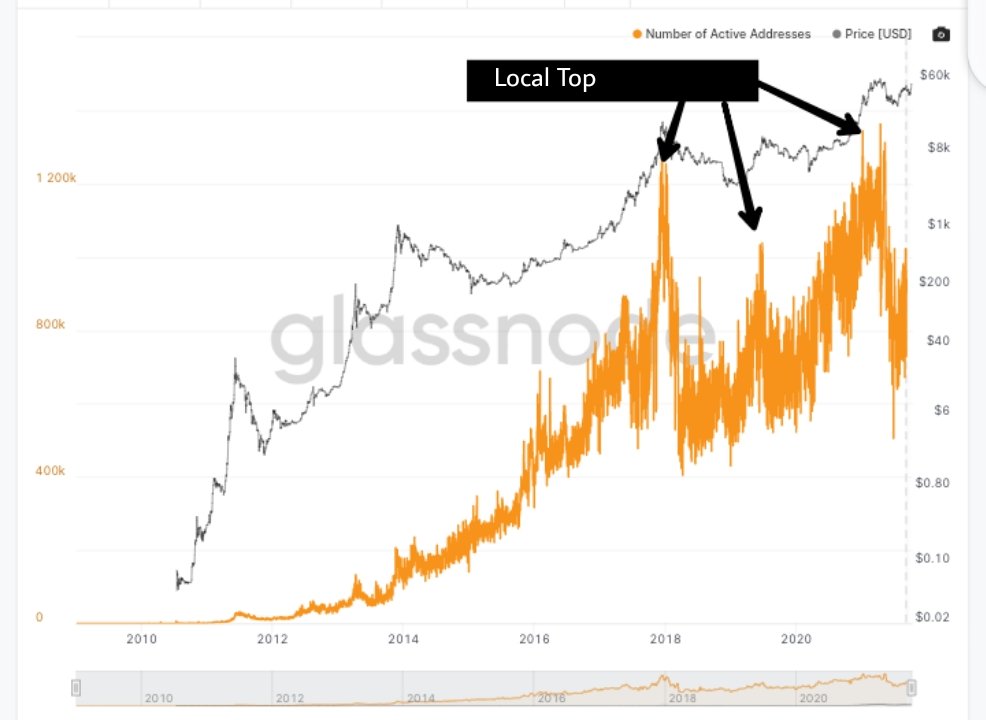
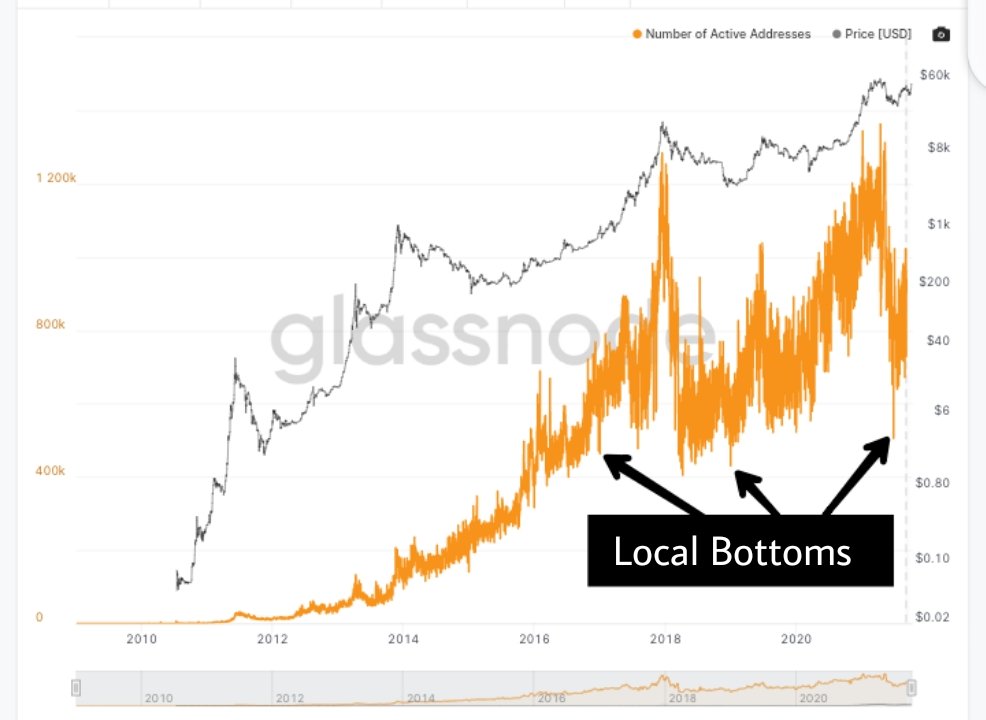
Now, from the above charts, the following points are to be considered.
- Whenever the SOPR is higher than 1, it will definitely form a local top
- If the SOPR is gradually departing from the button, and is within the range of 1, It is signifying to the trader a buy signal
- On the other hand, If it is also leaving the top and is heading downwards, it is actually telling the trader to sell (Sell Signal)
Apart from the aforementioned points to note, whenever the SOPR increases in value, it also increases the price of the asset thereby profiting the traders.
Furthermore, it is a proportion of value offered to cost paid for all exchanges directed inside a given time. Hence it shows the benefit that was acknowledged at a given period. At the point when we have progressive pinnacles of SOPR, it shows an upswing.
This infers continuous dissemination of the crypto asset. In any case, as the asset is spent or sold, it builds liquidity into the market in this way making the nearby top increment.
Uses Of Relative Unrealized Profit/Lost(RUPL), SOPR & MVRV In The Context Of Identifying Top and Bottom.
- RUPL:
RUPL is an on-chain metric that is used to detect historical tops and bottoms of a cycle, it is also used for long-term analysis, and it makes use of values ranging from 0.25 to 0.75, with 0.25 signaling a move to bearish movement and 0.75 signaling towards a bullish movement. The value of RUPL is gotten when unrealized profit/loss is divided by market capitalization.
- SOPR:
SOPR, is an on-chain metric that is used to identify local tops and bottom of a trend, either an uptrend or a downtrend, it is mostly used for long term analysis and the value of SOPR is gotten when the prices of buy/sell are divided by UTXO
- MVRV:
MVRV: it is an on-chain metrics that work together with either RUPL or SOPR to identify the tops and bottom of a cycle. It does this by showing the general state of the market in relation to the market capitalization and realized value.
Conclusion
In conclusion, I would love to thank the professor for taking us deeper into on-chain metrics, although I was not able to follow the course from part 1, however, I was able to understand the preamble of on-chain. Thanks to the professor - @sapwood as I will read up from the previous lecture to gather more knowledge