Crypto Trading With Rate Of Change (ROC) Indicator - Crypto Academy | S4W8-Homework Post for kouba01

EXPLANATION OF ROC INDICATOR

ROC is also known as the Rate of change. It is a momentum indicator that is used to show the percentage at which the price of an asset changes based on its current price in relation to the price at a previous certain number of periods.
The midpoint of the ROC indicator is zero (0), and when the price of an asset moves in an uptrend direction, the indicator tends to follow suit by moving upwards towards the positive side or values. When the price of an asset changes and starts moving downwards, the indicator follows suit by moving downwards, but to the negative side, or values. When the price of an asset tends to increase in either downtrend or an uptrend, it shows that there is an increase in momentum as such the value moves back to zero, showing that the momentum is weak.
The ROC indicator is used by traders to know the various changes that occur in the structure of the market. It can be used to detect Oversold and overbought zones where the values of -/+ 3 or 4% is used to show that.
It can also be used to detect divergence which will help to show a change in trend that is upcoming. Divergence is detected when the price of an asset is moving in a particular direction and then the ROC indicator tends to move in an opposite direction against the price of that asset.
The Zero line crossovers are used to show when a trend changes, and this change is based on the value of "n" that is used by a trader. When the ROC line crosses below 0 it tends to tell a trader that there is a strong bearish movement while a crossover above 0 tends to show a strong bullish movement.
The ROC could be quite deceitful as it could make traders lose huge profits by making them buy an asset before the price of an asset falls or make them sell assets just before the price of that asset increases, especially when it hovers around the zero line. It is quite advisable to use the ROC for trend confirmation rather than using it for trading purposes.
ROC Calculation
The formula for calculating ROC is;
ROC = {C price (p)-Cprice(p-n)}/Cprice(p-n)×100
Note that:
Cprice(p) is the closing price of the asset of the current period
Cprice (p-n) is the closing price for "n" periods that occurred before the current period
Example: The price readings of the ADA/USDT chart for observation of 25 periods is given below.
Cprice(p) = $2.18720
Cprice(p-n) = $2.12016
Putting the figures in the formula,we have..
ROC= 0.06704/2.12016 ×100
ROC = 0.03162×100
ROC = 3.162%
From the calculation above, it shows that price has moved from $2.18720 to $2.12016 in the bullish direction; therefore the ROC value is 3.162%. It simply shows that ADA/USDT has increased by 3.162%.
Demonstrate how to add the indicator to the chart on a platform other than the TradingView, highlighting how to modify the settings of the period best setting, (screenshot requireed)
I will be using Bittrex to demonstrate how to add the ROC indicator.
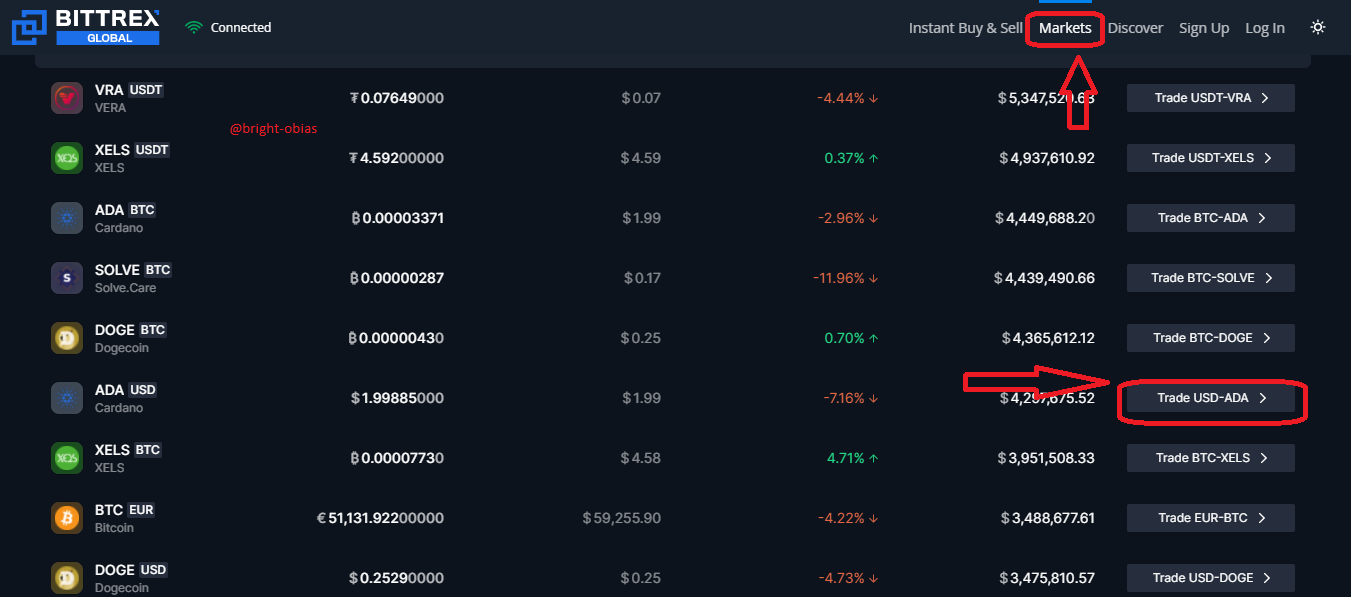
Visit the homepage of Bittrex

Scroll down to see market, after that select the pair of choice. In my case i am using USD/ADA. I will click on trade USD/ADA.
On the next page, click on "indicators" to add the ROC indicator.

Search for ROC indicator and click on it.

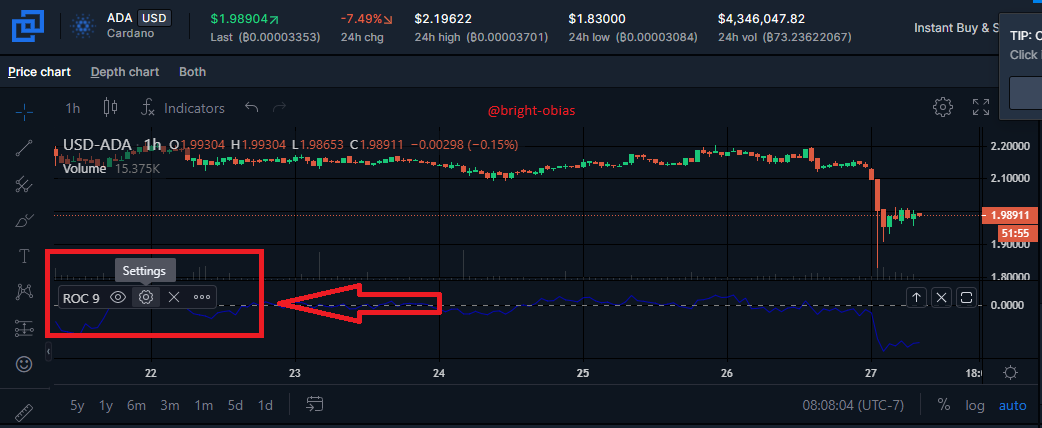
ROC indicator is displayed on the chart as seen below.

Configuring ROC Settings
On the chart, where the ROC indicator is displayed, click on settings
By clicking on style, the colour, line as well as thickness of the indicator can be changed.
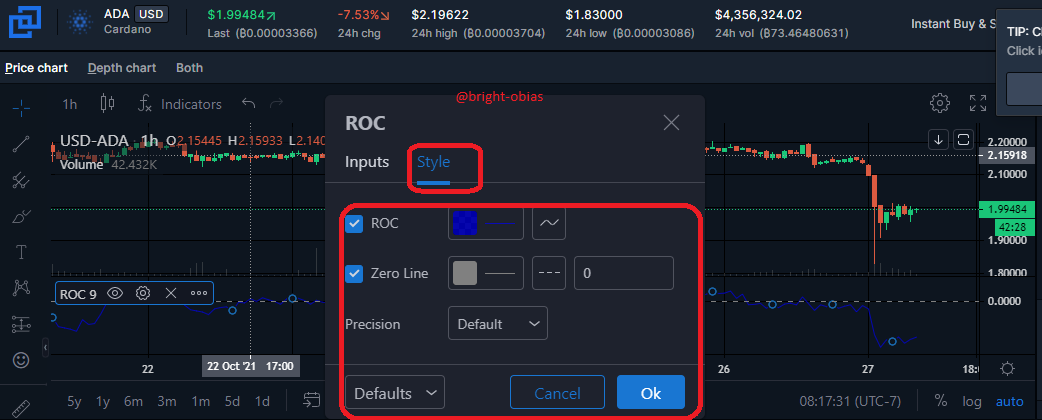
I changed my ROC indicator line from blue to pink.

ROC indicator comes with a default setting of 9. I changed my own to 12.

When it comes to the best setting, while using the ROC indicator, a trader needs to understand his trading style as well as the token that is to be traded. It would be wise for scalp traders to use a setting of 12 periods as this will suit their short term trading pattern, while it is advisable for those traders who practice long term trading to use a period of 25.
On the other hand, each trader has their personal preference, since the periods run between 12-25, a trader can choose a period between this range that is of interest to him.
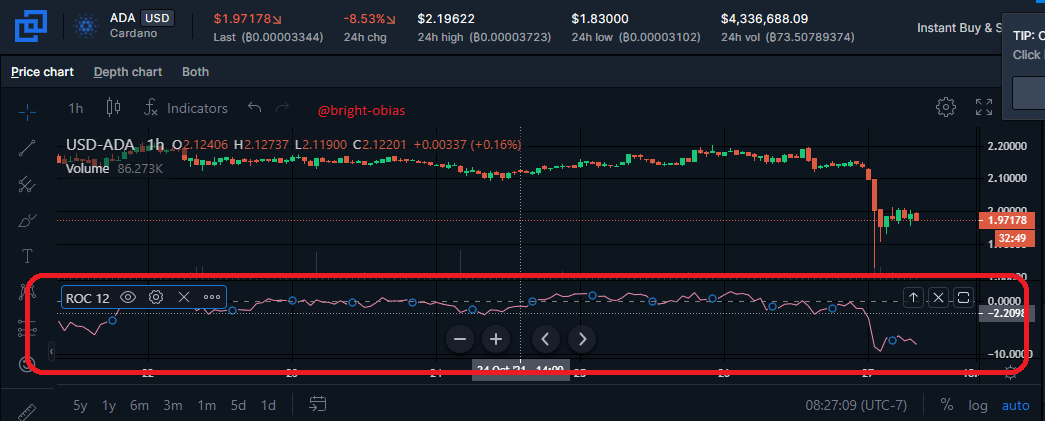
ROC indicator is now added to the chart below.
What is the ROC trend confirmation strategy? And what are the signals that detect a trend reversal? (Screenshot required)
The main aim of every trader before entering a trade is to maximize profit and reduce losses. To achieve this aim, it would be wise for a trader to always look out for the trend of the market. The ROC indicator can help a trader know the current trend of the market.
As explained above, ROC is a momentum indicator that shows the percentage change of the price of an asset for a given period, and this can be achieved when the price tends to hover around the midpoint or value which is 0(zero). In a bullish market, the ROC moves above zero to signal an uptrend, after which the price of that asset follows suit.
While to confirm a bearish movement, the ROC indicator is seen below the absolute value zero (0) and then the price of that asset tends to reduce signalling downward movement of price.
Trend REVERSAL
Overbought and oversold regions, as well as Divergence, are all given by the ROC indicator. With these, a trader is able to notice when there will soon be a trend reversal. In the case of divergence, the ROC indicator tends to move in the opposite direction against the price of an asset.
It also makes use of the crossover to detect trend reversal, and this occurs when the line of the ROC indicator cuts across the midpoint(0) which could be either above or below it.
What is the indicator’s role in determining buy and sell decisions and identifying signals of overbought and oversold? (screenshot required)
Role of ROC Indicator in Determining Buy and Sell Decisions
For traders in an active market, the challenge is to identify the best spot to place a trade (buy) and the best time and position to exit the market (sell), with the ultimate aim of making profits. With the foregoing in mind, the Rate of Change (ROC) indicator promises to facilitate the decision-making process by helping traders to identify market entry and exit points.
With the ROC indicator, the aim is to buy when the market momentum is at its weakest point but is recuperating, usually during a point where there is an obvious sign of a trend reversal as marked on the chart below.
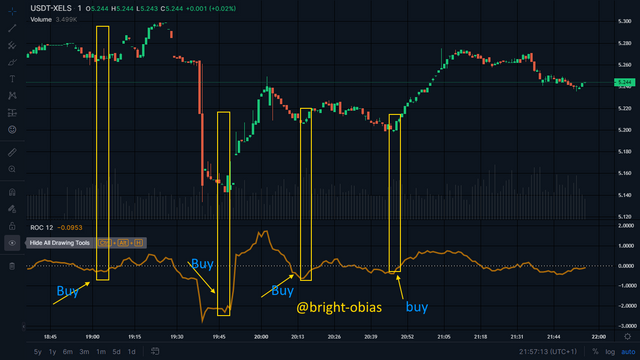
XELS/USDT
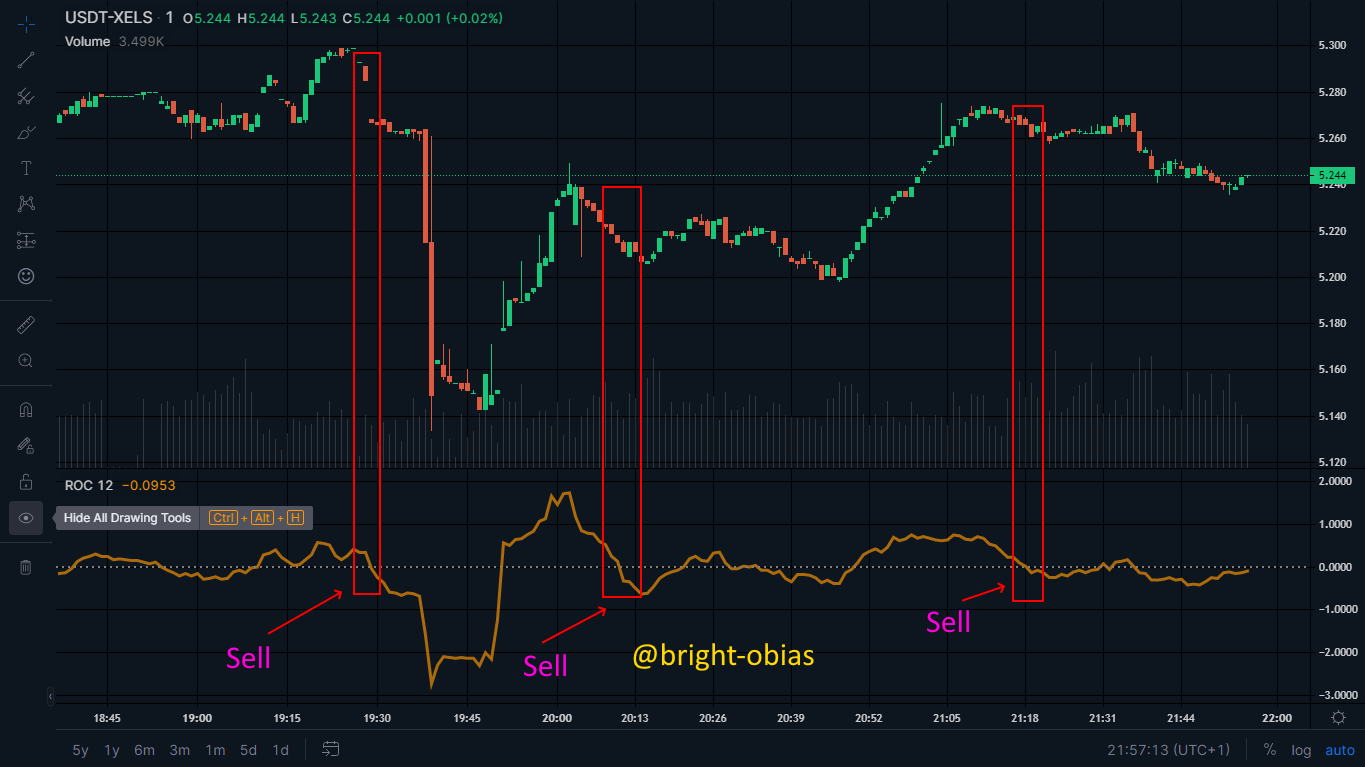
The inverse of the above applies for selling/market exit. The best exit point is where there is an observed approaching downtrend. This is at the point that it is evident and expected that the ROC indicator will go below the zero line. This is illustrated in the chart below.
Role of ROC Indicator in Identifying Signals of Overbought and Oversold
To identify whether or not an asset is overbought or oversold, we have to first consider how volatile the asset is and then draw a trend line at around -5% or more depending on the volatility. However, the asset under review currently is not as volatile, so I will be taking my overbought and oversold zones at both -4.0% up and down.
The overbought zone will be when the ROC indicator spike crosses the upper -4.0% overbought criteria.
The oversold zone will be when the ROC indicator spike crosses the lower -4.0% oversold criteria.
Both cases are shown on the screenshot below:
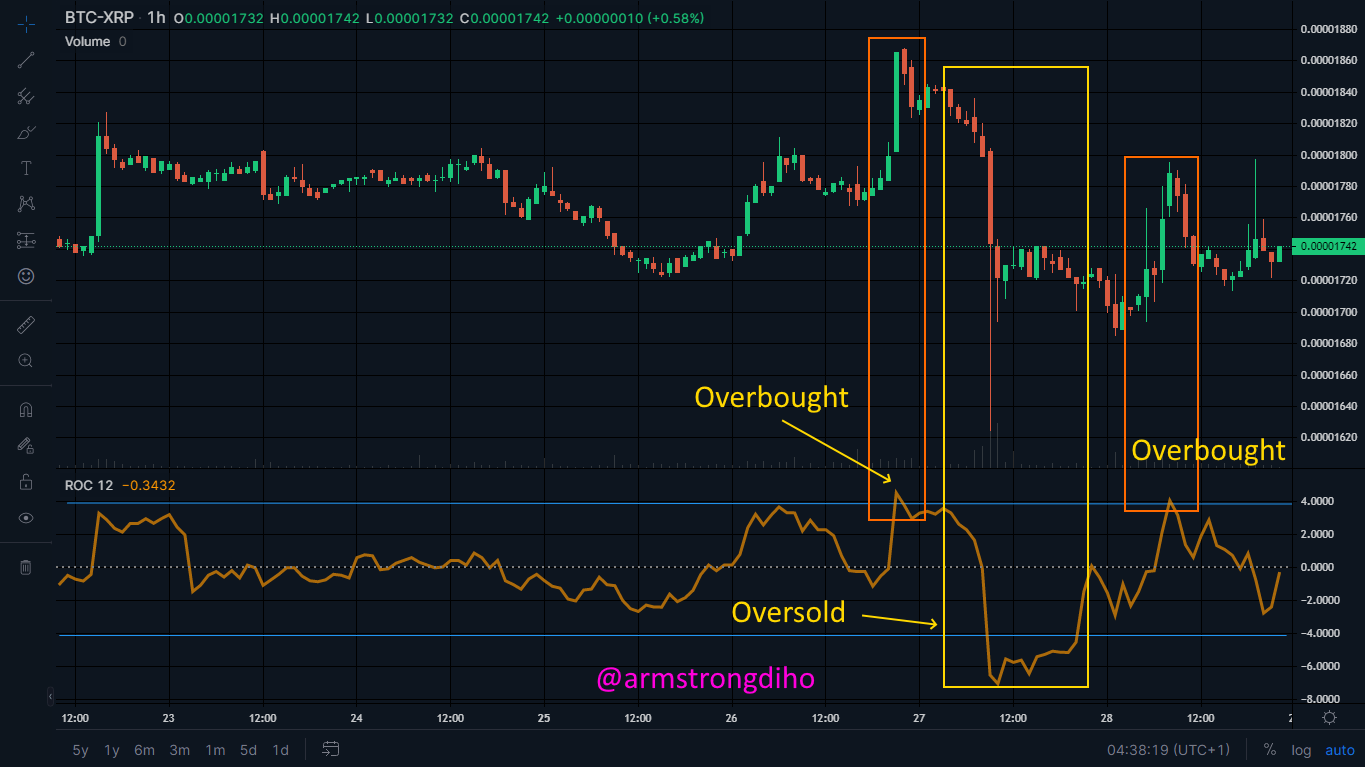
Based on the data above, it is evident that our overbought and oversold areas need to be very significant but once they appear, there is usually a trend reversal, so one can take advantage of these points during trading. In the overbought zone, the best-trading action will be to close a trade/exit, while in a recuperating oversold zone, the best-trading action will be to place a trade/buy/make market entry.
How to trade with divergence between the ROC and the price line? Does this trading strategy produce false signals? (screenshot required)
Divergence is an area in a chart where there is a sudden change in price movement usually from an uptrend to a downtrend movement or vice versa.
A bullish divergence is simply the movement from a downtrend to an uptrend. As shown in the screenshot below, we observed a brief bearish period which was quickly followed by a brief bearish period.
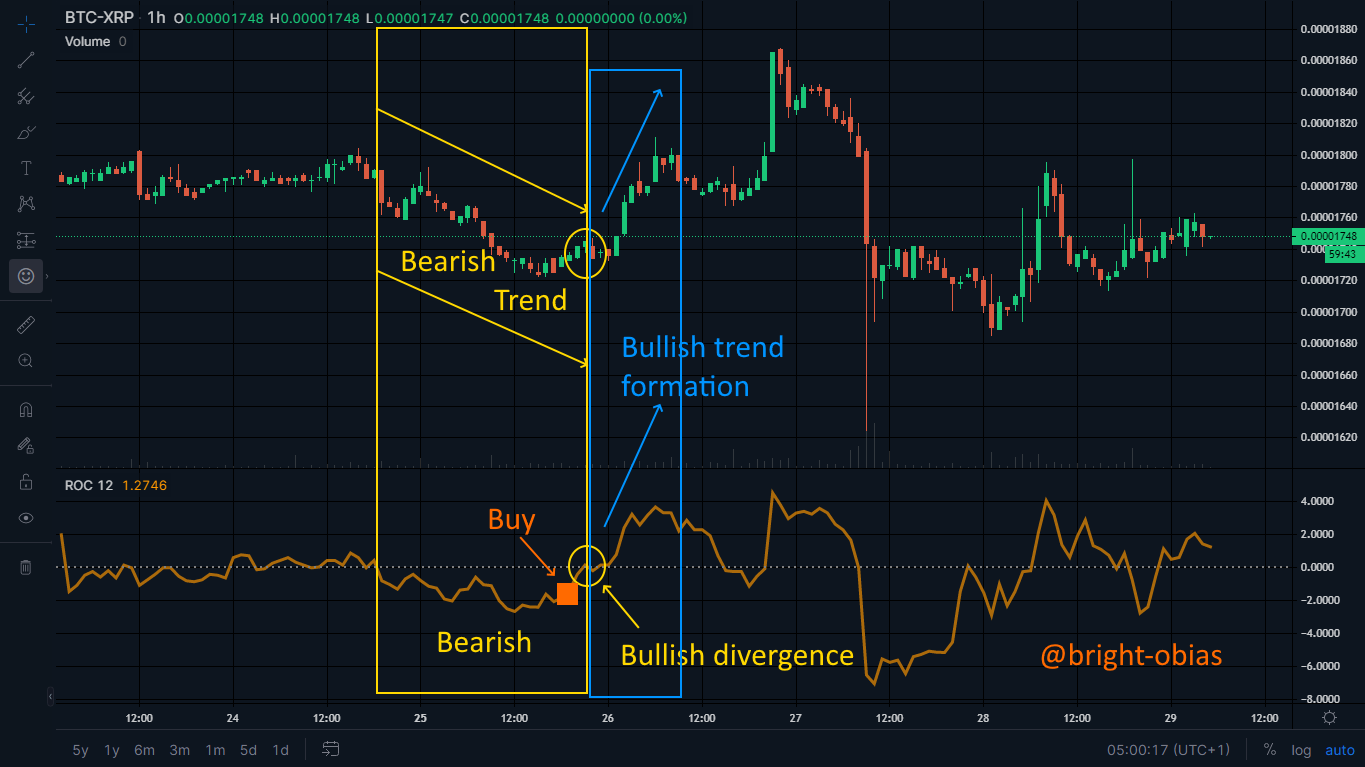
As observed, a divergence will always follow a zero line break. For the bullish divergence, we observed a break from below the ROC indicator to above it. To trade bullish divergence, we simply take a trade close to the break line below the zero line area.
A bearish divergence occurs when there is a sudden movement from a bullish trend (uptrend) to a bearish trend (downtrend) formation. This is shown in the chart below:
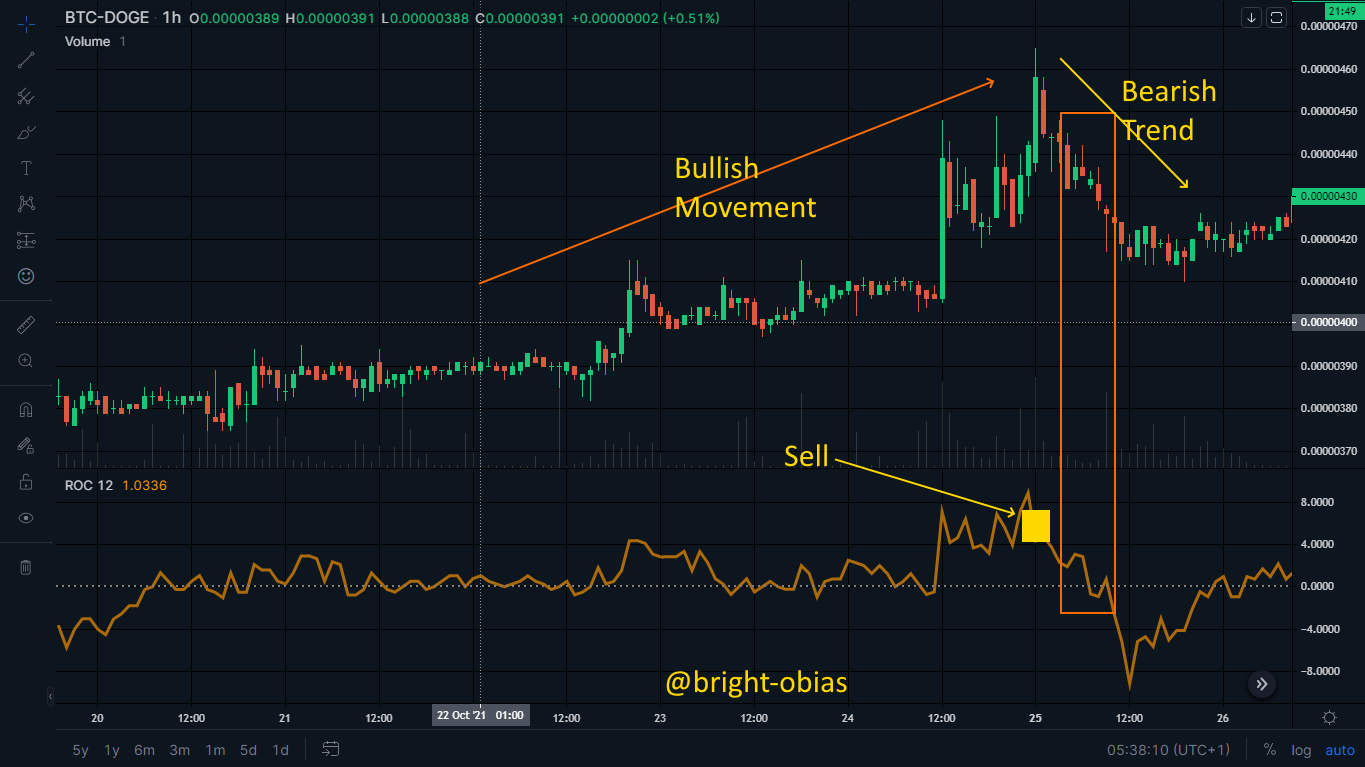
As observed, there was a long bullish movement that culminates at a resistance level and a downtrend followed immediately which could be confirmed with a zero line breakout.
Does this trading strategy produce false signals?
No trading indicator is perfect, thus, the possibility of producing false trading signals by the ROC indicator exists. Sometimes, the ROC indicator could produce a totally false signal (a few times though). However, what is most common with this indicator is the production of some exaggerated trading signals which could be misleading if one solely depends on it. To confirm signals provided using the ROC indicator, it may be best to pair it with other indicators while trading.
How to Identify and Confirm Breakouts using ROC indicator?
A breakout can be confirmed by observing/looking out for a sharp and sudden change in the price above the current support and resistance areas. Breakouts usually lead to the formation of new resistance with the formal resistance area turning into the support area.
Breakout points can be identified by closely looking out for sharp spikes below/above the zero line that usually exceeds the usually observed volatility marks/areas (overbought and oversold zones). This is clearly illustrated in the chart below:

From the chart above, we identified two break out zones, the first was a bullish breakout while the second was a bearish breakout.
Review the chart of any crypto pair and present the various signals given by the ROC trading strategy. (Screenshot required)
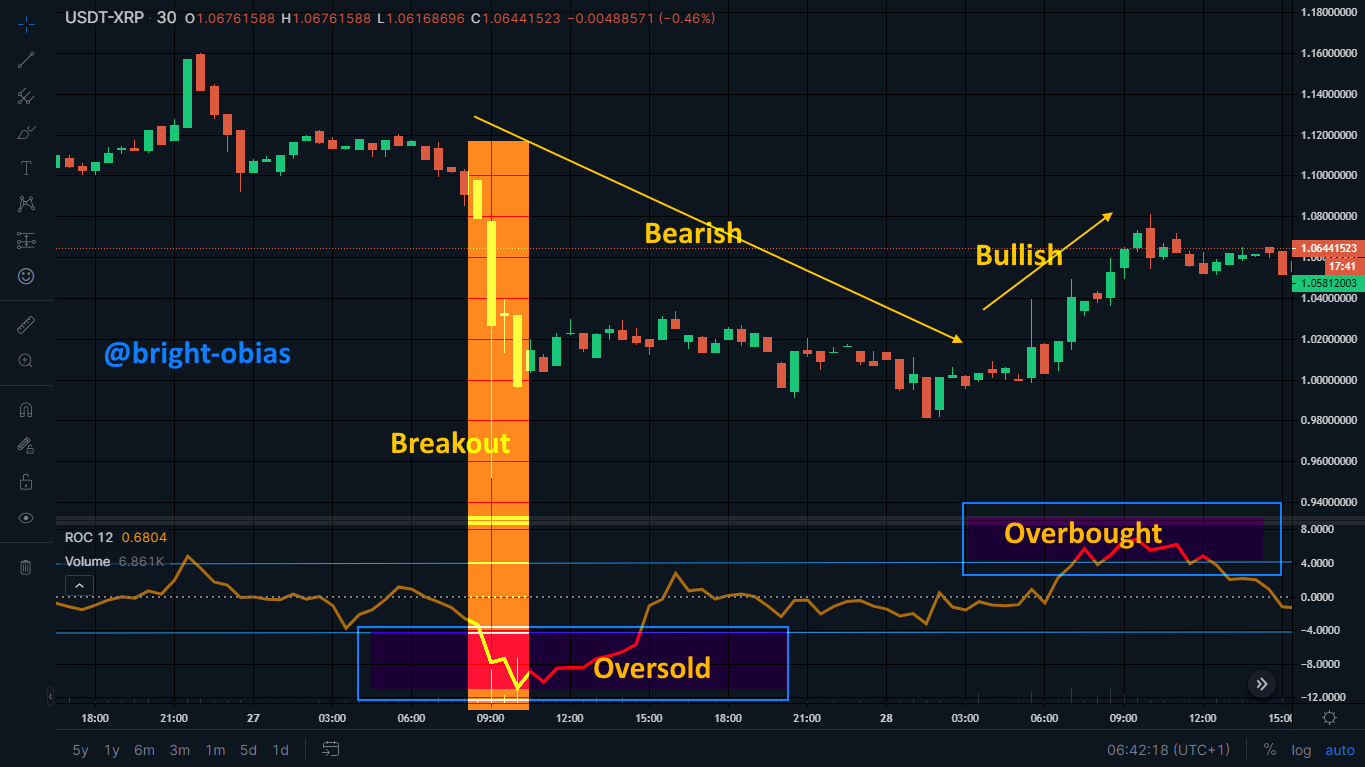
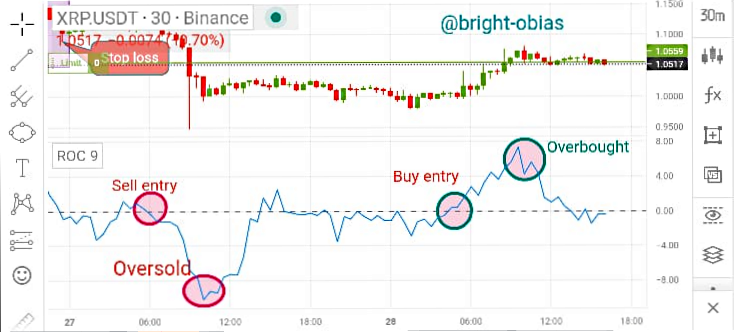
This screenshot shows the XRP/USDT Trading chart on which a fully configured ROC indicator has been applied. Using the ROC indicator, we could confirm the downtrend (bearish) movement, as well as the uptrend (bullish) movement in price. The chart also shows the overbought and oversold areas above our criteria mark of -4.0%.
Conclusion
Confirmation of trend is one important thing to put into consideration before entering a buy or sell trade. The ROC indicator is one that gives a buy and sells signal as well as the percentage changes in price. Its period has a value ranging from 12-25 which can be used or adjusted by any trader, to suit their trading pattern.
It would be wise to study and understand the ROC indicator before using it, as it could give false signals sometimes and this could lead to loss. Traders should try as much as possible to combine the ROC indicator with other good indicators, as well as apply Risk management before going into a trade.
@tipu curate
Upvoted 👌 (Mana: 6/7) Get profit votes with @tipU :)
Hello @bright-obias,
Thank you for participating in the 8th Week Crypto Course in its 4th season and for your efforts to complete the suggested tasks, you deserve a Total|7/10 rating, according to the following scale:
My review :
A good article in which you were able to answer most of the questions ably, and you have some notes that I made.
A detailed explanation of the ROC indicator and how to calculate its value. It was possible to use a graph so that the result and your conclusion is closer to reality.
As for the third question, in its second half, you did not go into depth in determining how to reverse the trend using the indicator.
In the last question it was possible to extract several other signals.
Thanks again for your effort, and we look forward to reading your next work.
Sincerely,@kouba01