(Re-Post) Trading Using Rectangle Pattern - Crypto Academy / S5W4 - Homework Post for @sachin08

Hello everyone. I am happy to be in Season 5 of Crypto Academy. Let's continue to work for the development of this community together.
In this week's topic, I will try to explain one of the trend formations, the Rectangle Pattern. This formation, which emerged as a result of the war between buyers and sellers, is an important formation for traders trying to make profitable transactions. After I understand the Rectangle Pattern well, I will try to provide a better understanding with some examples. I wish you pleasant reading.
1. Explain Rectangle Pattern in your own word.
2. How to identify Rectangles. Explain with Screenshots.
3. Can we use indicators with this pattern to get accurate results? Explain with Screenshots.
4. Explain Rectangle Tops and Rectangle Bottoms in your own words with Screenshots of both patterns.
5. Show full trade setup using this pattern for both trends. ( Entry Point, Take Profit, Stop Loss, Breakout)
The Rectangle Pattern is common in crypto and other financial markets. Rectangle Pattern, which is similar to parallel channel functions, occurs during periods when the markets move sideways and creates price movements in a region between the up (resistance) and down (support) zones. It should be noted that the price may break down towards both regions. But in general, the dominant party has been the party that determined the direction of the trend. If we look at it in terms of structure, the price movements it creates create double - triple tops and bottoms.
Rectangle patterns often have the same targets as other patterns. The price range, in which the buyers and sellers carry the price, is determined as the target in the transaction taken according to the breakout direction. When the price reaches that target, it is necessary to take profit or close the position completely if desired. In other words, the rectangular structure formed by the horizontal price is the target of the next price.
If we look at the rectangle formation in this example, we will understand it more easily. The structure formed by the price cannot make either an upward or a downward breakdown. This situation changes only when the region where the dominant side carries the price and has tried and can not break before is broken. We can easily see the contact made by the upward breakdown of the price to the target region.
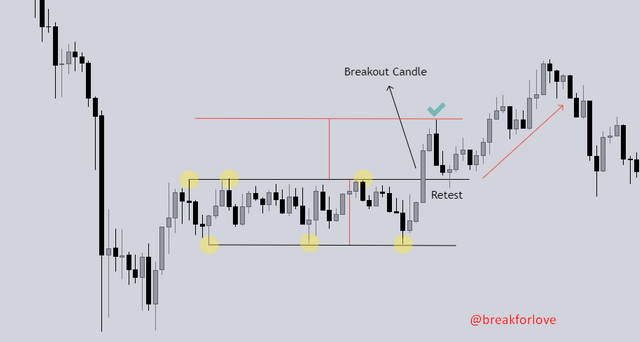
There is a factor that we can use as a clue to understand whether the price breakdown is a fake or a real breakout. If the candle that the price breaks through is like in the example above, we usually understand that this breakout is a real breakout.
We have some tips for identifying rectrangle occurrences. By detecting these formations, we can perform successful transactions within the rules. There are a few rules to understand whether a price pair has a rectangular structure in its structure. These rules are:
1. First of all, it is necessary to know the direction of the price movement. Although we do not always see a breakout in the direction of the trend, usually the dominant side is the side that determines the direction in which the price will continue. Therefore, the first thing we need to do is to determine the swing movements of the price. For example, an asset that makes higher lows and highs is in an uptrend. If an asset moving in this direction has formed a rectangular structure, it would be logical to anticipate that buyers may be dominant and wait for the breakout in that direction.
2. If the trend of the price is known and the price has entered a stagnation period, the second thing to know is whether the price is starting to tumble between the support and resistance zones. If the tested support and resistance zones cannot be broken, the price structure of the asset has started to get stuck in a rectangle. Generally, the asset that starts to form a double top or double bottom gives the trader a clue that the pattern has formed and the trader starts positioning himself according to the direction of the trend.
3. The asset, which has tested the support and resistance zones 2 or 3 times, should now break out of that zone with a breakout. It is also important for the trader to understand whether this breakdown is fake or not. If the breakout candle is with a strong candle, the path to the goal of the rectangular structure has begun.
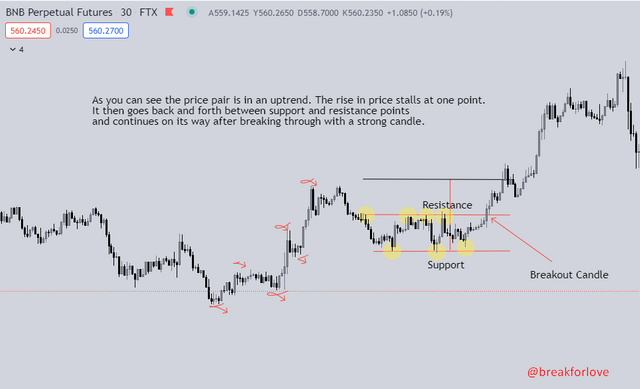
The chart above is a good example of forming a rectangle. In the example of the BNB / USDT pair, the asset is in an uptrend. It then enters a pause period and moves up and down between support/resistance zones. Knowing the direction of the trend, the trader positions himself in the direction of the resistance breakout. After the second contact, it waits for the breaking to come with a strong candle. As we can see in the chart, with the arrival of the breakdown, the price continues to progress until the target of the rectangular structure.
If we detect the formation of a rectangle on an asset, but we think that we cannot find enough data, it is also possible to use the indicators we call auxiliary tools. The data provided by these indicators is one-to-one to make our job easier when identifying the structures we are looking for.
As we know, rectangular structures are formed as a result of the price movement up and down in a certain range. The support and resistance zones are tested several times and the price is stuck in a certain range. When I think about the structure of this formation, Bollinger Band may be the most useful indicator in my opinion. The Bollinger Band, which we learned in the previous lessons, is a type of indicator consisting of the upper, middle and lower bands, which allows us to predict the future price movement with the movements of the price between these bands. The trick here is that if a squeeze is observed in the Bollinger Band, the price may break out hard to the downside or upside after a while. Assuming that rectangular formations also cause price compression in a certain area, we can easily use this indicator as a helpful tool.
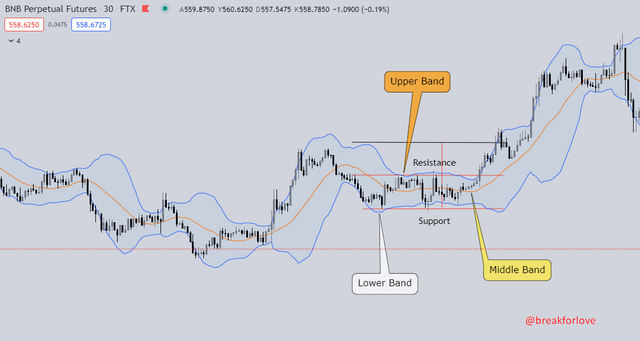
For example, when we add the Bollinger Band indicator to the BNB / USDT pair, we can see that the BB indicator in the region where the rectangular structure is formed performs a squeeze. The fact that the zones determined as support and resistance zones coincide between the lower band and the upper band in the Bollinger Band gives us the clue that this structure is a Rectangle. Knowing the trend direction, the probability of the squeeze in the Bollinger Band to explode in one direction, and the strong breakout candle allow the trader to make 3 separate confirmations to enter the position in the right place. In this way, both using the indicator and observing the formation rules pave the way for opening a profitable trade.
We know that the Rectangle Pattern can occur both from top and bottom. Let's understand this better with screenshots in two different examples.
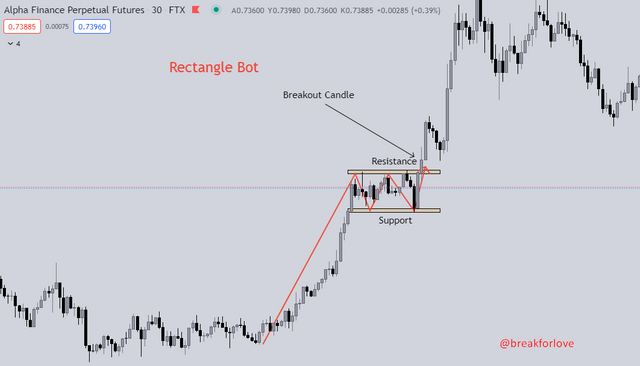
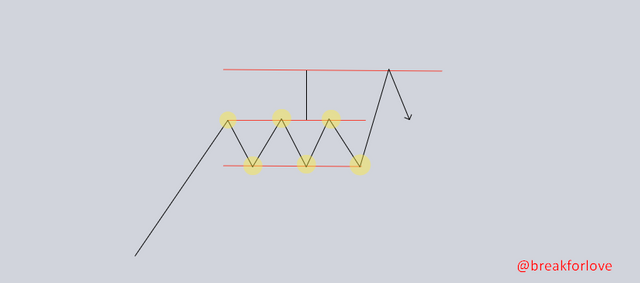
In the chart above, we see the ALPHA / USDT pair in an uptrend. A rectangle formation stands out in the area where the price paused after the sharp rise. It then continues its upward movement with a hard candle. In the example here, we can call it the Rectangle Bottom, since the price creates a rectangular pattern thanks to its top-down movement. The first reaction that the price receives from the area seen as the resistance zone creates the support zone. After this initial support zone visit, it continues on its way to retest the resistance zone and if it fails to break through the resistance zone, the Rectangle Bottom formation begins.
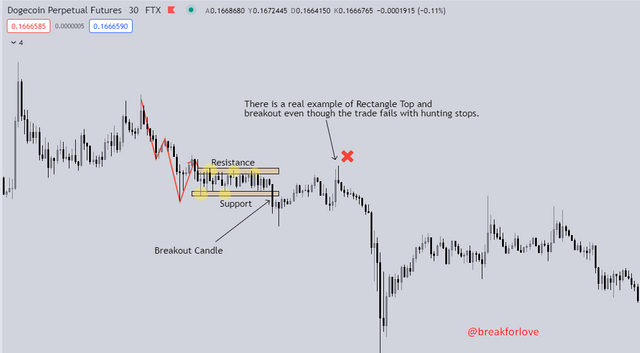
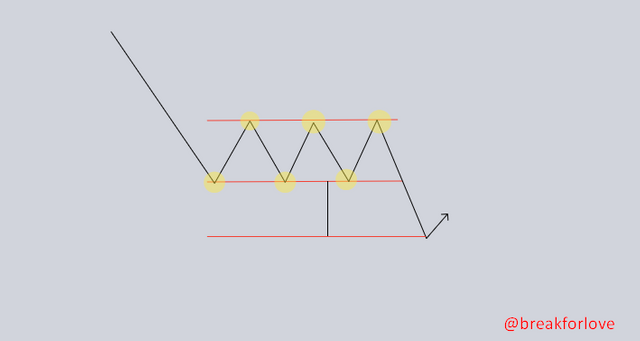
In the chart above, we can see the price action of the downtrend DOGE / USDT pair forming a Rectangle Top. The initial reaction from support after making a new Lower High (LH) continues as buyers push the price towards the resistance zone, but fails to break through the price zone that acts as the resistance zone. Then, the price action in this range breaks the support zone and continues its trend. It is also called Rectangle Top because the initial reaction is up from support.
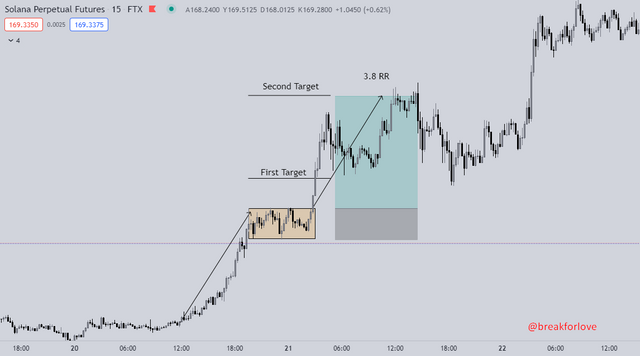
When we look at the SOL/USDT pair, we can easily see that the price has formed a rectangle after the sharp rise. After receiving confirmation that the price has tested the support and resistance zone at least 2 times, we jump into the trend with the rise in the 3rd candle. The region we set as stop is below the support. If you want to be a successful trader, you have to follow the rules. According to this formation, the first target is as much as the structure formed by the rectangle. You should take your profit at the first TP point because there is no certainty that the asset will continue to rise. However, due to the possibility of continuing the upward movement, you may not close the position completely, and you can wait for another TP point.
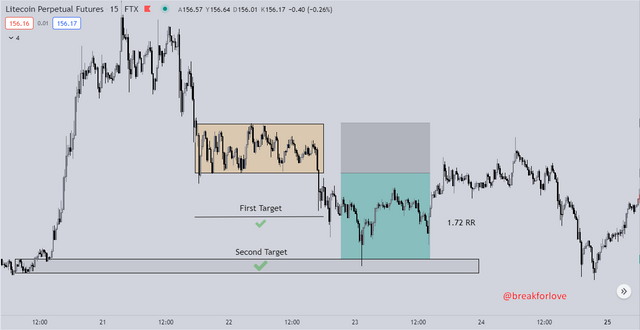
In LTC / USDT pair, we take a sell-side position. The asset, which entered the downtrend right after the uptrend, at some point becomes unable to fall any further and gets a reaction. However, it gets stuck between support and resistance and starts a chain of movements whose direction is uncertain but gives a clue (downtrend) to move in the direction of selling. Support-resistance zones tested at least twice give us confirmation of the formation. The strong candle that broke the last support zone is our entry point, and the top of the zones that work as resistance is our stop loss zone. We still take the height of the rectangle as TP, but if you are a trader who thinks that the price will visit the untested order blocks below, you can set that as the second TP. As a matter of fact, the price is getting reaction from that region.
Price formations, trend lines, and patterns are important movements by which a trader can predict the price direction and position his trades accordingly. In this assignment, I tried to explain one of these formations, the Rectangle Pattern, which is mostly seen at the points where the trend will continue, which is called the price formations that occur as a result of the war between buyers and sellers. I tried to inform you about what we should pay attention to in order to detect this formation, which indicators we can use as an auxiliary tool, where we can enter the positions if we were to use this formation.
Thank you for reading.

Here is the link : https://steemit.com/hive-108451/@breakforlove/trading-using-rectangle-pattern-crypto-academy-s5w4-homework-post-for-sachin08
CC: @sachin08