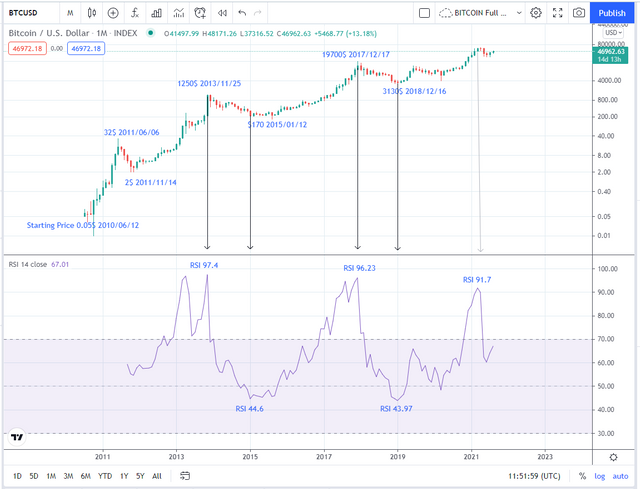
Bitcoin complete historical price chart with monthly RSI
This is a very consistent & accurate way to analyze bitcoin price. You can see montly RSI curve is relatively smooth curve (compaired with other time frames) and keep in mind monthly RSI when bitcoin price is bottom & peak of each cycle.
So these data might be helpful when to enter & exit bitcoin market.