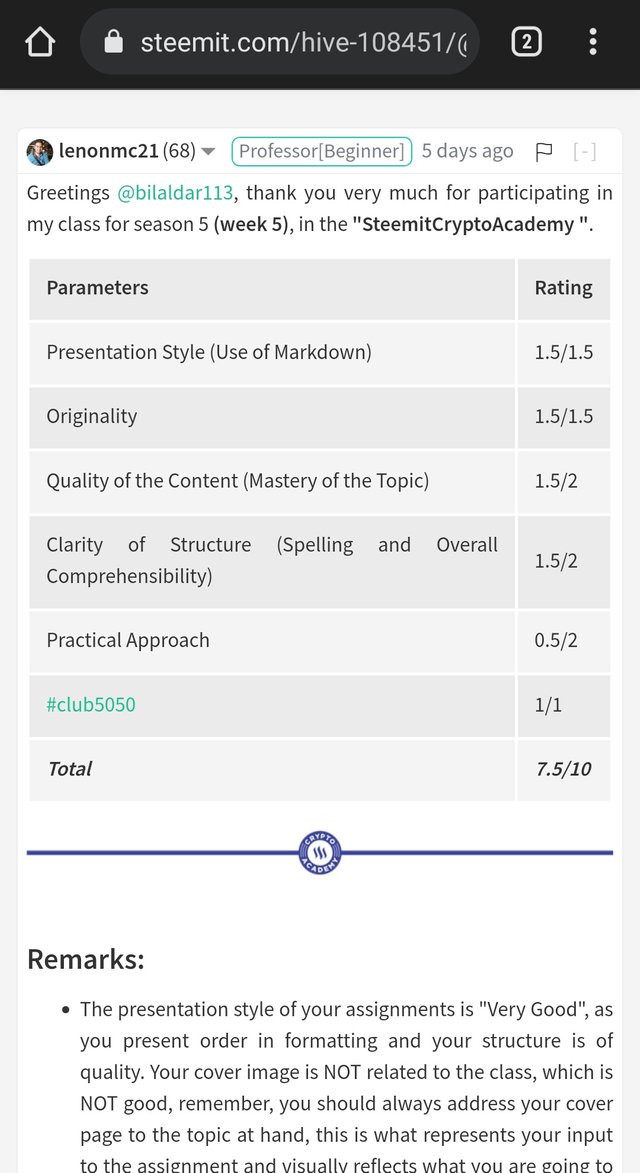
REPOST: Crypto Academy Season 5 Week 5- Trading Strategy With The VWAP Indicator - Homework Post for @lenonmc21
Designed by @bilaldar113 Using Post Maker

Hey Everyone!
This is my homework post for professor @lenonmc21 who has shared a knowledgeable course with the community relating to VWAP which is a popular indicator among crypto traders. I will share all that I have understood about this homework through the below-mentioned questions.

THEORY
Explain and define in your own words what the “VWAP” indicator is and how it is calculated (Nothing taken from the internet)?
Explain and define in your own words what the “VWAP” indicator is and how it is calculated (Nothing taken from the internet)?
VWAP is the short form of Volume Weighted Average Price. It is the most recommended technical indicator that is used by countless traders. It is highly preferred because it composes several unique traits which make it distinguished from other indicators.
VWAP provides results based on the present-day while other indicators use old data of the commodity to generate results due to which the signals are not accurate at all. That’s why you can observe that the majority of traders use VWAP as it is based on real data.
This indicator uses the total volume of money traded, price, and number of daily candles to provide results. The plotted line works as a support and resistance to the price and also shows the future price action. Additionally, a trader doesn’t have to change the setting based on the timeframe as the indicator adjusts itself and provides the best result accordingly.
As for calculating the VWAP, the procedure is quite easy as all you need is the Price of the commodity which is indicated by P, the volume of the commodity traded which will be indicated by V, and the total amount of candlesticks in a day indicated by C.
Once all these data are gathered, you can find the result by solving the mentioned formula.
VWAP = (P + V) / C
Explain in your own words how the “Strategy with the VWAP indicator should be applied correctly (Show at least 2 examples of possible inputs with the indicator, only own charts)?
Explain in your own words how the “Strategy with the VWAP indicator should be applied correctly (Show at least 2 examples of possible inputs with the indicator, only own charts)?
Applying VWAP Indicator
Applying VWAP Indicator
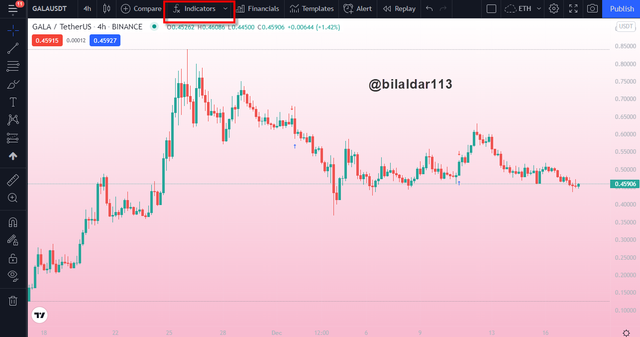
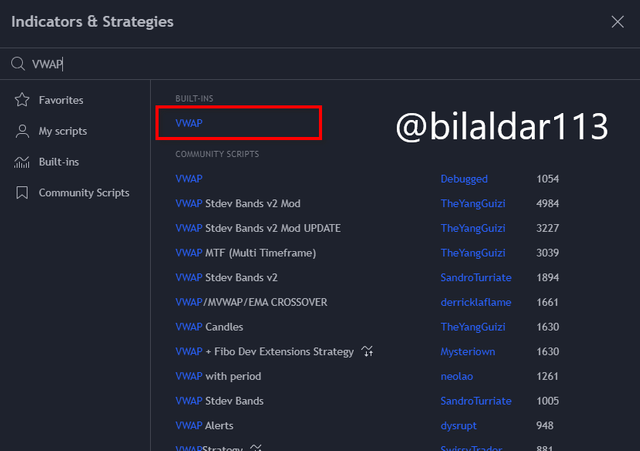
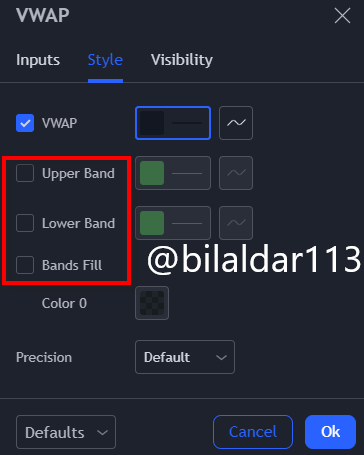
I will be showing you how to apply the VWAP indicator and trade using this strategy in detail. It will be helpful for you to learn the entire procedure and trade accordingly. So, let’s start by applying the indicator first.
Trading Strategy of VWAP Indicator
Breakdown From Bearish to Bullish
Breakdown From Bearish to Bullish
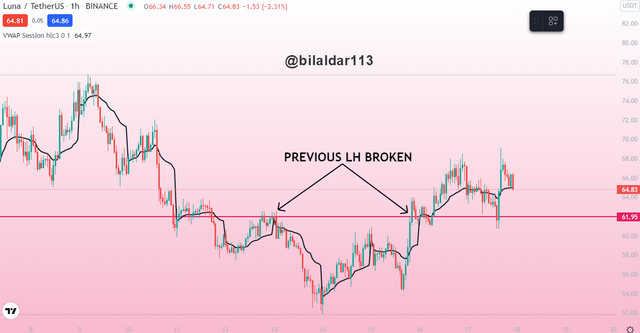
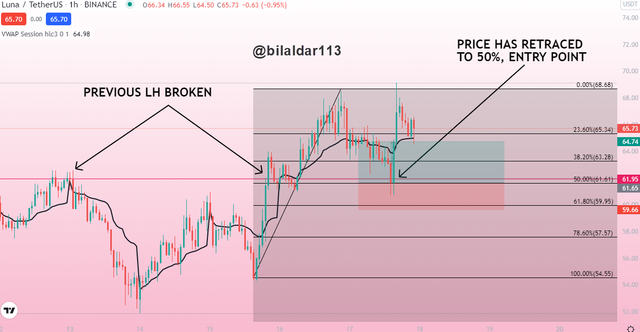
The initial step of the VWAP strategy is to find the breakout of the market. If the commodity is bearish, then it has to break the previous lower high and make a new high for a successful breakout. We can find the breakout of bullish to bearish market in the same method. Once it is found, we also have to be sure that it has flipped the VWAP line, then we can move to the second step.
Applying Fibonacci Retracement
Applying Fibonacci Retracement
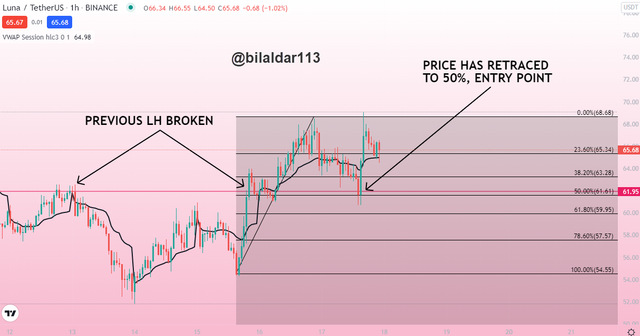
Fibonacci retracement is a great tool to find the perfect entry on any trade. As you can see that first I found the breakout and after that, I applied Fib Retracement so that I can predict the next retracement and enter the trade once it comes to 50% to 61.8%.
I have applied it on the chart and the price touched the 50% of Fib Retracement which was the entry point.
Managing Risk
Managing Risk
After entering the trade, I will manage the trade to avoid loss and gain profit. The stop loss is always placed below 50% or 61.8% and the TP is managed according to the preferred RR. I always use 1:5 and that’s how I have managed by trade.
Explain in detail the trade entry and exit criteria to take into account to correctly apply the strategy with the VWAP indicator?
Explain in detail the trade entry and exit criteria to take into account to correctly apply the strategy with the VWAP indicator?
Be it any trading strategy, there are some rules that should be strictly followed as they can minimize the risk of loss. I will share the entry and exit criteria of applying the VWAP strategy. It is important to follow because if you don’t know when and how to trade using this strategy, then it can be full of risk. So, I advise you to follow the criteria that I will be explaining.
PRACTICAL
Make 2 entries (One bullish and one bearish), using the strategy with the “VWAP” indicator. These entries must be made in a demo account, keep in mind that it is not enough just to place the images of the entry, you must place additional images to observe their development in order to be correctly evaluated.
Make 2 entries (One bullish and one bearish), using the strategy with the “VWAP” indicator. These entries must be made in a demo account, keep in mind that it is not enough just to place the images of the entry, you must place additional images to observe their development in order to be correctly evaluated.
BULLISH TRADE
BULLISH TRADE
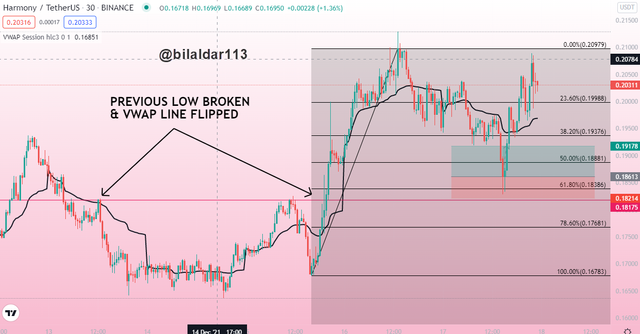
This is the example of VWAP trading on bullish trade. I have made the setup on the crypto chart of HARMONY/USDT with everything like an entry point, selling point, and much more.
The HARMONY/USDT was in bearish movement but the price made a breakout by crossing the previous low. So, I applied Fib Retracement on the impulse move and waited for the price to retrace to 50% or 61.8% and when it did, I opened the trade and marked everything for your understanding.
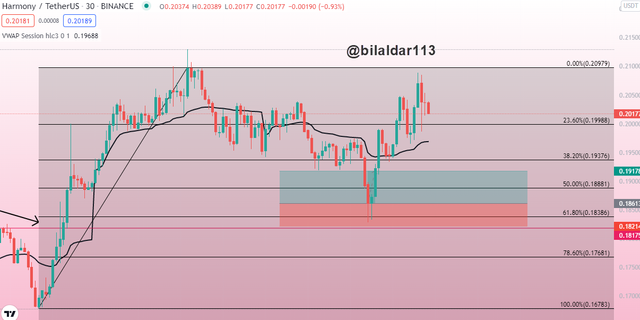
I managed the trade by putting Stop Loss below 61.8% from my entry point. The below chart is proof that the price really hit my TP.
BEARISH TRADE
BEARISH TRADE
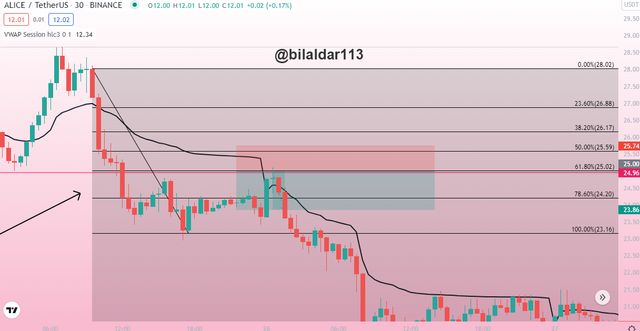
This is the bearish example of the VWAP strategy that I have presented on the ALICE/USDT chart. The price was in bullish momentum and broke the previous high while flipping the VWAP line. The next thing I did was to apply Fib Retracement which shows my entry point. I have marked everything according to the criteria on the chart.
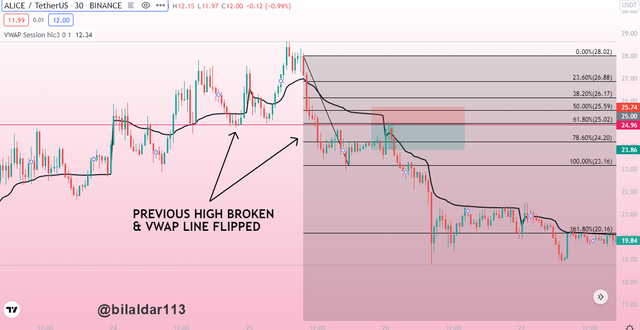
The below chart shows that the price touched 61.8% which was my short signal and I managed the trade by putting stop loss above 50% and TP as per 1:5. I got profit because the price touched the TP as it become bearish as predicted.
Conclusion
Conclusion
Now, I would like to sum up my homework and it is that the VWAP is a nice indicator that provides data based on real-time data. The strategy that I have learned is very easy and can help the trader to gain amazing profit. After my demo trades, I also learned that it has a huge success rate and is good for higher and small timeframes.

Thanks For Visiting My Post
Cc: @lenonmc21
Link of my expired post
@steemcurator02
https://steemit.com/hive-108451/@bilaldar113/crypto-academy-season-5-week-5-trading-strategy-with-the-vwap-indicator-homework-post-for-lenonmc21
Sir @steemcurator02 plz check it.
Greetings dear @bilaldar113
Please re-post this post as you did and notify me by "Discord" Lenonmc21-[Trader™]#4128 to pass it to the curators.
Steemit Cryptography Professor.
@lenonmc21
Ok Sir Thanks