Double Top and Wedge Trading - Crypto Academy S6W2 - Homework Post for @imagen

Designed by @bilaldar113 Using Post Maker

Greeting Steemians,
Greeting Steemians,
Most welcome to my homework post for the second week. In today’s task, I will explain everything about double top, double bottom, falling wedges, and rising wedges as told by the professor in the lecture. So, let’s take a deeper look at these famous patterns:

1.) Explain in your own words the concept of Double Top, Double Bottom, and Wedge. How to interpret each one?
1.) Explain in your own words the concept of Double Top, Double Bottom, and Wedge. How to interpret each one?
There are several chart patterns to predict the future price of an asset. In this task, I will explain everything about the double top, double bottom, wedges and how they can be interpreted in the market.
Double Top
Double Top
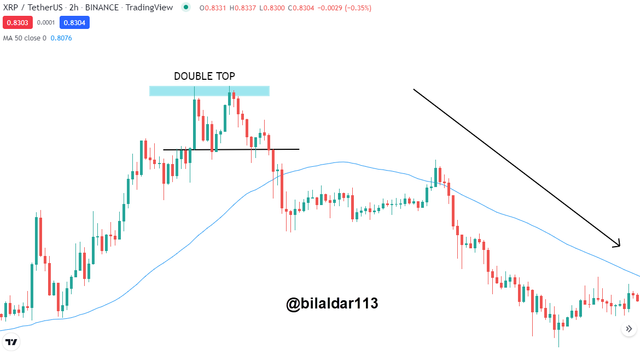
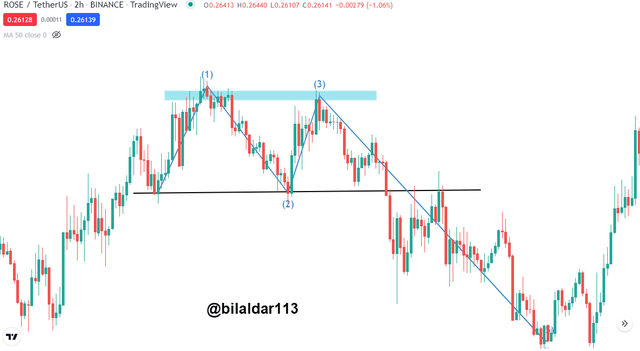
The double top is one of the best chart patterns that actually looks like the letter M and indicates that the price will make a bearish retracement. It is formed when the price makes a high but fails to sustain the bullish trend, then touches the neckline which is like a supply zone, and once again makes a high of the same length followed by a minor bearish retracement to the neckline.
A trader has to wait for the price to break the neckline and retest the newly formed resistance the price. Thus, it is the best pattern that gives a profitable sell signal. You can also refer to the below-mentioned image to find out what it looks like.
Double Bottom
Double Bottom
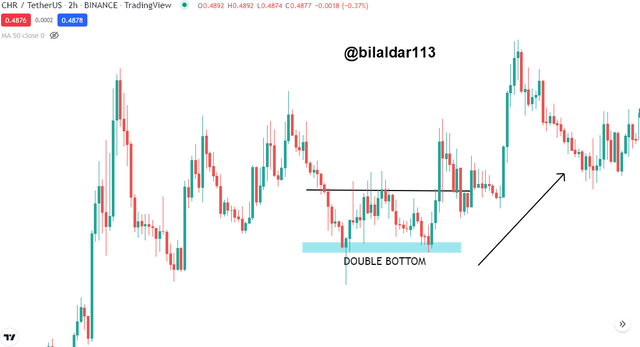
Double bottom is the complete opposite of double top. It looks like the letter W and provides a buy signal to the traders. It is formed when the price touches the neckline twice and ends up breaking it third time and starts a strong bullish trend. You can see from the below-mentioned image what the double bottom looks like in the market.
Wedges
Wedges
Just like the double top and double bottom, wedges are a famous pattern that predicts the bullish and bearish trend. It is easy to identify in the market and provides great profit. However, there are 2 types of wedges that are falling wedge and the rising wedge. We will take a look at both in the following sections:
Falling Wedge
Falling Wedge
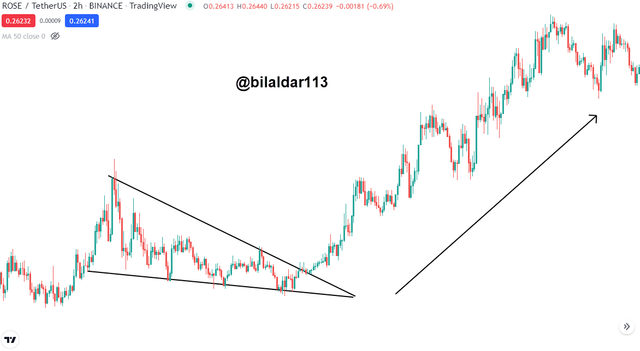
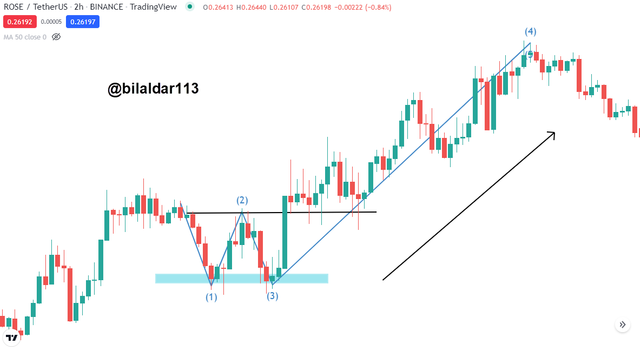
A falling wedge is a bullish pattern that is made up of a support and resistance trendline which connects at the ending point. The price continues to falls between those trendlines while the volume increases at the very end of the breakout showing that the bears are losing control of the market. So, there will be a time when the price will finally break out from the resistance line and start a strong bullish trend.
I have made a rising wedge pattern on ROSE/USDT which shows how strong the bullish trend was after breaking out from the falling wedge.
Rising Wedge
Rising Wedge
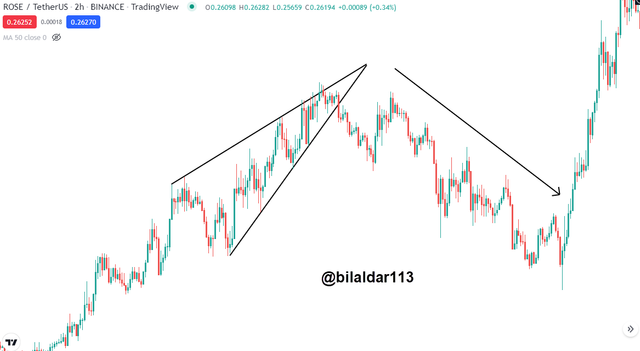
A rising wedge is formed in the bullish market and consists of 2 rising trendlines that connect with each other in the end. The lines work as a support and resistance to the price which keeps on rising between the wedge while the volume continues to decline indicating that bulls are losing control. Soon, the price will break down from the wedge and start a strong bearish trend.
I have attached a picture that shows what the rising wedge looks like in the crypto market.
2.) Main differences between the Double Top and the Double Bottom. Show screenshots.
2.) Main differences between the Double Top and the Double Bottom. Show screenshots.
There’s a very minor difference between double top and double bottom which I will explain in the following sections with detailed screenshots from the market.
Double Top
Double Top
The best way to remember what the double top looks like is to remember the letter M whose top works as a resistance to the price. There’s a resistance line as well which works as support but once it is broken, the price starts a bearish trend. The double top is the interpretation of the bearish trend means that we can sell the asset.
Double Bottom
Double Bottom
The double bottom is the same as the letter W whose bottom works as a support to the price due to which it bounces from the area twice. It tests the neckline 2 times which acts as a resistance and breaks it in the third time which starts a bullish trend. Thus, it is a bullish pattern.
3.) Explain and highlight the main differences between a bullish wedge and a bearish wedge. Show screenshots of each.
3.) Explain and highlight the main differences between a bullish wedge and a bearish wedge. Show screenshots of each.
Just like the double top and double bottom patterns, wedges are also widely famous for a great price prediction. I lot of people get confused in both but I will highlight the difference to make it clear for everyone:
Bullish Wedge
Bullish Wedge
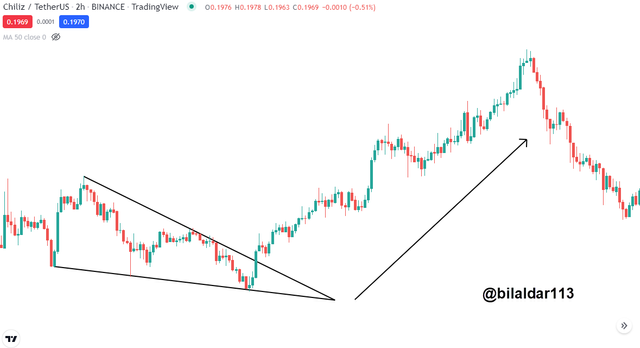
A bullish wedge consists of a support line and resistance line which also looks something like a symmetrical triangle. The price consolidates to the downtrend and the price breakout occurs from the resistance line which is the beginning of an uptrend. As the name suggests itself, it is a bullish pattern.
Bearish Wedge
Bearish Wedge
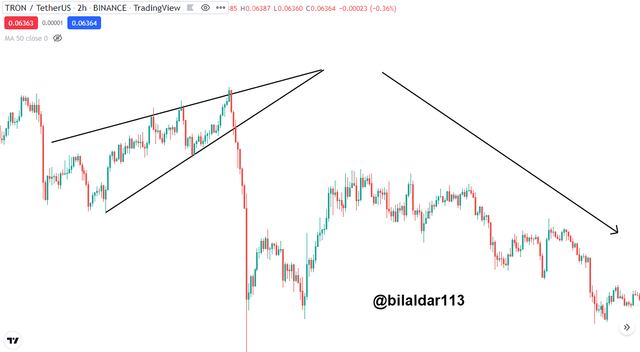
The bearish wedge is made up of a support and resistance line which intersect at the end of the pattern. It looks like a symmetrical triangle in which the price consolidates to the uptrend. The breakdown occurs from the support line due to which a strong bearish trend commences.
4.) Explain the volatility that usually exists with respect to the volume in the wedges. When is there usually more volume? What happens if a pullback breaks the support of a wedge?
4.) Explain the volatility that usually exists with respect to the volume in the wedges. When is there usually more volume? What happens if a pullback breaks the support of a wedge?
There are 2 types of wedges, falling wedge and rising wedge in which the volume of the assets plays a great role in the successful execution of the pattern. Let’s take an example of the bearish wedge which is formed when the market is in an uptrend. The price continues to rise in a slow manner between the trendlines but if we observe the volume, then it will be gradually decreasing which is the sign of bull’s weakness.
As for the bullish wedge pattern, the price moves very slowly to the downside between both support and resistance lines. However, once the price breaks the resistance, we can observe a great volume fuelled in the asset due to which the price skyrockets easily. So, the volume works inversely to the asset price but both increase when the asset breakout from the pattern.
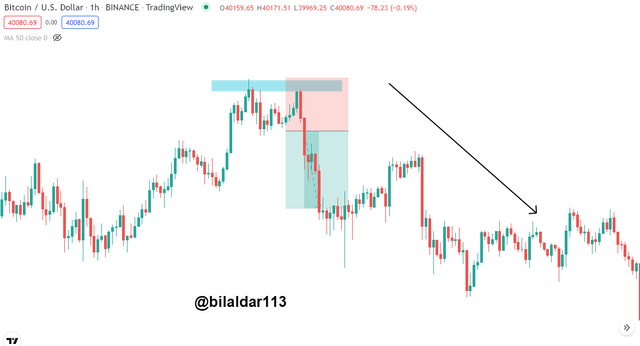
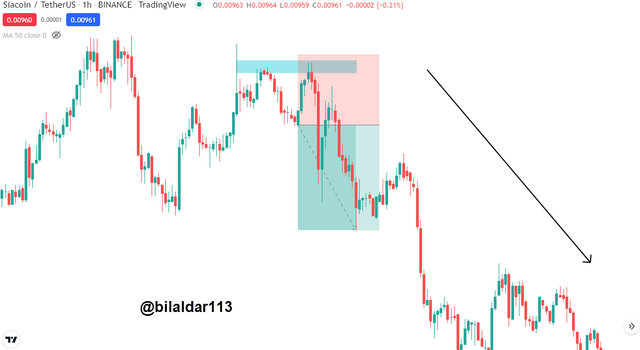
5.) Find and analyze the double top pattern on at least 2 charts. Show your own screenshots.
5.) Find and analyze the double top pattern on at least 2 charts. Show your own screenshots.
First Analysis
First Analysis
I have done the first analysis of double top on BTC/USDT which shows that the price touched the resistance line twice and failed to surpass it. However, the price broke the neckline which was my entry point. I opened the sell trade by placing the stop loss above the resistance as there’s less chance of price touching that area. You can see that the setup was successful as it touched the TP.
Second Analysis
Second Analysis
The second analysis is done on SC/USDT chart in which the double top was formed. You can see from the below-mentioned image that the price broke the neckline and started a bearish trend at a rapid pace. I placed the stop loss above the resistance with the RR according to 1:5. The setup was successful as it hit the TP.
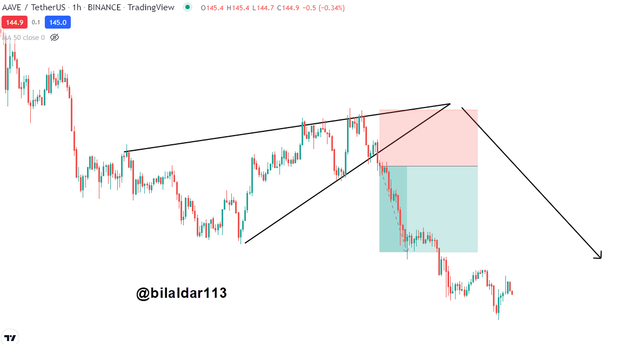
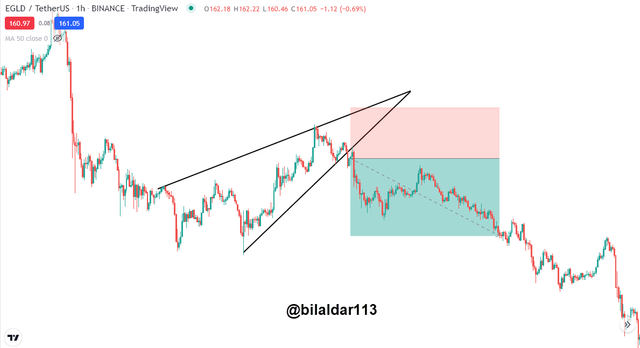
6.) Find and analyze at least 2 rising wedges and 2 falling wedges on at least 2 charts. Show your own screenshots.
6.) Find and analyze at least 2 rising wedges and 2 falling wedges on at least 2 charts. Show your own screenshots.
Now I will analyze the rising wedge and falling wedge on 2 charts to show how they look like and how they can be executed. So, let’s get started:
Rising Wedge Analysis
Rising Wedge Analysis
I have marked the rising wedge pattern on AAVE and EGLD with USDT pair chart patterns. You can see that the price was consolidating between both support and resistance lines until it broke the support and started a downtrend. It was the time to open a short trade. I placed the stop loss above the resistance line with the RR of 1:5. Both my trades hit the TP as expected.
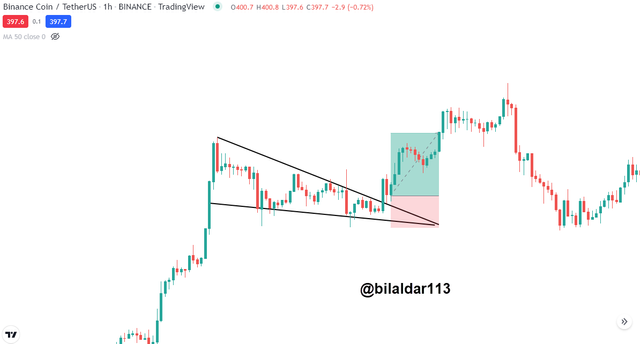
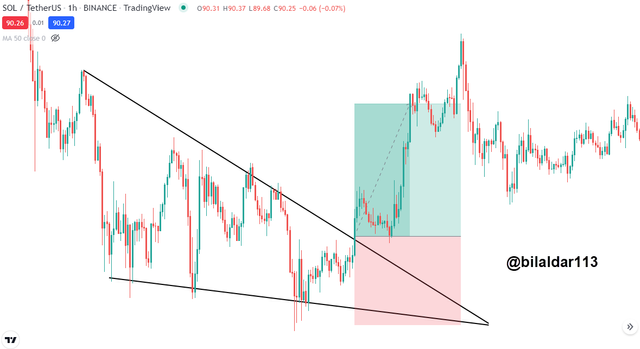
Falling Wedge Analysis
Falling Wedge Analysis
I have done falling wedge analysis on BNB and SOL. You can see from the below-mentioned analysis that the price was moving between the marked pattern but not for long as it broke the resistance line with great volume and started an uptrend. I opened a long position by placing a stop loss below the support while the take profit was according to 1:5. The setup was valid as the TP was hit as shown in the screenshots.
7.) Importance of patterns in technical trading.
7.) Importance of patterns in technical trading.
There are a lot of ways to trade in the financial market like price action, fundamental analysis, technical analysis, and others to make a great profit. I prefer to opt for price action, technical analysis along with chart patterns. The reason is that patterns like wedges, double bottom, double top, head & shoulder, triangles, flags, and harmonics give a clear insight into the future price of an asset that can be easily traded by beginner traders.
It doesn’t require a lot of effort as the chart patterns are easy to identify in the market. However, if it is combined with technical indicators like MA, MACD, RSI, Ichimoku Cloud, and others, then much more accurate setups can be found that has fewer chance to hit the stop loss. So, I believe that every trader should be familiar with the patterns for a seamless trading experience.
8.) Do you find it effective to use these patterns in trading? Justify your answer.
8.) Do you find it effective to use these patterns in trading? Justify your answer.
I remember starting my trading career and I didn’t know where to start from until one of the professional traders advised me to learn the patterns first. They are very easy to learn and are the accurate majority of the time. Plus, it is widely recommended by experienced traders for amazing profit and fewer risks. So, I think that it is effective to use these patterns while trading but we should add more confluence by using other technical analysis tools.
9.) Conclusion
9.) Conclusion
The conclusion of my homework is that a trader should learn about chart patterns as it can be very easy to identify and trade in the financial market. Patterns like wedges, double bottom, and double top give both bearish and bullish signals. Plus, they provide a great profit margin. So, every trader should be familiar with the top patterns to ace the trading experience.

Thanks For Visiting My Post
Cc: @imagen
Gracias por participar en la Sexta Temporada de la Steemit Crypto Academy.
Espero seguir corrigiendo tus futuras asignaciones, un saludo.