[ Crypto Trading with Price Action ] - Steemit Crypto Academy |S6W2 | Homework Post for @reminiscence01

Designed by @bilaldar113 Using Post Maker

Greeting Steemians,
Greeting Steemians,
I wish everyone a great season and would like to welcome you to my homework post for the lecture provided by @reminiscence01. Price action is one of the most important trading tools that everyone should master as it can be very profitable if done in the right manner. I have answered every question with sheer dedication and hope that everyone likes it.

Explain your understanding of price action.
Explain your understanding of price action.
There are a few numbers of techniques to trade in the financial market. Some of the renowned methods include fundamental analysis, technical analysis, price action, and others. Each technique has its own benefits and drawbacks but the most recommended one among professional traders is price action.
The reason is that a trader studies the previous price behavior of the market makers who actually control the price of assets. Thus, it helps to understand the movement and predict the price according to the past data. We make use of several things in the price action which includes technical indicators, news, volume, chart patterns, risk management, and together an amazing trade setup can be found that can provide great profit.
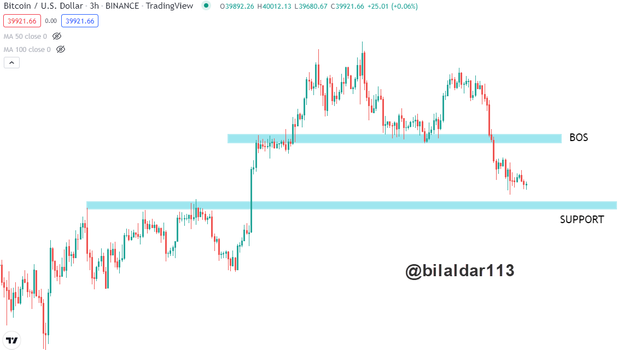
You can see from the below-mentioned image which I have made use of price action skills. The BTC was in an uptrend but end up breaking the previous higher-low which is a sign of trend reversal. So, I can short the asset and wait for it to hit the demand zone which will be my TP area. That’s how we can make use of price action and make a profit in the same footprint made by the smart money in the market.
What is the importance of price action? Will, you chose any other form of technical analysis apart from price action? Give reasons for your answer.
What is the importance of price action? Will, you chose any other form of technical analysis apart from price action? Give reasons for your answer.
If we compare price action with another form of trading technique, then it is a much better and more profitable option. Plus, there are several other reasons due to which I will prefer it for trading. I will explain some of them deliberately in the following sections:
Helps to Find the Trend
Helps to Find the Trend
One of the best benefits of trading with the price action is that it gives a clear picture of the trend. The technical indicators lag and fundamentals are manipulating, so both can’t be trusted. While price action is the most accurate way as we can find the strong demand and supply zone, current trend, the break of structure, and trend reversal points based on available data.
Represent Market Makers Psychology
Represent Market Makers Psychology
Market makers are the actual players who control the price while small traders like us become the victim. So, price action gives the benefit of understanding their psychology through which we can come up with great setups.
Less Fake Signals
Less Fake Signals
Indicators are known for making false signals due to which a person ends up harming capital to a great extent. That’s not the case with price action as we will observe the behavior of the price and how the market makers play with it. In that way, we will get perfect entry and exit points with a great risk-reward ratio which can be adjusted according to the strong demand and supply zones.
Explain the Japanese candlestick chart and its importance in technical analysis. Would you prefer any other technical chart apart from the candlestick chart?
Explain the Japanese candlestick chart and its importance in technical analysis. Would you prefer any other technical chart apart from the candlestick chart?
In order to trade with the price action, a person should learn to read the data that is presented on the chart. There are several ways through which data is presented like line, bars, Kagi, range, heikin ashi, and others. However, the best way which suits the majority of traders is the Japanese candlesticks.
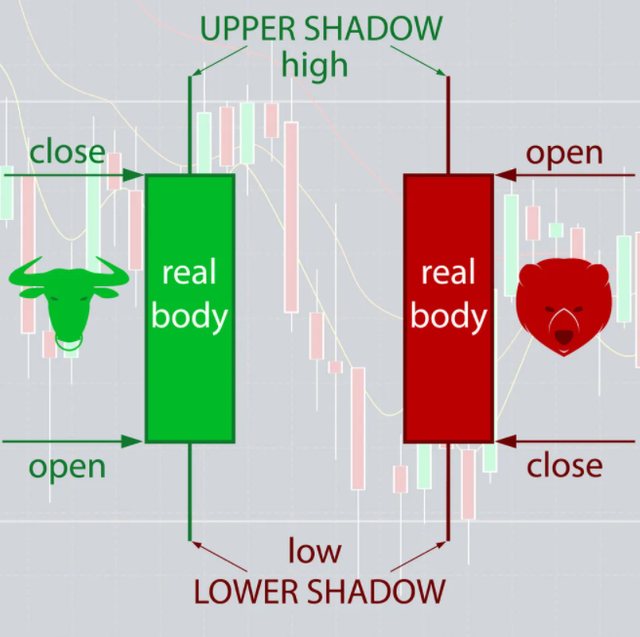
This pattern consists of a body and wicks which represent the opening and closing price and the max low and high that it has touched in a certain period of time. It was invented by Munehisa Homma in the 18th century and since that it has been widely used by traders as it represents complete data in a single candle which helps a lot in price action analysis.
There are 2 types of candles by nature. The red one represents a bullish price and the green one is bearish. You can also refer to the below-mentioned image which shows what they look like. So, with a single glance, a trader can get to know who is currently in control of the market which helps a lot with price action analysis.
I personally prefer Japanese candlesticks as they represent complete price data which sets the bias of a trader. It can help to know about the trend reversal and strength of the bulls and bears.
What do you understand by multi-timeframe analysis? State the importance of multi-timeframe analysis.
What do you understand by multi-timeframe analysis? State the importance of multi-timeframe analysis.
Multi-Timeframe Analysis
Multi-Timeframe Analysis
It is said that every time frame depicts its own story and it’s a fact. This is the very own reason due to which traders make analysis on multiple timeframes like 1-day, 4-hours, 1-hours, etc. It helps to know about the perfect trend of the market and entry point accordingly. The reason for analysing charts on different time frames is that the trend can be different on smaller time frames while the higher time frame will be entirely different.
Importance of Multi-Timeframe Analysis
Importance of Multi-Timeframe Analysis
The multi-timeframe analysis is important for the trader to practice while finding an entry point. The reason is that a higher timeframe shows the best entry point while stop loss can be found at smaller timeframes. Plus, if we start from higher timeframes like days or weeks, there will be less noise making it easier for the trader to analyse. It also works as a confirmation because we can move from a higher to a small timeframe to confirm if the analysis is fine or not.
With the aid of a crypto chart, explain how we can get a better entry position and tight stop loss using multi-timeframe analysis. You can use any timeframe of your choice.
With the aid of a crypto chart, explain how we can get a better entry position and tight stop loss using multi-timeframe analysis. You can use any timeframe of your choice.
I have already explained the importance of multi-timeframe analysis in the previous question and it's time that I demonstrate it on a chart so that you can find out how it can assist you with the trading and help you to take the decision of entry point.
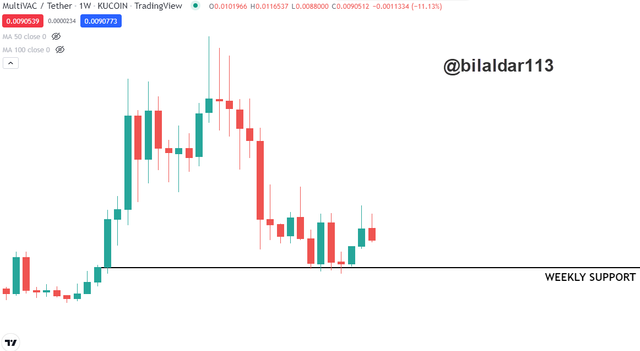
The first thing that I did was to open the weekly chart of MTV/USDT to find the potential support and resistance. I found a weekly supply zone that the price has been respecting and bounced from several times.
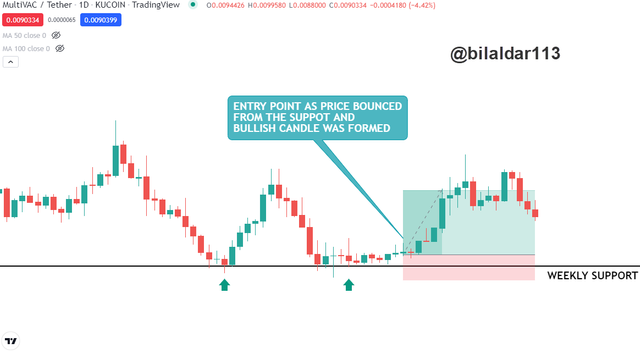
Now I will take a look at the daily chart to find my entry point and verify if the support is valid.
The daily time frame shows that support was valid as the price was respecting it. Thus, I opened a long position with the RR of 1:5 and you can see that the price successfully hit the TP.
Carry out a multi-timeframe analysis on any crypto pair identifying support and resistance levels. Execute a buy or sell order using any demo account. (Explain your entry and exit strategies. Also, show proof of transaction).
Carry out a multi-timeframe analysis on any crypto pair identifying support and resistance levels. Execute a buy or sell order using any demo account. (Explain your entry and exit strategies. Also, show proof of transaction).
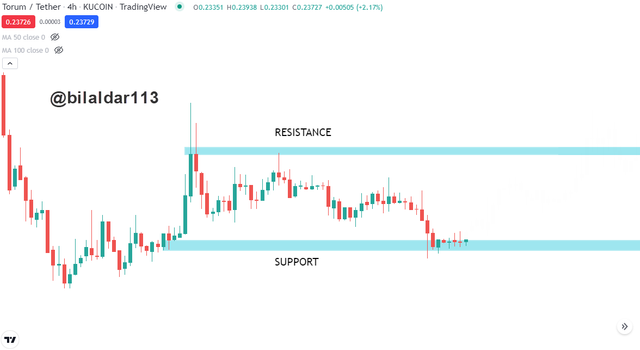
Now I will open a demo trade using simple price action and multi-timeframe analysis on the XTM/USDT.
I opened the 4-hour chart and made the support and resistance to find the perfect entry point. You can see that the price was currently trading at the support zone which was the best time to open a long position.
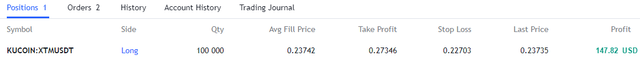
But I have to confirm my entry on smaller timeframes as well to avoid unnecessary loss. So, I opened the 1-hour chart and found that the price was successfully bouncing from the marked support. Therefore, I opened a long position with the RR of 2:5 and placed the stop-loss slightly below the support.
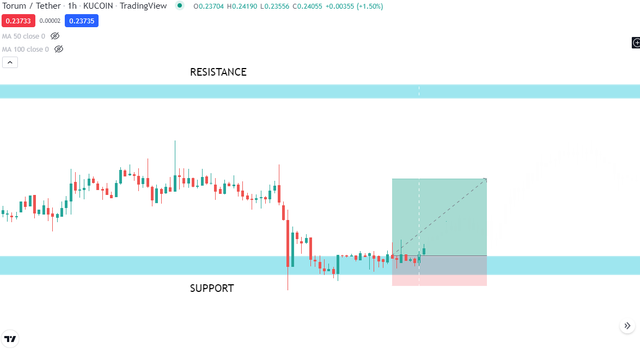
The TP was hit and the trade went successful. That’s the benefit of using multi-timeframe analysis as it shows the setup was perfect and the price had the potential to bounce from the expected area.
Conclusion
Conclusion
After completing my homework, I have come to the point that price action is the best technique to improve your win rate in the crypto market. Plus, if it is combined with the multi-timeframe analysis, then it will be much better as one can easily find the best entry point and exit point accordingly.

Thanks For Visiting My Post
Cc: @reminiscence01
Hello @bilaldar113 , I’m glad you participated in the 2nd week Season 6 at the Steemit Crypto Academy. Your grades in this task are as follows:
Recommendation / Feedback:
Thank you for participating in this homework task.
Professor @reminiscence01 Please check my homework.❤️
Excersice patience. It will be checked.
Thanks. I think you forget. Because you checked my uper and lower posts😁😁😁