[ Crypto Trading with Moving Average ]-Steemit Crypto Academy |S6W2 | Homework Post for @shemul21

Designed by @bilaldar113 Using Post Maker

Hey Everyone!
Welcome to my homework post for the second week of the Steemit Crypto Academy. Professor @shemul21 has provided a valuable course on moving average (MA) which is one of the most famous indicators to find the trend of the market and get insight into other things as well. We will talk more about this renowned indicator in my homework. So, let’s start with that:

Explain Your Understanding of Moving Average.
Explain Your Understanding of Moving Average.
The moving average is one of the most famous technical indicators that are used by the majority of traders to find out the trend of the market along with the support and resistance. It represents data through a single line making it very easy for the traders to predict the future price action and that is the key reason due to which it has become the most common tool for trading.
The moving average is just a simple line that is plotted on the chart by taking the average of the previous candles. Since the result is based on the past data of the asset, it helps the trader to get an insight into the price behavior and open trades accordingly. So, it is one of the simplest indicators that can provide amazing help in deciding when to open trades and close them.
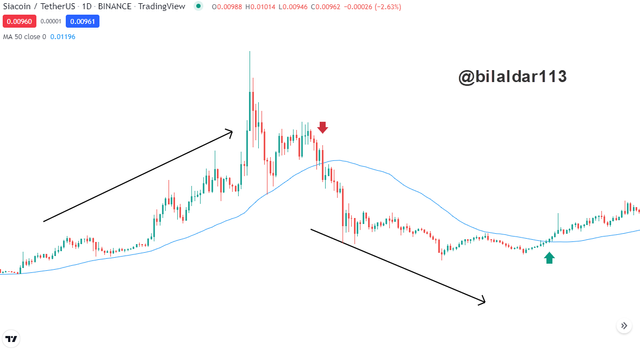
I have mentioned an example of a 50-day moving average which shows that when the price was above the line, it was in an uptrend indicating that the bulls were in power. Later, it was flipped which was the sign of a bearish trend.
What Are The Different Types of Moving Average? Differentiate Between Them.
What Are The Different Types of Moving Average? Differentiate Between Them.
When you start trading with the moving average, you will find out there are 3 types of MA and each has different functions and plot the result in an entirely different way. I will differentiate each of them so that you can get a clear picture of them:
Simple Moving Average (SMA)
Simple Moving Average (SMA)
This type of moving average plots the result by simply taking the average of the assets for a specific period of time. Suppose that you want SMA for the 50 periods, then it will take an average of the previous 50 candles and plot the result accordingly. SMA is a good option to find out the long-term trend as it works better on high length.
SMA = A1 + A2 + A3 + A4+ A5 / N
Where,
An = the price of the period at the n day
N = number of periods
Where,
An = the price of the period at the n day
N = number of periods
Exponential Moving Average (EMA)
Exponential Moving Average (EMA)
EMA is just like SMA but the only difference is that it considers the latest price due to which much latest result is plotted on the chart in the form of a smoothing line. Contrary to SMA, it is good to find the short-term trend and works better with small lengths.
EMA = {Value Today (Smoothing / 1+ days)} + EMA yesterday {1-(Smoothing/1+days)}
Weighted Moving Average (WMA)
Weighted Moving Average (WMA)
This is the last one of moving averages. As the name suggests it puts more weight on the present data rather than the previous data due to which better result is provided for entry and exit points.
WMA = Price1 x n + Price2 x (n-1) / n x (n-1) / 2
Identify Entry and Exit Points Using Moving Average. (Demonstrate with Screenshots)
Identify Entry and Exit Points Using Moving Average. (Demonstrate with Screenshots)
Moving average is a great indicator to find out the current trend of the market through the high length. It can also show the best entry and exit point which can be done with the help of a small length moving average.
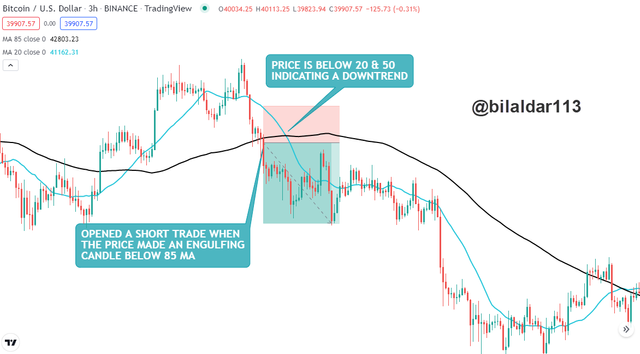
So, I will use 2 MA of 85 and 20 periods. The MA line of 85 will represent the trend of the market while the MA of 20 periods will act as a support and resistance to the price.
When the price is above 85 MA, then the asset will be considered bullish and a buying opportunity. The same goes for the bearish case but the price should be below the 85 MA.
You can see from the below-mentioned chart that 20 and 50 MA made a crossover while the price was below both MA lines. Thus, that was the sign of a downtrend due to which I opened a short position.
That was my entry point but as for the exit signal, a trader can use the preferred risk-reward ratio or wait for the price to flip the 20 MA which will be the sign of trend reversal. I have demonstrated the example with RR of 2:5 but waiting for the price to flip MA can give a good profit.
What do you understand by Crossover? Explain in Your Own Words.
What do you understand by Crossover? Explain in Your Own Words.
MA crossover is a trading strategy in which we use 2 MA lines, one of small length and the second of high length. By interpreting the past data of the asset, the line gives a clear insight about the future price action and helps to open and close trade accordingly. For example, if we use 50 MA and 100 MA, then the short length MA will be moving faster working as potential support and resistance. On the other hand, the faster-moving average which is 100 MA will be a bit away from the candles representing the current trend.
However, the combination of 50 and 100 MA is good for the daily timeframe. As for the monthly, hourly, and scalping trades, there are a few more combinations of MA that can provide better trading signals. So, one must choose the combination accordingly as what works best on the daily timeframe is not going to be applicable on the 4-hour chart.
Once you apply the MA on the chart, you have to wait for the crossover which means that both MA lines will interact with each other. That will be your point to buy or sell the asset.
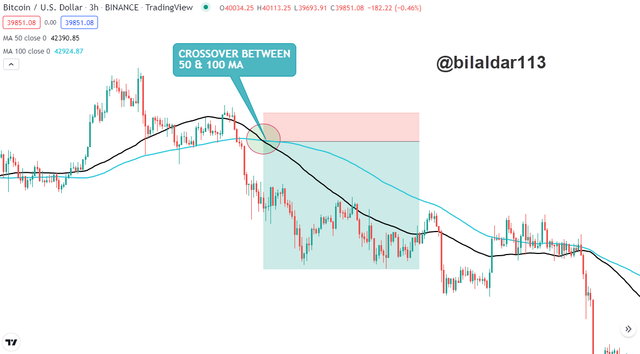
The below-mentioned chart shows that the MA made a crossover and the price was below the line. So, I can sell the asset and set the preferred RR. Not to forget that it gives quite a good profit but the thing is that it will provide fewer signals but they will be much more accurate.
Explain The Limitations of Moving Average.
Explain The Limitations of Moving Average.
Moving average is a helpful indicator that can represent a great result that can assist the trader to find the support, resistance, current trend, and trend reversal. However, there are some limitations due to which invalid signals are often represented. Here are some of the drawbacks of moving averages:
- It considers past data due to which it lags and the trader doesn’t get to catch the trend at its earliest.
- Not adjusting the moving average according to the strategy can result in harming the capital.
- Moving averages don’t consider any factor other than price due to which an accurate signal can’t be provided.
- It doesn’t work when the market is in the consolidation phase.
Conclusion.
Conclusion.
The conclusion is that Moving Averages is the best indicator for the traders who want to trade with the trend. It can be of unmatched assistance to know about the ongoing trend, support, resistance, and other important factors. But a person should be very well familiar with the drawbacks of the MA as well to trade cautiously.

Thanks For Visiting My Post
Cc: @shemul21
Sort: Trending
Loading...