Crypto Academy Season 5 Week 7- Trading Strategy with "Price Action and the Engulfing Candle Pattern" - Homework Post for @lenonmc21

Designed by @bilaldar113 Using Post Maker

Hey Everyone!
This is my homework post for the esteemed professor @lenonmc21 who has been teaching us the trading strategies that are known widely for their profit rates. The best thing about the professor is that he has also provided us with those techniques that are sold at expensive prices in the market. He has made a lecture on “Price Action and the Engulfing Candle Pattern” which I will talk about in my homework, so let’s get started.

THEORY QUESTIONS
Say in your own words that you understand the Trading Strategy with “Price Action and the Engulfing Candle Pattern, also describe each step to be able to execute it (Place at least 2 examples in clear cryptographic assets and with your own charts mandatory)?
Say in your own words that you understand the Trading Strategy with “Price Action and the Engulfing Candle Pattern, also describe each step to be able to execute it (Place at least 2 examples in clear cryptographic assets and with your own charts mandatory)?
Price Action and the Engulfing Candle Pattern is a renowned trading strategy. As the name implies itself, it is done through simple price action and a candlestick pattern called engulfing candle. It is widely said in the financial market that “Trend is Your Friend” and that’s how this strategy works as we will be trading with the trend.
The professor explained that we have to look for a harmonic market structure. It means that commodity must be making a series of high or low of equal length which will represent that it is in strong momentum. But we have to wait for the trend reversal and it will be identified in the 15-minute timeframe as 3 or 5 opposite and long candles will be formed representing that trend is about to reverse. After making these candles, the price will retrace to the prior trend and form an engulfing candle which is the foremost criteria. It is of great importance as it shows the power of bulls and bears. Considering the engulfing candle, we open and close the trade.
It will be sort of difficult to understand the strategy in words so let me give you an example from the crypto market in simple steps.
Step-by-Step Approach of Price Action and the Engulfing Candle Pattern
Step-by-Step Approach of Price Action and the Engulfing Candle Pattern
First Trade Setup
First Trade Setup
I’m providing an example through a step-by-step approach on COSMOS/USDT chart. You have to go through each step to understand how this strategy works.
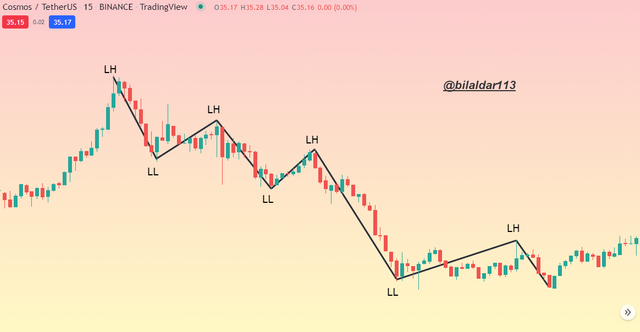
1. The foremost criteria as explained by the professor is to find a harmonic trend. The commodity was making a perfect series of LL and LH that I have labeled on the chart for you. Once it is done, we move to the next step.
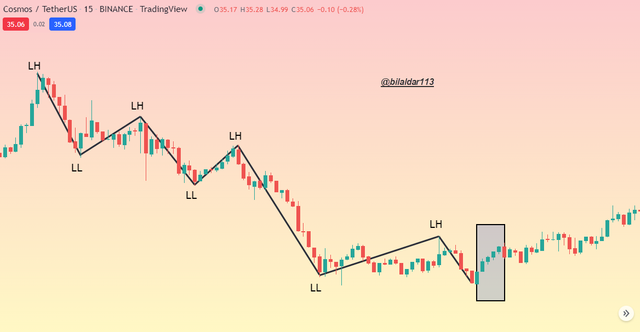
2. The next step includes finding a few continuous candles in the opposite direction of the ongoing trend which will work as a break to the commodity. In my case, the price was in a downtrend so I have highlighted the bullish candles that are full of volume and represent the change in trend.
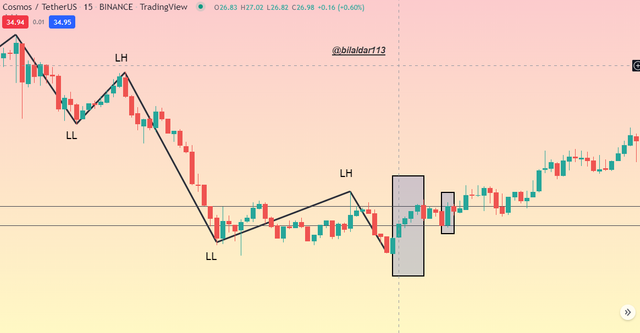
3. After completing the second step, you have to wait for the price to make an engulfing candle and mark 2 horizontal lines. In my chart, the price made a bullish engulfing candle and I have made 2 lines on both sides. After doing so, you can open a 5-minute chart.
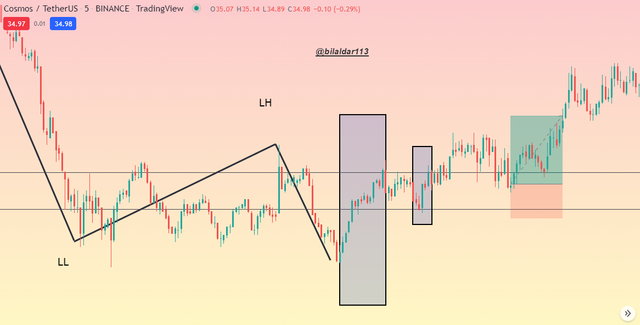
4. In the fourth step, you have to wait for the price to make a pullback in the prior direction. After that, it will make candles in the direction of the new trend and that’s where I will open my position by placing stop loss and taking profit around support and resistance. The risk-reward ratio should be considered as well.
That’s how simple it is to trade using this strategy. It’s time that I show you another example for better clarification.
Second Trade Setup
Second Trade Setup
Here’s the second trade setup made on DOT/USDT chart.
1. The price has made a harmonic uptrend as shown in the chart pattern of DOT/USDT.
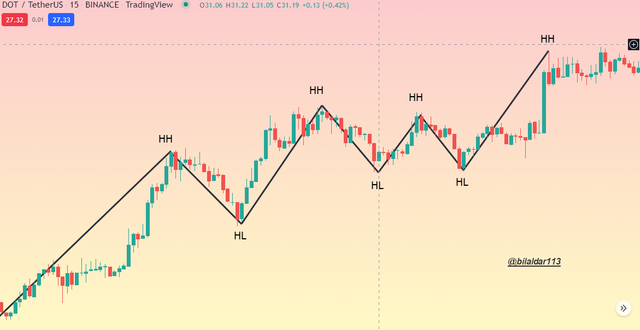
2. The price formed a series of bearish candles against the ongoing trend representing the change in the current trend.
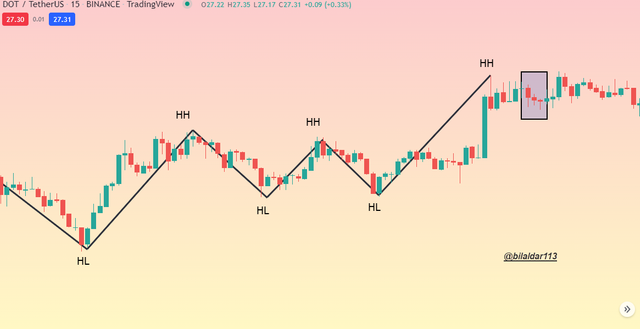
3. The price took a breakthrough a pullback and formed a bearish engulfing candle which I have marked with 2 horizontal lines to find my entry point.
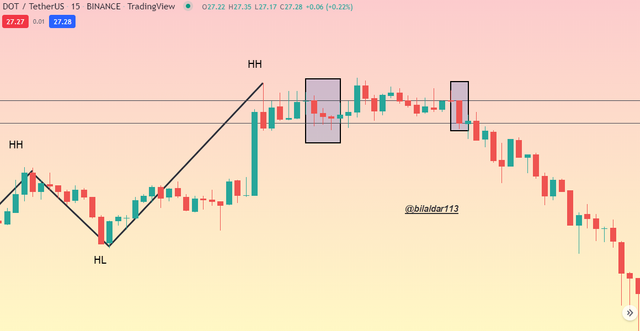
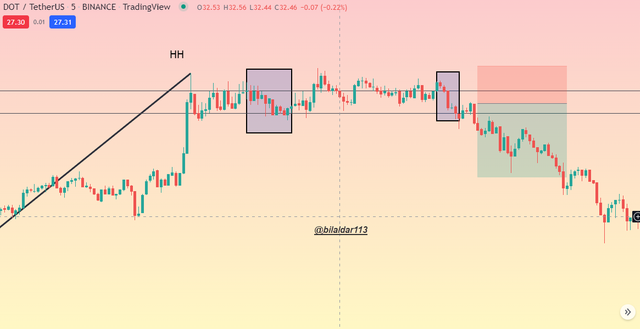
4. The market structure was broken on the 5-minute chart so I opened my position by placing stop-loss above and below the resistance and support.
Explain in your own words the interpretation that should be given to a large strong movement in the market. What does the price tell us when it happens?
Explain in your own words the interpretation that should be given to a large strong movement in the market. What does the price tell us when it happens?
Have you ever noticed that the commodity moves in a harmonic trend and suddenly the structure breaks and strong opposite trends start, that’s called “Large Strong Movement”. Small traders don’t have enough potential to do this but the lead behind all this game are whales. They actually control the market as they have the highest portion of the asset as compared to retail traders and that’s how they are able to change the trend according to their will.
When the price is simply moving in a specific direction and out of blue a few negative candles are formed, which means that the whales are putting money in the opposite direction for the liquidity grab so that they can make more and more money. As a trader, we have to play smartly by trading with the trend so that we can minimize the loss. We should be wise enough to understand the strong movement in the market made by the whales so that we can open positions accordingly. The same concept is leveraged in Price Action and Engulfing Candlestick Pattern strategy due to which it has a huge success rate.
Explain the trade entry and exit criteria for the buy and sell positions of the trading strategy with Price Action and Engulfing Candlestick Pattern in any cryptocurrency of your choice (Share your own screenshots taking into account a good ratio of risk and benefit)?
Explain the trade entry and exit criteria for the buy and sell positions of the trading strategy with Price Action and Engulfing Candlestick Pattern in any cryptocurrency of your choice (Share your own screenshots taking into account a good ratio of risk and benefit)?
Entry Criteria
Entry Criteria
- The most essential part of this strategy is to find a chart with harmonic trends. The trend should be crystal clear and should be such that a trader can identify at a single sight. The retracement should not exceed the previous high or low and must be of the same length to make the first criteria valid. If you can’t find a chart with a harmonic trend, then it is better to wait or look for another commodity.
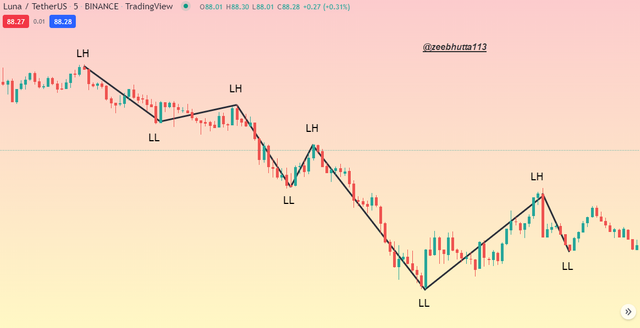
Image Source
- We also have to observe the price movement of the commodity after finding a harmonic trend. The only way to predict the change in trend is to find a candle in the opposite direction of the ongoing trend which will show that the power has been shifted from bulls to bears and vice versa. After finding strong candles with volumes, you can consider the second criteria fulfilled.
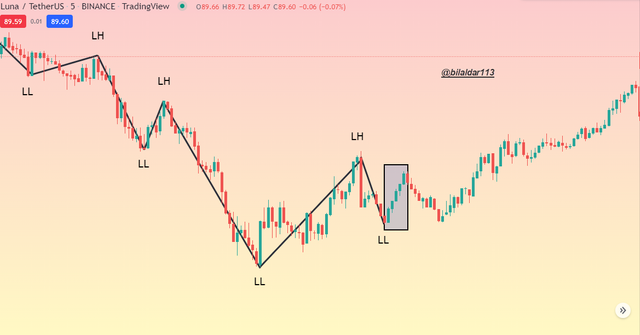
Image Source
- The next thing is to find the engulfing candle which will be formed after a small pullback in the commodity. The candle should be marked from both sides and when done, we have to open a small timeframe chart where the zone will be already broken. Once the price retraces to the zone again, we can enter the trade.
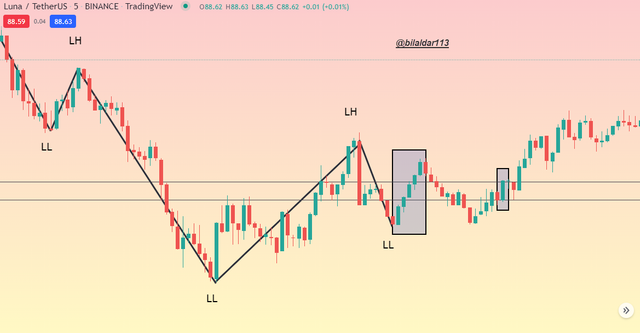
Image Source
- Once you observe the small chart and enter the trade as the price retraces, you have to decide about the exit point of the setup. You can place stop loss and take profit which is the most important tool for risk management. They can put at the support and resistance as I have demonstrated in the following example.
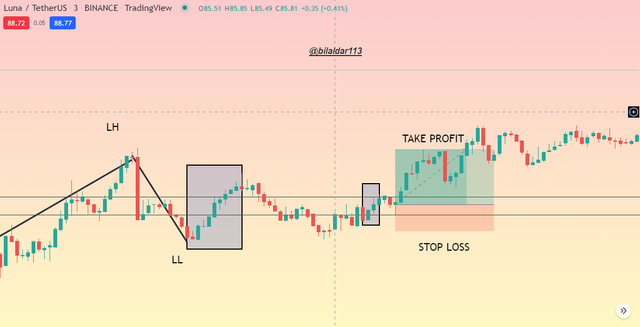
Image Source
PRACTICAL QUESTIONS
Make 2 entries (One bullish and one bearish), using the “Price Action and Engulfing Candlestick Pattern” trading strategy. These entries must be made in a demo account, keep in mind that it is not enough to just place the images of the execution, you must place additional images to observe the development of these operations to be able to be correctly evaluated and see if they really understood the strategy.
Make 2 entries (One bullish and one bearish), using the “Price Action and Engulfing Candlestick Pattern” trading strategy. These entries must be made in a demo account, keep in mind that it is not enough to just place the images of the execution, you must place additional images to observe the development of these operations to be able to be correctly evaluated and see if they really understood the strategy.
We have learned about the entry and exit criteria of the market and learned how this strategy works. Now we will be testing the strategy in the crypto market via 2 demo trades on bullish and bearish charts.
Buy Entry
Buy Entry
I’m attempting a buy entry on SUSHI/USDT chart which shows that the price is in a downtrend and a strong large movement was made against the ongoing trend. Bullish candles were formed with volume representing a sudden change in trend. I have highlighted those candles as you can see in the following chart.
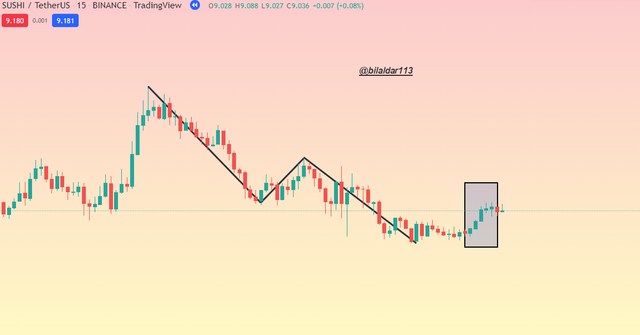
After waiting for a few more minutes, commodity made a pullback to the previous trend and made a bullish engulfing candle which I marked and then opened a smaller time frame chart to find if the structure is broken and I can open the trade or not.
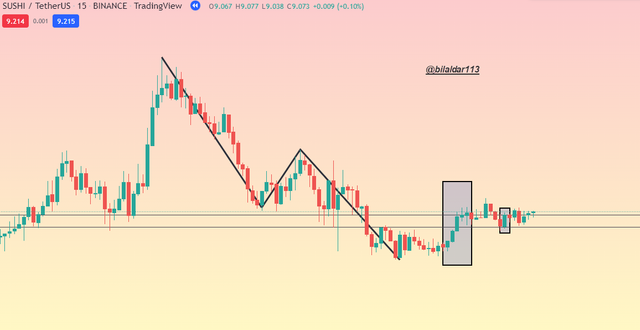
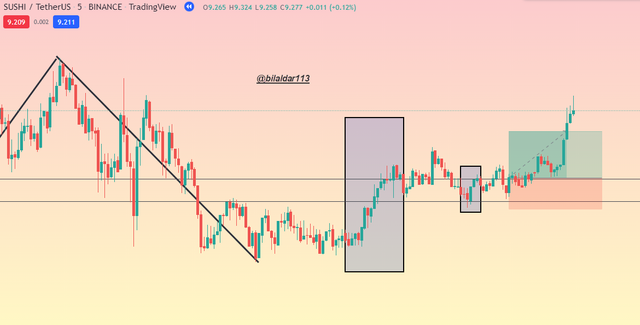
The structure was already broken in the 5-minute chart so I was all set to buy the asset and did so when the commodity retraced to the zone. I placed stop loss below the support and take profit was according to the risk-reward ratio of 1:5.
Sell Trade
Sell Trade
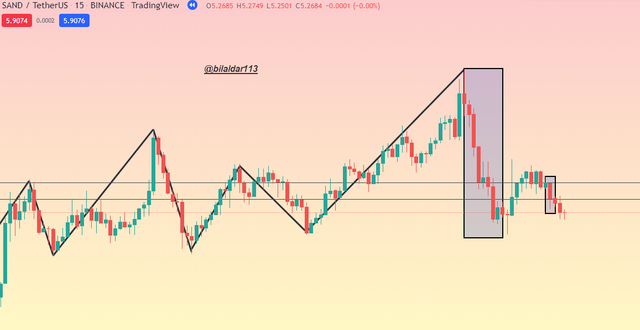
I’m attempting a sell trade on SAND/USDT as I was able to find a strong uptrend move on the 15-mint chart. I made high and low lines for your understanding which shows a harmonic trend. The price also formed numerous strong bearish candles representing the start of a bearish trend which has been highlighted.
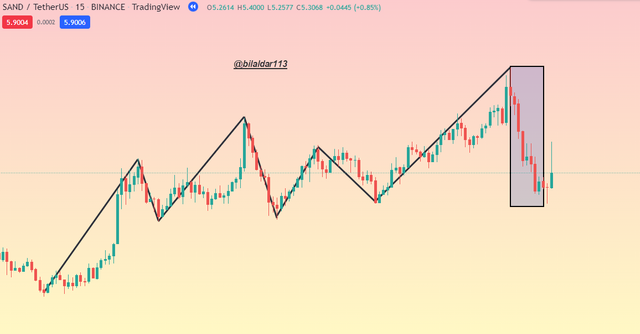
I waited for the price to take a break by making a bullish pullback on the chart which was done as predicted. The bearish engulfing candle was also formed that I marked with 2 horizontal lines.
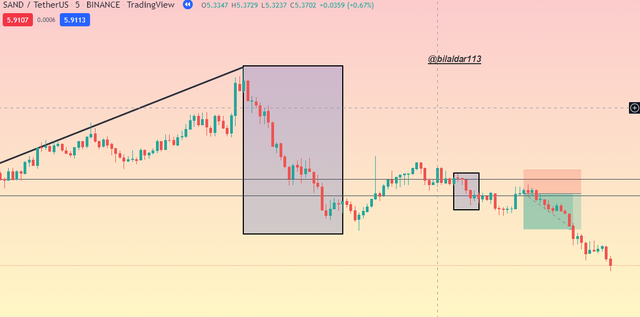
I opened a 5-minute chart of SAND/USDT to check if the zone is broken which was already done so I sold the asset on the retracement. The stop loss was placed slightly above the entry candle and take profit was according to the risk-reward of 1:5 which was hit and I was in profit.
Conclusion
Conclusion
To sum up, everything that I have done in this homework, I would like to simply state that it is one of the best strategies that I have come across in the academy. It is effortless as entry criteria are to only find a harmonic trend, strong candles with volumes, and engulfing candles to open positions. The risk-reward ratio that it provides is huge which can help us to make amazing profits in real-time trading.
A lot of gratitude and respect for the professor for his amazing trading strategy.

Thanks For Visiting My Post
Cc: @lenonmc21
Sir Please also check this post. It has not yet received the vote.
https://steemit.com/hive-108451/@bilaldar113/repost-crypto-academy-season-5-week-5-trading-strategy-with-the-vwap-indicator-homework-post-for-lenonmc21