Crypto Academy Season 5 Week 5- Trading Using Wedge Pattern - Homework Post for @sachin08

Designed by @bilaldar113 Using Post Maker

Hey Everyone!
First thing first, I would like to show my gratitude to professor @sachin08 as he has explained chart patterns such as triangles, flags, and much more to this community. Now he has explained the wedge pattern and I will be attempting related questions in this homework post.

1. Explain Wedge Pattern in your own word.
1. Explain Wedge Pattern in your own word.
Wedge is one of the most common chart patterns through which you can predict the price of any asset. It is made up of 2 lines which is the potential support and resistance that price has to respect them in order to make the pattern valid. The consolidation of the price between trendlines shows that it will take the opposite direction. In terms of results, we can say that there are 2 types of patterns; rising wedge and falling wedge.
The rising wedge is formed on the top of the market and prices become bearish after breaking the trendline. Contrary to that, the falling wedge can result in a bullish trend after the trendline is broken.
2. Explain both types of Wedges and How to identify them in detail. (Screenshots required)
2. Explain both types of Wedges and How to identify them in detail. (Screenshots required)
As explained by the professor, there are 2 types of wedges but there are some differences in identifying them. I will show you how it is done so it can become easy for you to find them in the crypto charts and trade accordingly.
Falling Wedge
Falling Wedge
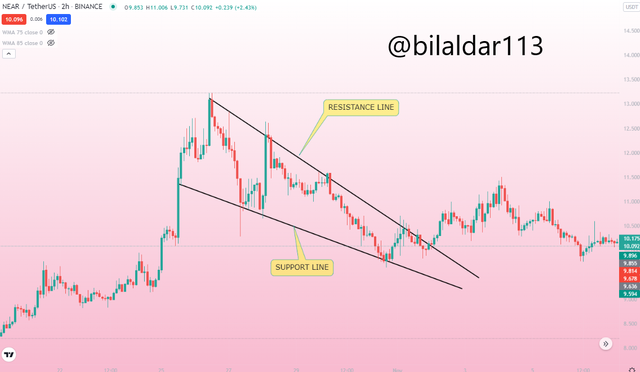
A falling wedge is the sign of a bullish trend and it can be found at the bottom of the market. It is made of 2 trendlines which meet together in one end. The price consolidates between them and in the end, breaks the resistance trendline and starts a bullish trend. The price should at least touch one trendline 3 times and other trendlines 2 times which means that it has to tap both trendlines around 5 times. Below, I have shown an example of the falling wedge.
Rising Wedge
Rising Wedge
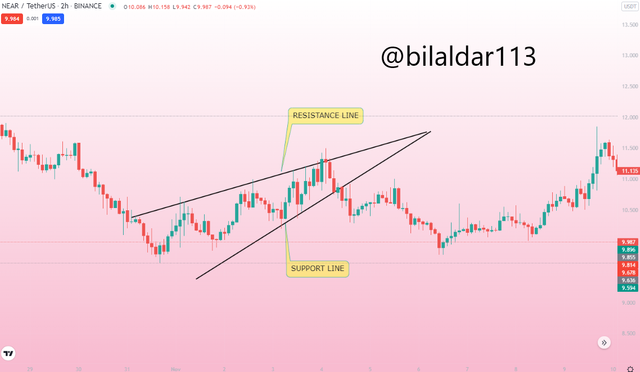
A rising wedge is a bearish pattern that is found on the top of the market. It is also formed by 2 rising trendlines that are support and resistance. The price will be consolidating between those lines and tap both of them around 5 times. You can open a short position when it breaks the support trendline and start a bearish trend. It is a must to verify the price taps to make sure that it is valid. I have marked the pattern on NEAR/USDT which is valid as it meets the criteria of trendlines and price taps.
3. Do the breakout of these Wedge Patterns produce False Signals sometimes? If yes, then Explain how to filter out these false signals.
3. Do the breakout of these Wedge Patterns produce False Signals sometimes? If yes, then Explain how to filter out these false signals.
It would be a novice to state that patterns are always correct because they can provide fake signals several times due to which anyone can open a position and regret their decision. The best way to avoid such scenarios is to use multiple indicators and open trade based on their signal because a wedge pattern alone is not enough.
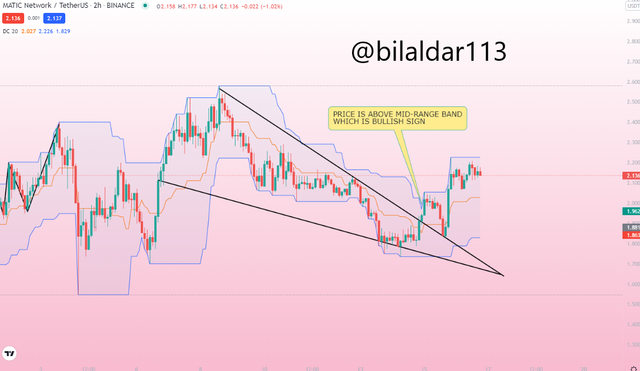
I used the donchian channel to find the true trend of the market along with the chart pattern so that I can find out potential signals. Observe from the MATIC/USDT chart that a descending wedge was formed and price broke the top line but how can I find out that the long signal is valid? I simply used the donchian channel which shows that the price was between the top band and mid-range band which is a bullish sign. Therefore, I can long the asset without any worry.
4. Show full trade setup using this pattern for both types of Wedges. ( Entry Point, Take Profit, Stop Loss, Breakout)
4. Show full trade setup using this pattern for both types of Wedges. ( Entry Point, Take Profit, Stop Loss, Breakout)
Now that we have discussed everything about the wedge pattern, it's time to make a trade setup for both falling rising and falling wedge. I will show everything like an entry point, exit point, stop loss which will show you how it is done in a professional way.
Rising Wedge Pattern
Rising Wedge Pattern
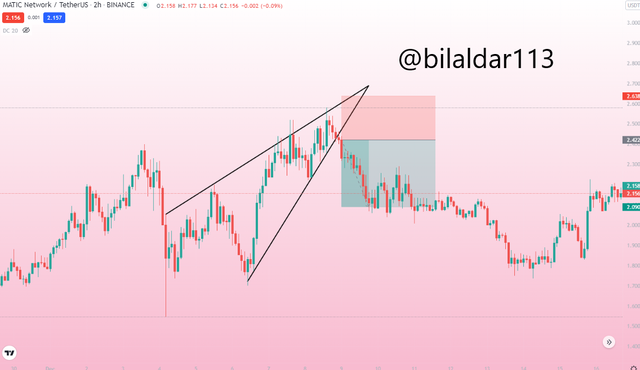
I have made a rising wedge pattern on MATIC/USDT chart and the price was respecting both lines and consolidating between them. As we know that it’s a bearish pattern so when the price broke the lower line, I shorted the asset with a risk to reward ratio of 1:5. We have to always put the stop loss above the resistance line as the price can bounce after touching it. However, I was in profit because the price reached the TP.
Falling Wedge Pattern
Falling Wedge Pattern
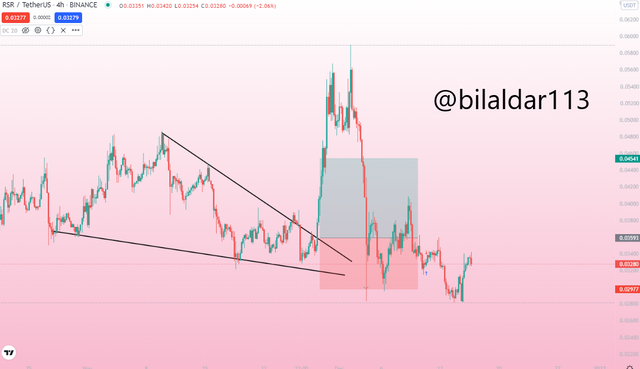
I have made a falling wedge pattern on RSR/USDT which is a bullish pattern and it is valid because the trendlines are perfect. When the price broke the upper line, I entered the trade by longing the asset with a risk to reward ratio of 1:5. Since the pattern was valid, the price was able to hit the TP without inconvenience.
5. Conclusion
5. Conclusion
The conclusion of my homework is that a rising wedge is the best pattern for traders to understand the future of an asset’s price and open short and long positions without facing any loss. The price has to move between 2 trendlines and taps both of them around 5 times altogether. By doing demo trade, I was sure that I have gained experience and was ready to trade using them with real-time investment.

Thanks For Visiting My Post
Cc: @sachin08
Sort: Trending
Loading...