[Leverage With Derivatives Trading Using 5 Min Chart ]-Steemit Crypto Academy | S6W1 | Homework Post for @reddileep


INTRODUCTION
Let’s consider the seesaw playing device which is an example of a lever. With a little effort, I can lift someone who is twice or thrice my weight high in the air, however without this lever, physically lifting someone thrice your weight is impossible. On the flip side if I don’t do my calculations well (like the force needed to lift my partner, or which end of the seesaw to sit, I can also come crashing to the ground as my partner's heavyweight might throw me to the ground.
Similarly, leverage works on the above operation of a lever in basic physics.
Leverage is also a tool or technique in trading which can be used to increase purchasing power which could lead to greater profits with very little capital. Just like the seesaw machine, if the needed analysis and calculations are not done well or backfire, would result in a great negative impact.
Question 1
Introduce Leverage Trading in your own words.
Leverage in crypto terms means using debt or borrowed funds by an investor to increase his purchasing power or stake in a cryptocurrency so as to make maximize his gains if the cryptocurrency performs well.
Leverage in the cryptocurrency marketplace is mostly provided by brokers. Investors in these markets also use leverage options such as margins and futures trading.
In margin trading, an investor uses his funds as collateral to increase his purchasing power of an intended crypto asset. For example if the collateral needed to purchase $500 of Bitcoin (BTC) is $50, this means that bitcoin has a leverage of 10x or a 10:1 margin.
In futures trading, the investor can secure an asset and have a trading contract with a buyer at a future date with both parties agreeing to a specific price for the asset.
If the value of the asset is $50 and on the said date, the price depreciates to $45, the buyer is at risk and the seller is in profit. Also, if the price of the asset increases to $55, the buyer makes a profit of $5 and the seller loses a $5 profit.
Leveraged trading requires a high level of skill in cryptocurrency trading and should be a no-go area for beginners in cryptocurrency trading else risk losing their hard-earned money.
Question 2
What are the benefits of Leverage Trading?
Benefits of Leverage Trading
More Purchasing Power
With the aid of leverage trading, an investor can hold up to $100 worth of assets using $10 which is a 10x leverage. This thereby enables investors to buy more of an asset with the little cash they have, which increases their stake in the asset.
Huge profit margins
Since leverage trading enables investors to purchase more and have some stake in the acquired asset so that when the asset price increases the profits realized by investors are very high.
Risk Management
Leveraging strategies like futures trading provide hedging risk management for investors, shielding them from some losses
Low-Interest Rates
Leverage allows investors to borrow funds at very low interest rates to enable investors thrive in the crypto marketplace.
Question 3
What are the disadvantages of Leverage Trading?
Disadvantages of Leverage
Huge Losses
Losses of investors can be damaging or very great for investors, should the price of the asset downtrends. Investors can risk losing their entire capital if their leverage ratio is great and the price decrease is very high.
Very Risky
Leveraged trading is quite risky and therefore requires experience, hence only sophisticated investors can use leverages as its negative consequences are not suitable for beginners on the market.
Investors may face Liquidation
Investors who perform leverage trading can also face liquidation of their assets to cater for the borrowed funds. Investors may sometimes face liquidation of their entire assets if the losses acquired are very great.
Question 4
What are the Basic Indicators that we can use for Leverage Trading? (Need brief details for any essential Indicators and their purposes)
In this regard, I would talking about the Relative Strength Index (RSI) indicator, the Moving Average ( MA) indicator and the Average Directional Index ( ADX) indicator.
Relative Strength Index (RSI)
The RSI is a type of technical momentum indicator used to determine overbought and oversold market signals on the market.
It is made up of just one trend line which moves in relation to the current market trend. It’s values range from 0-100.
0-30 on the RSI indicator indicates an oversold position of an asset, meaning a market uptrend is very much likely whiles a 70 and above mark on the indicator signals that the asset is overbought, meaning a possible market downtrend is apparent.
This phenomenon gives traders prior signals as to what the market trend would be.
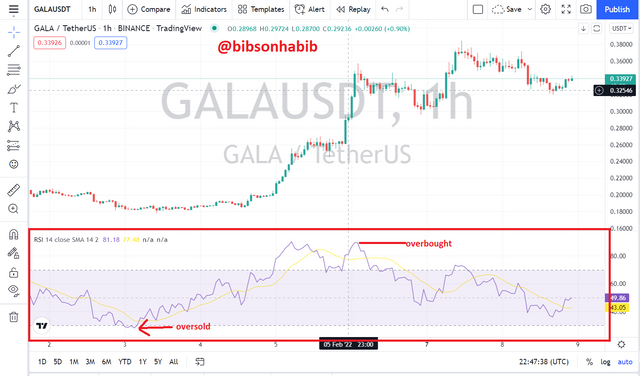
An RSI value of 30 or less means that an asset has been oversold and traders are exiting the market, forcing the price of the asset to reduce.
However, a price uptrend occurs just after the oversold signal since new traders would enter the market at the time of the asset’s dip and buy the asset at its support level, forcing the price of the asset to go high.
Also an RSI value of 70 and above shows an overbought position indicating a possible downtrend. A downtrend reversal occurs just after the overbought signal since most traders would exit the market when the asset reaches its resistance level in order to make profits.
The price of the asset depreciates due to the selling pressure.
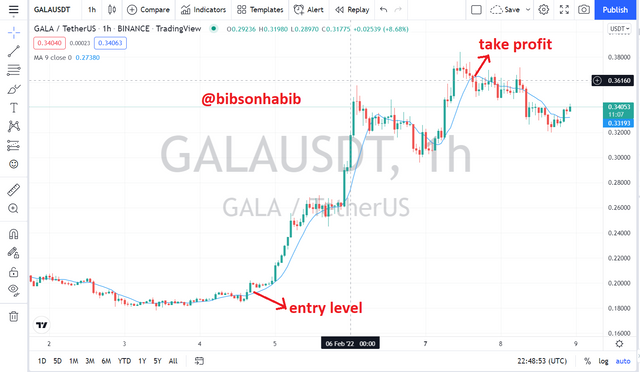
Moving averages
Moving average (MA) is also another example of a technical indicator that can be used to perform leverage trading. Moving averages are calculated in order to determine the trend direction of the price of an asset i.e whether the price is in an uptrend or downtrend. This enables investors to easily spot support and resistance levels of the crypto asset.
Just like the RSI, the MA is also made up of a single trend line that moves in relation to the price trend of the crypto asset.
A rise in the MA trend line indicates an uptrend and a fall in the MA indicates vice versa. The most common time frames for calculating moving averages span from 15-200 days.
Interpretation
A 15-50 MA is used to determine trend direction for shorter periods, a 50-100 MA is used to determine trend direction for slightly longer periods, whiles a 100-200 MA is used to determine trend direction for a very long period.
There are two common types of MA which are:
Simple moving average(SMA)
The SMA is calculated by finding the average of the sum of the closing prices divided by the specified number of days.
i.e*** SMA= (Sum of Closing prices/ Number of Days)***
Exponential moving average (EMA)
For exponential moving average, much emphasis is placed on recent data
The formula for calculating EMA is
EMA = Closing price * multiplier + EMA (previous day) * (1-multiplier)
Average Directional Index ( ADX with +D and -D)
This is a type of technical indicator used to determine the strength of a trend on the market. The ADX with +D and -D indicator is consists of three lines namely the ADX line, +D, and the -D line.
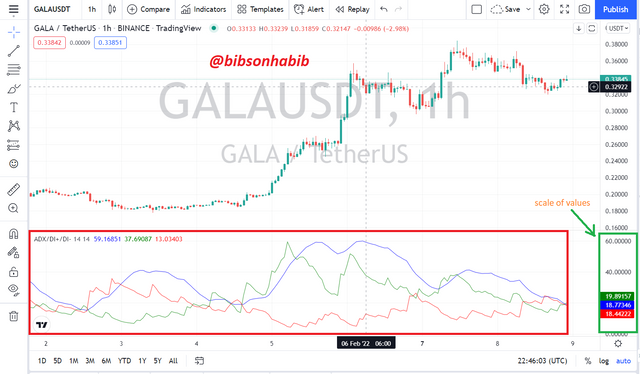
The Average Directional Index line consist of an oscillating trend line with a scale of values from 0-100 which is used to determine the strength of a trend.
The +D line is the positive indicator line used to determine the market trend in the positive or uptrend direction.
The –D line is also used to determine a market trend in the negative direction or downtrend.
The ADX values range from 0 to 100.
Below is the interpretation of the ADX values
| Value | Meaning |
|---|---|
| 0-25 | Absence or very weak trend formation |
| 25-50 | Strong trend formation |
| 50-75 | Very strong trend formation |
| 75-100 | Extremely strong trend formation |
Question 5
How to perform Leverage Trading using special trading strategies (Trading Practice using relevant indicators and strategies, Screenshots required)
In this regard, I would be using Moving Average in conjunction with the Parabolic SAR indicator.
To perform profitable leverage trading, an investor would need to recognize a buy signal and a sell signal, also he should also have in-depth information on the market i.e whether the buying and selling pressure is high or low in order to determine whether the market is in a high uptrend or downtrend.
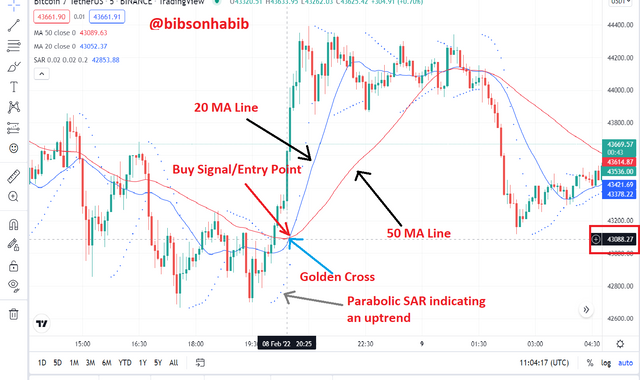
With the Moving Average indicator, I would be using the cross-over technique to spot buying and selling signals (entry and exit points). This involves using two MA lines, a short MA line and a long MA line which can also be referred to as the 20 MA and the 50 MA line respectively.
When the short or 20 MA line crosses above the long or 50 MA line, it is termed as the Golden Cross. This crossover indicates a buying signal, hence an entry position for a trader as a market trend is apparent.
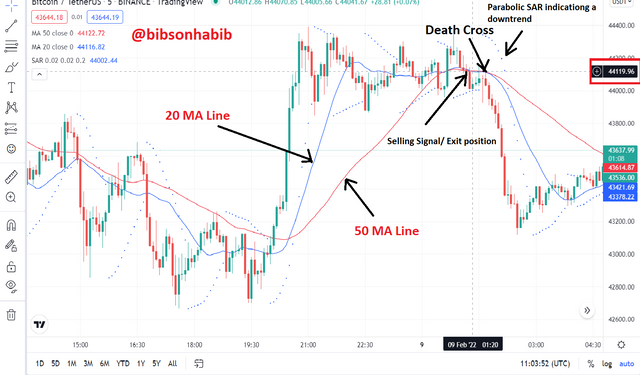
Also, when the short 20 MA line crosses below the long 50 MA line, it is termed as a Death Cross which indicates a selling signal, hence a possible market downtrend. This information enables the trader to exit the market to prevent losses. The Parabolic SAR indicator is also made up of broken dots in a form of a line. When these lines are below the price chart, it indicates a possible uptrend. Similarly, when these lines rise above the price, it indicates an apparent downtrend.
How to Identify a Buy Signal
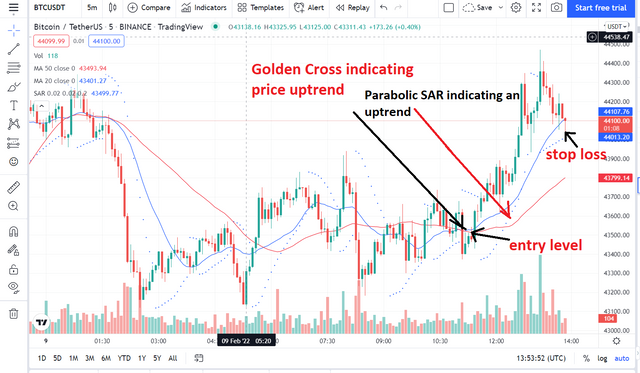
To identify a buying signal, using the crossovers in conjunction with the Parabolic SAR, we can see from the screenshot below of the BTC/USDT chart that the Parabolic SAR lines are in agreement with the signals given by the MA crossovers.
When the lines of the Parabolic SAR are below the price, it suggests a possible uptrend. Also if the lines are above the price, then a downtrend is apparent. From the screenshot, we can see that at a price of $43,088.26, the MA lines perform the Golden Cross, we can also see that the lines of the Parabolic SAR are also below the price, hence both indicators suggest a buying signal and an entry position as an uptrend is apparent.
After this signal, we can see that the price of BTC increases to about $44,119.96.
Spotting a Selling Signal
To identify a selling signal using the MA crossovers in conjunction with the Parabolic SAR, when the 20 MA line crosses below the 50 MA line and the Parabolic SAR lines also rise above the price chart, then a downtrend is very apparent. We can see from the screenshot of the BTC/USDT chart that when BTC rises to a price of $44,119.96, the two MA lines perform a Death Cross crossover and the Parabolic SAR lines also rise above the price, hence both indicators stating in agreement that a downtrend is apparent. We can see prices depreciate lower to $43,378.22.
Question 6
Do a better Technical Analysis considering the above-explained trading strategy and make a real buy long or sell short position at a suitable entry point in any desired exchange platform. Then close that buy or sell position after appearing trend reversal signal from the Parabolic SAR indicator. Here you can also close your Buy or Sell position using any other desired Trading Method in addition to the signal coming from the Parabolic SAR indicator. However, here you must prove that trading method as a reason for closing your position. (Usually, You should demonstrate all the relevant details including entry point, exit point, resistance lines, support lines or any other trading pattern. Use at least 2X leverage and no more than 10X )
In performing this leveraged trade, I will be using the 2 MA lines (20 and 50 MA) and the Parabolic SAR indicator which I discussed in my earlier submission. I would also be using the Binance Centralized Exchange to perform this trade.
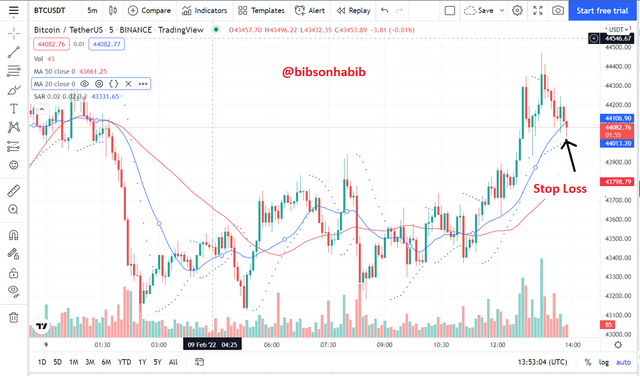
Let's take a look at the screenshot of the BTC/USDT chart below from tradingview.com.
from the 5-Min chart of the BTC/USDT pair, we can see that the blue 20 MA line crossed over the 50 MA line around the $43,500 price mark. We can also see that the Parabolic SAR indicator is also below the price chart. Both indications show that a price uptrend is much more likely to occur.
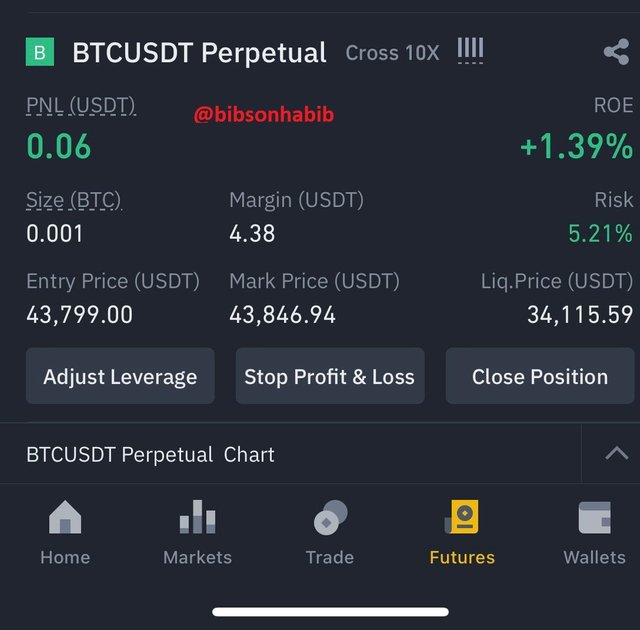
I however waited a little while before I entered a 10x leverage trade at the $43,799 price mark.

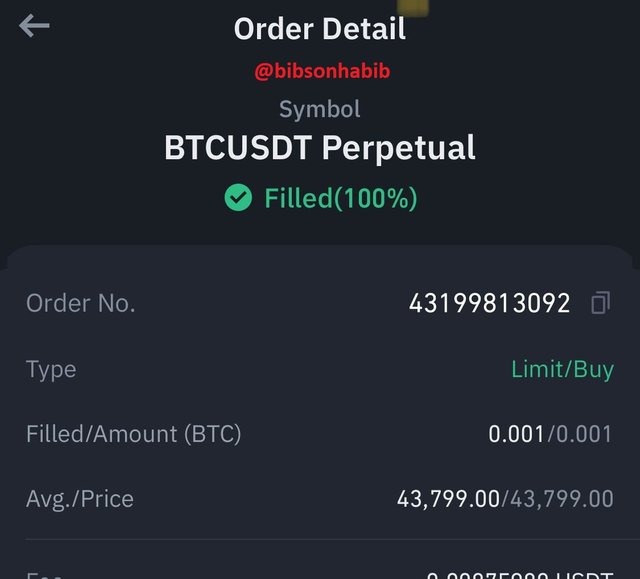
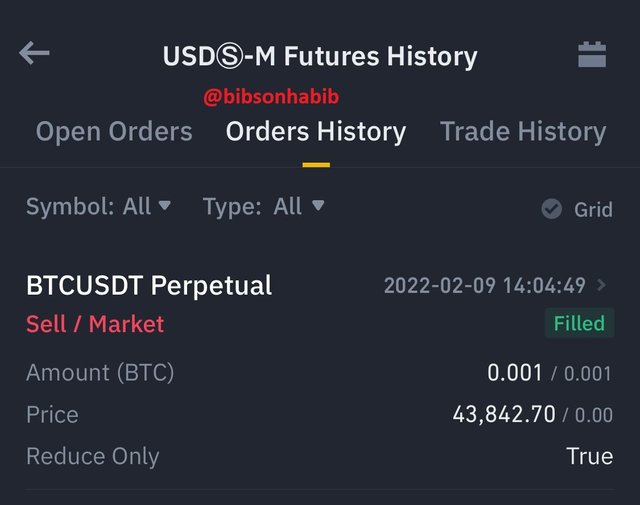
At the price of $43,842, I closed my position as the market was experiencing a downtrend and made a 1.39% profit.
From this trade, I have been able to make a profit from leverage trading
Conclusion
In conclusion, leverage as they say is a double-edged sword, its benefits can be great so is its negative implications. I would therefore advise beginners in cryptocurrency trading who seek to harness the power of this tool to learn more and make in-depth research about it. Some exchanges like Binance train their investors on these techniques.
The technical indicators used in this assignment also have their own strengths and weakness, but I believe a combination of them would result in the right analysis.
My regards to professor @reddileep for this educative assignment. Warm greetings to all the professors and members of this wonderful community.
I referred to one of my previous assignment posts to aid me in some explanations. source
Thank you for your time.