Trading with Accumulation / Distribution (A/D) Indicator - Steemit Crypto Academy / S4W5- Homework Post for Professor @allbert
Hello Dear Steemians,
And welcome,
Today I am glad to complete this homework task in which I described everything according to my knowledge and I hope that you will enjoy this home assignment.
![]()
Questions of the task
1- Explain in your own words what the A/D Indicator is and how and why it relates to volume. (Screenshots needed).
2- Through some platforms, show the process of how to place the A/D Indicator (Screenshots needed).
3- Explain through an example the formula of the A/D Indicator. (Originality will be taken into account).
4- How is it possible to detect and confirm a trend through the A/D indicator? (Screenshots needed)
5- Through a DEMO account, perform one trading operation (BUY or SELL) using the A/D Indicator only. (Screenshots needed).
6- What other indicator can be used in conjunction with the A/D Indicator. Justify, explain and test. (Screenshots needed).

Question No. 1
Explain in your own words what the A/D Indicator is and how and why it relates to volume. (Screenshots needed).
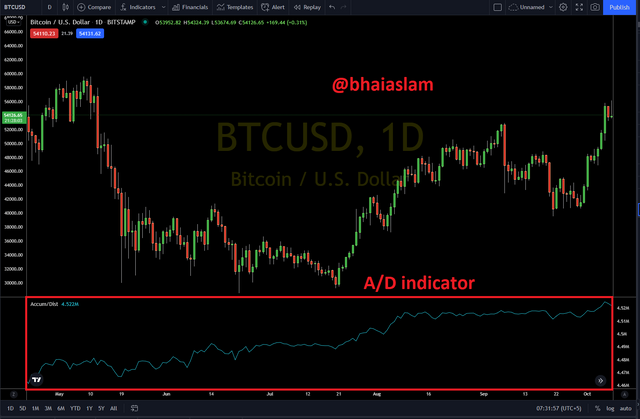
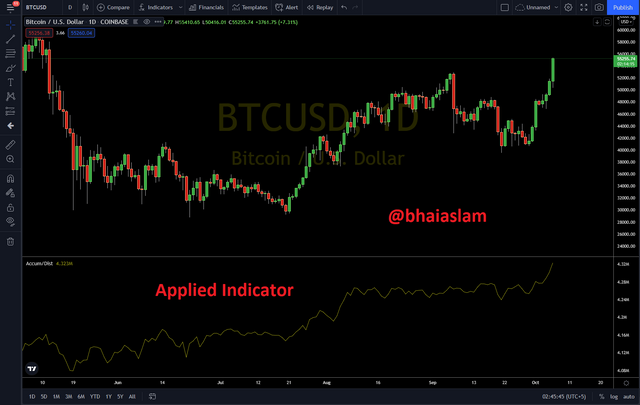
A/D is an indicator invented by a famous trader Marc Chaikin. This technical indicator considers the volume of the asset and price if it is accumulating or dividing.
A stand for Accumulating means the asset which traders buy or keep and then the price of the asset goes up. This is seen in the market structure before an uptrend.
D stands for distributing means the asset which traders get rid of, causing the price of the asset to come down. Usually, it is seen in the market structure after the uptrend.
Therefore, the A/D indicator is the difference between accumulating and distribution of the asset. A/D indicator indicates the difference between stock price and the flow of the volume and if the price is increasing and the indicators are falling. then it suggests buying or accumulation to the volume not be enough and to the support price rise and the price, the decline could be forthcoming. So, for this purpose, it uses volume so it also relates to volume for its indication.
As I already said that A/D indicator depends on the volume of the asset. A/D indicator uses volume and price to indicate the ratio of accumulation and distribution. When the chart indicates move up then it indicates that traders buy the asset and it is a market role that the price of the product will increase with its demand so according to this role, the price of the assets increase and when the indicator is in trend down or bearish then the indicator indicates that traders are exiting to the trade so the price become low. By buying and selling assets, the volume of the asset infectes and we can say that the A/D indicator depends on volume.
Traders buy assets in accumulation and keep that asset. On the other hand, traders sell assets in the distributing phase. When traders buy particular assets then the price of the particular asset increases and its activities also increase. But, when the traders sell assets then the price of the assets decreases, and here also its activities show change. This all depends on the volume of the asset and volume decreases when traders exit from the trade.
Question 2
Through some platforms, show the process of how to place the A/D Indicator (Screenshots needed).
Now in this answer, I will tell you that who to place the A/D indicator.
But before moving I wanna tell you that I will discuss it step by step to avoid confusion.
Step 1.
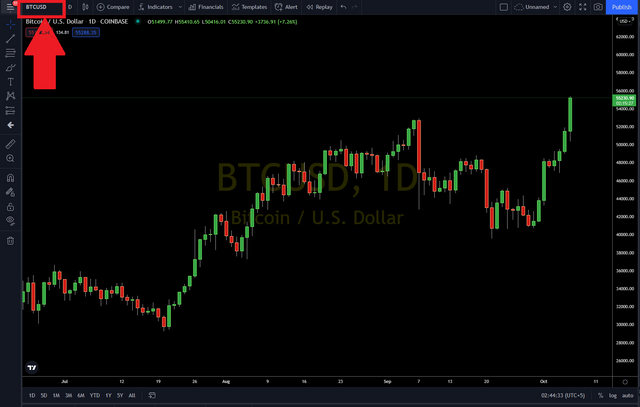
So, for placing the A/D indicator I opened a trading platform named Tradingview as you are looking in the screenshot.

Step 2.
After opening the site, an option of Chart looked in the menu bar and I clicked on it then a trading opening where market candles were looking.

Step3.
Here any asset pair can be selected but here my selected pair is BTC/USD.
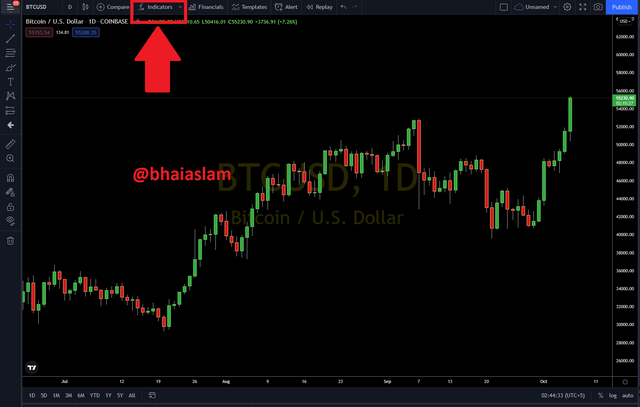
Step 4.
I clicked on the indicator option in the menu bar and after a box opened where I added the A/D indicator name.
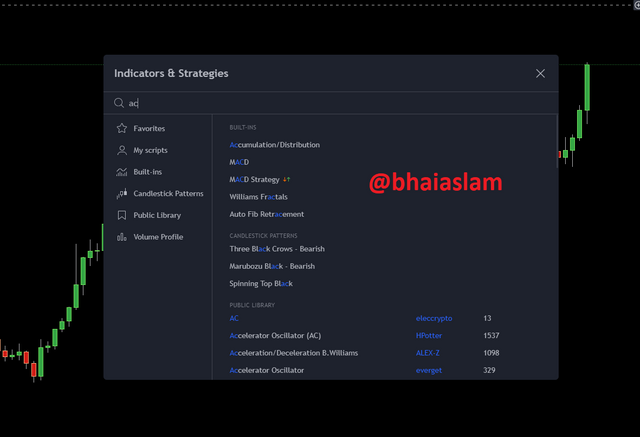
Step 5.
I clicked on the full name of the indicator that appeared after texting the initial words of the indicator's name. When I clicked on the full name of the indicator that was displaying, the zig-zag line appear on the chart that was an indicator.
So, I placed the A/D indicator with five easy steps and this was so easy to place it in the chart.
Question No. 3
Explain through an example the formula of the A/D Indicator. (Originality will be taken into account).
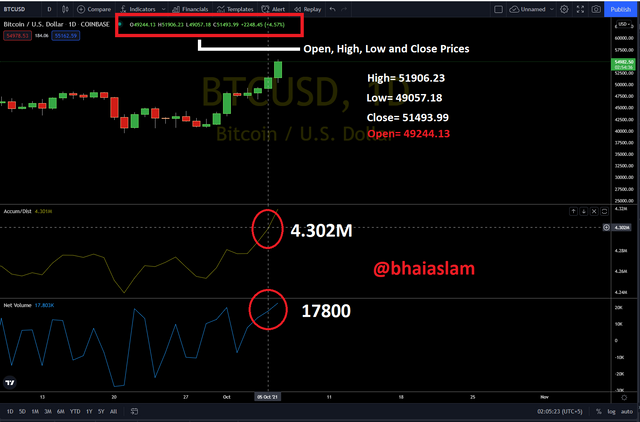
High=51906.23
Low=49057.18
Close=51493.99
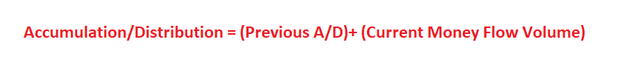
Accumulation/Distribution = (Previous A/D)+ (Current Money Flow Volume)
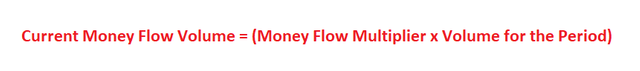
Current Money Flow Volume = (Money Flow Multiplier x Volume for the Period)
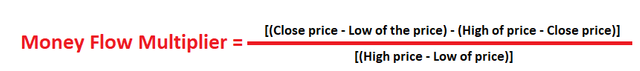
Money Flow Multiplier = [(Close price - Low of the price) - (High of price - Close price)] / [(High price - Low of price)]
This is the actual formula and in number one I saw an A/D value that is equal to the previous A/D+Current Money Flow Volume. But, here I will find out the Current Money Flow Volume (CMFV). Here also I've needed to Money Flow Multiplier to find out CMFV so I will find out Money Flow Multiplier.
Formula to find Money Flow Multiplier
Money Flow Multiplier = [(Close price - Low of the price) - (High of price - Close price)] / [(High price - Low of price)]
Money Flow Multiplier = [(51493.99-49057.18)-(51906.23-51493.99)]/[(51906.23-49057.18)]
Money Flow Multiplier =[(2442.81)-(412.24)]/[2849.05]
Money Flow Multiplier= 0.7127
Now calculate Money Flow Volume. I will use the formula, Current Money Flow Volume = (Money Flow Multiplier x Volume for the Period)
Formula of Current Money Flow Volume
Current Money Flow Volume = (Money Flow Multiplier x Volume for the Period)
Current Money Flow Volume =(0.7127) x (17800)
Current Money Flow Volume =12.686.06
Finally, I will calculate the value of A/D. I will use formula, Accumulation/Distribution = (Previous A/D)+ (Current Money Flow Volume)
Accumulation/Distribution = (Previous A/D)+ (Current Money Flow Volume)
A/D = (4.302M+(12626.06)
A/D= 4314686.06≌ 4.314M
Question No. 4
How is it possible to detect and confirm a trend through the A/D indicator? (Screenshots needed)
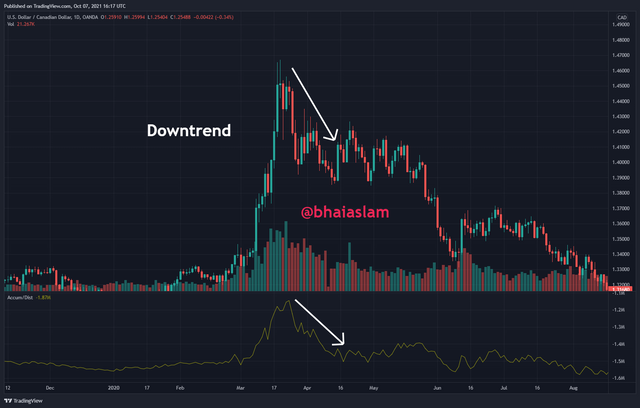
Yes, after adding the A/D indicator in the chart it is possible to confirm the trend because after adding an indicator to the chart the indicator distributes in the case of bearish, and on the other hand in the case of an uptrend or bullish, it accumulates.
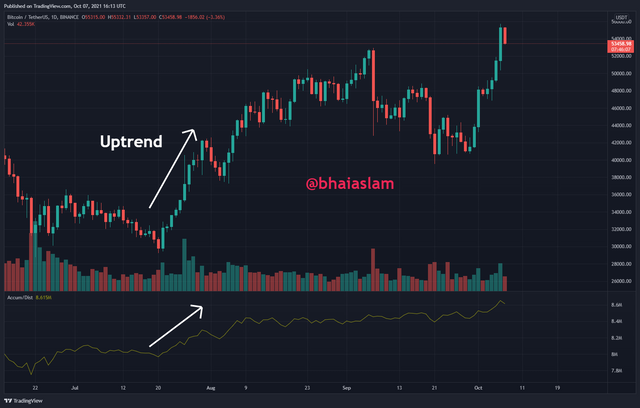
So, these prices that we can detect and confirm trend through indicator because indicator also actions and moves according to the trends that make easy to traders but it always did not stays 100% correct.
Question No. 5
Through a DEMO account, perform one trading operation (BUY or SELL) using the A/D Indicator only. (Screenshots needed).
I made a Sell trading operation and for this, I used paper trading in trading view. First of all, I used the EZBTC pair for completing this operation. After, I found a bullish divergence. But the A/D indicator was showing the opposite direction of the coin pair direction as shown in the screenshot and it was signaling the bearish in the future so I trade on the coin because it was seeming that it will move in the bearish direction in the future so I traded on it.
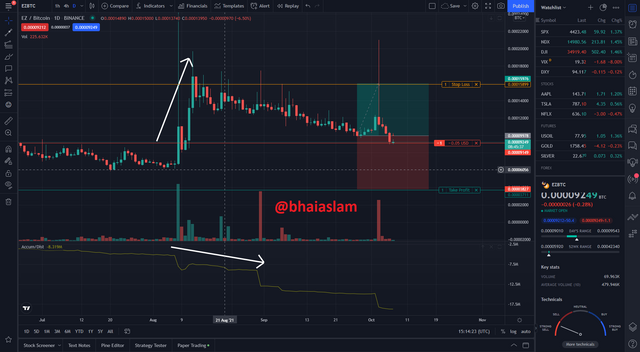
For this, I set Take Profit and Stop Loss and so I set a BUY and my risk-reward ratio was 1:1.
Question No. 6
6- What other indicator can be used in conjunction with the A/D Indicator. Justify, explain and test. (Screenshots needed).
No one indicator is 100% right and we are all familiar with it and As far as the A/D indicator is concerned, it is also not entirely correct, and sometimes it is also wrong indicates that makes trading insecure. So, other indicators can be uses with the A/D indicator to makes future trading reliable and secure in the direction of prediction.
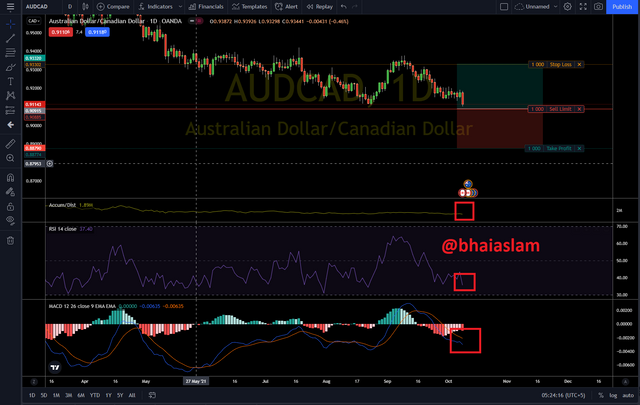
I used two more indicators for this purpose and I used the RSI indicator and MCAD indicator with the A/D indicator to make it reliable to trade.
As in the below picture, you can see that both reference indicators are moving in the direction of the A/D indicator, and this is indicating the strong sell point because the moment of all indicators is in the one direction and we can deduce that nothing indicator is moving false.
So. I traded-sell here at these strong sell points and my risk/reward ratio was 1:1 and my trade has been set that will be finished in the coming time.
Both trades will finish coming days so I cannot share the screenshot of the trading result yet.
Conclusion
The Accumulating/DIstribution indicator is so simple to use and analyze market ratio which determines asset price and volume and it also can predict the direction of the trend. Almost it is so useful for the traders and I come to this conclusion after solving this task and I learn that we should use it with another indicator to make trading secure and reliable.
.gif)
Thanks to @albert to share this amazing blog and I will try to use it in practical trading in the future.