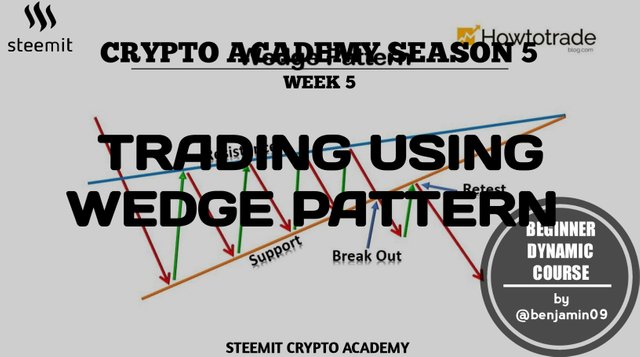
REPOST!! | Trading Using Wedge Pattern - Crypto Academy / S5W5 - Homework Post for @sachin08

Here is a link to the post
Trading Using Wedge Pattern - Crypto Academy / S5W5 - Homework Post for @sachin08
Greetings guys and welcome to my homework post entry into the crypto assignment "Trading Using Wedge Pattern" which is taught in the Crypto Academy by Professor @sachin08.

1. Explain Wedge Pattern in your own word.
When trading, a trader can use several methods of analyzing a market structure and candlestick patterns. When analyzing the market, several patterns can be seen and these patterns can be used for trading and investment. An example of such market patterns is the wedge pattern.
The wedge pattern is a pattern which is identified by two trendlines that point in the same direction and meet each other. This means that, with the wedge pattern, the market price will be among two trendlines; a resistance line and a support line, and these lines will meet close to each other. The price will touch the resistance and support lines at least twice per each line. This is to assure that it is indeed a wedge and not just a ranging market.
The wedge pattern is formed at the edge of a trend or at a mid-trend state. At the top of the trend, when the wedge pattern forms, there is going to be a trend reversal. Also, when the wedge forms at a mid-trend state, there is going to be a trend continuation.
There are two types of wedge patterns; the rising wedge and the falling wedge.
2. Explain both types of Wedges and How to identify them in detail. (Screenshots required)

a. The Rising Wedge.
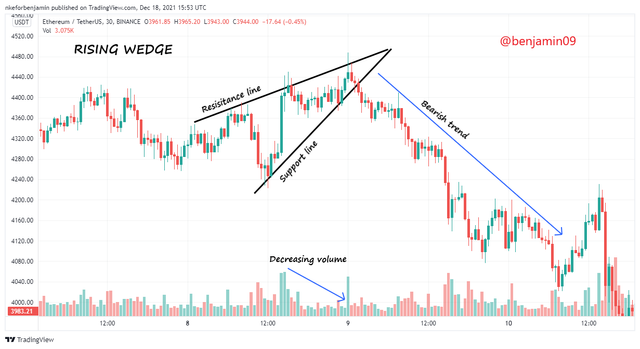
The rising wedge is a wedge pattern in which the price is moving upwards between the trendlines and a downward movement is expected. The resistance and support lines are both facing upwards and are close to each other.
The rising wedge pattern is always considered as a bearish version of the wedge patterns because, when ever a price is a rising wedge, it is bound to eventually fall and enter a bearish position. The price usually breaks the support line while in a rising wedge and this break is the start of a bearish movement and also indicates an end to the upward movement of the price.
When the price is in an upward trend and then enters into the rising wedge pattern, this indicates as a trend reversal with a future bearish movement. And when the price is in a downward trend and then enters into the rising wedge, this indicates a trend continuation as the market strength was being tested.
By observing the above screenshot, we can see how to identify a rising trend which is by observing the following features.
The 2 trendlines are moving upwards. Both the resistance and support lines are in an upward moving direction and they both come close to each other and meet.
Multiple touches on the trendlines. For the market to actually be considered as being in a rising wedge, the price must touch each of the trendlines severally. There should be atleast 2 touches on 1 trendline and 3 touches on the other trendline.
Volume. The volume should be experiencing a downward movement in order for the rising wedge to be accurate.
The breakout volume of the rising wedge.The volume which might breakout at the end of the rising wedge is generally below average, though it could be high or low in some instances.
After analyzing the above points, we can consider the above chart as being in a rising wedge, because the volume is decreasing, the 2 trendlines are moving upwards and meet each other, and also, there are multiple touches on the trendlines.
b. The falling wedge.
The falling wedge pattern is a wedge pattern where in the price is falling between the 2 trendlines and a bullish movement is anticipated. Both the resistance and support lines are sloping downwards and they are close to each other and could even intersect each other.
The falling wedge pattern is the bullish version among the wedge patterns because, when the price is a falling wedge, the price will eventually cross the resistance line and begin an upward movement. The price breaks the resistance line while in a falling wedge and this breakout at the resistance line is the beginning of a bullish movement and also indicates an end to the downward movement which the price was experiencing while in the falling wedge.
When the price is in an upward trend and then enters into the falling wedge pattern, this indicates a trend continuation in which the trend strength is being tested but eventually continues in the upward trend. And whenever the price is in a downward trend and then enters into the falling wedge, this indicates a trend reversal with an upward trend beginning at the breakout of the resistance line.
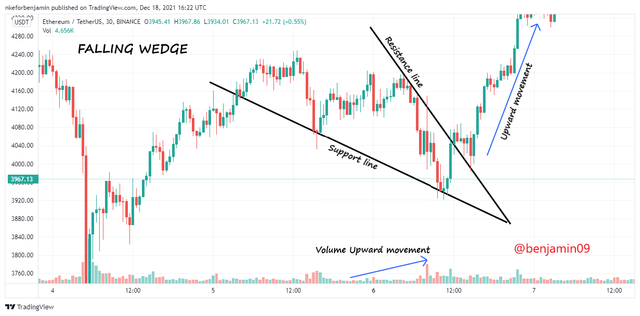
The above screenshot is a chart of the ETHUSDT currency pair and a falling wedge is seen. We can better understand the above screenshot by knowing how a falling wedge is identified. Let us see how a falling wedge is identified in the following points.
The 2 trendlines are moving downwards. Both the resistance and support lines are in a downward sloping motion and they come close to each other and intersect.
Multiple touches on the trendlines. There are several touches on each of the trendlines with at least 2 touches on 1 trendline and at least 3 touches on the other trendline.
Volume. The volume should be experiencing an upward movement.
3. Do the breakout of these Wedge Patterns produce False Signals sometimes? If yes, then Explain how to filter out these False signals.
The information which is provided by the wedge patterns is most of the time accurate, but there are several times when the wedge pattern can be misleading and not accurate and thus produce poor trading results. Such an example of a false signal produced by the wedge pattern can be seen below.
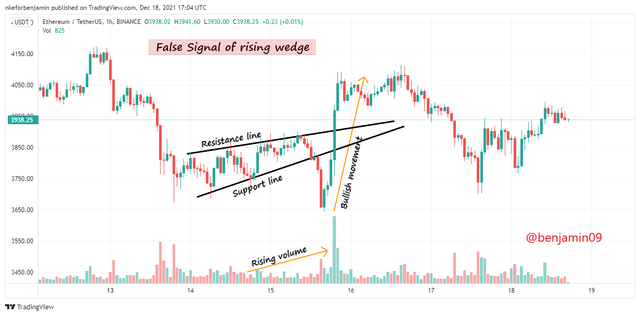
From the above chart, we can see that the price formed a rising wedge pattern but after the breakout at the support line, the price just fell for a while then started shooting up, entering a bullish trend. Therefore, we can see the rising wedge pattern as a false signal of a fall in price.
We can avoid such false signals from the wedge pattern by using indicators such as the Stochastic Oscillator and the Relative Strength Index. We can practically understand how to use this indicator to filter false signals from the wedge patterns in the image below.
Stochastic Oscillator.
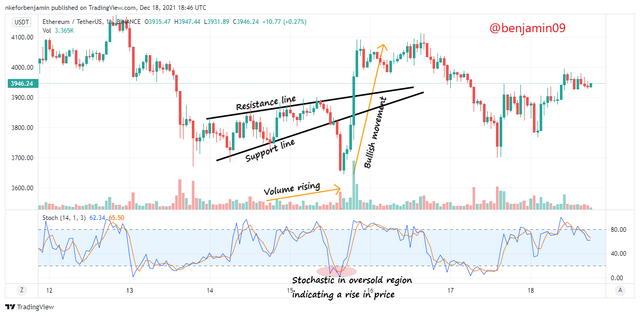
From the above screenshot, we can see that when the price was in a rising wedge and there was a breakout at the support line, the Stochastic was in the oversold region, which indicates that there will be no fall in price, but a rise in the price of the currency pair ETHUSDT. This signal from the Stochastic Oscillator has made the trader realize that there will be no fall in the price of that currency and thus, that is a false signal from the rising wedge pattern.
Relative Strength Index(RSI).
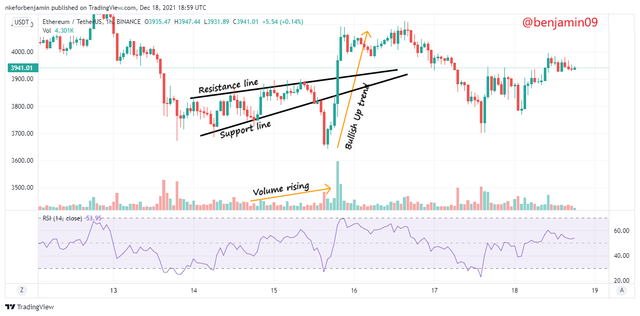
From the above screenshot of the ETHUSDT chart, we can see the price in a rising wedge and at the point of the breakout at the Support line, we will find the RSI to be already below 50. Any trader who intends on making profit by using the RSI indicator will not place a sell trade at this position because there are so many variables. A trader will wait for the RSI to cross 50 in order to place a profitable trade.
And just as expected from an unsure trade, the price later stopped falling and entered a bullish trend. A trader who had waited for cross in the RSI, will place a buy order when the price crossed 50 moving upwards.
4. Show full trade setup using this pattern for both types of Wedges.( Entry Point, Take Profit, Stop Loss, Breakout)
Rising wedge.
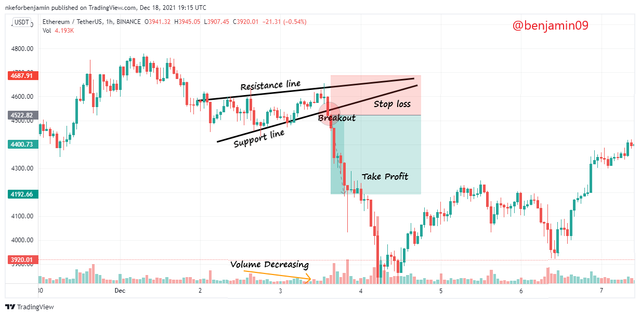
From the above screenshot taken from the ETHUSDT chart, we can find that the price entered a rising wedge pattern where the price remained between the resistance line and the support line. At the point when the price crossed the support line moving downwards, that is the breakout point. At the next candlestick, I place by sell trade, making this my entry point.
The Stop loss is placed above the resistance line and the take profit is placed such that the risk:reward ratio is 1:2.
Falling wedge.
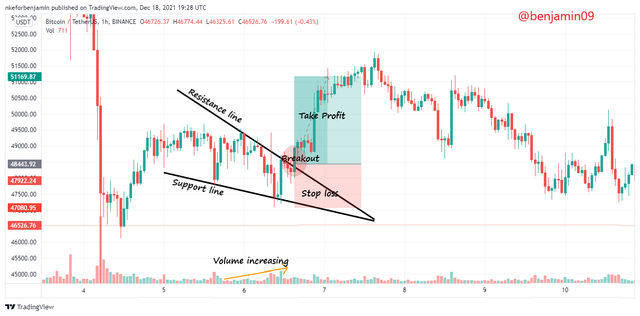
From the above screenshot of the currency pair BTCUSDT, we can see that the price entered a falling wedge with the price between the 2 trendlines moving downwards. When the price crossed the Resistance line moving upwards, this is the point of the breakout that acts as the perfect entry point while using the wedge pattern.
The Stop loss is placed below the support line and the take profit is placed such that the risk:reward ratio is 1:2.
5. Conclusion
Trading with the use of market patterns and structures is very easy and understandable for users. An example of a market pattern is the wedge pattern which we have just discussed above. There are two types of wedge patterns; the rising wedge pattern and the falling wedge pattern.
With the rising wedge pattern, we can identify the price moving upwards, but later on falls and breaks the support line and at this breakout, we place our trade and adjust our risk:reward ratio. And for the falling wedge pattern, we find the price moving downwards within the downward sloping trendlines and at the breakout at the resistance line, we place our buy order and adjust our risk:reward ratio.
But like we discussed in Question 3, the data from the wedge pattern is not always very accurate and sometimes the wedge pattern produces false signals. It is for this reason why we use indicators such as Stochastic Oscillator, RSI in order to filter these false signals and thus, place profitable trades.
Thank you for reading.
CC: @sachin08