[Heikin-Ashi Trading Strategy]-Steemit Crypto Academy | S4W2 | Homework Post for @reddileep

Define Heikin-Ashi Technique in your own words.
Heikin-Ashi is a Japanese word that means “average bar”. This a technique of graphically representing data in the form of candlesticks where the information of the previous candlestick serves as basis on which the next candlestick is gotten from. A current candle in Heikin-Ashi technique will depend on 4 types of data of the previous candle, these data are open, close, low and high. The Heikin-Ashi makes use of the average of price movements. This technique was invented by Munehisa Homma in the 1700s
The Heikin-Ashi technique actually makes the chart looks very neat and easy to analyze. Just like the normal candlesticks trends are represented with colors and these colors in Heikin-Ashi changes when there is a complete trend reversal.

Make your own research and differentiate between the traditional candlestick chart and the Heikin-Ashi chart. (Screenshots required from both chart patterns)

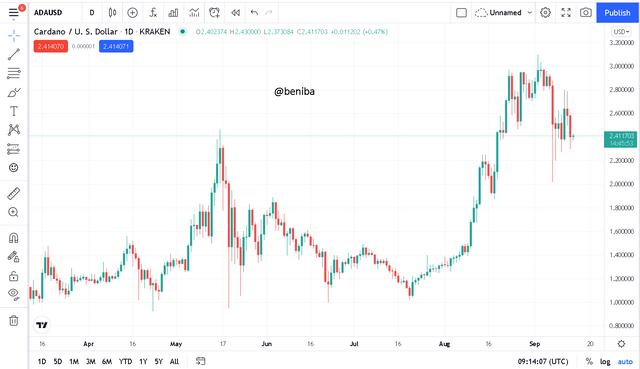
TRADITIONAL CANDLESTICKS ON A CHART
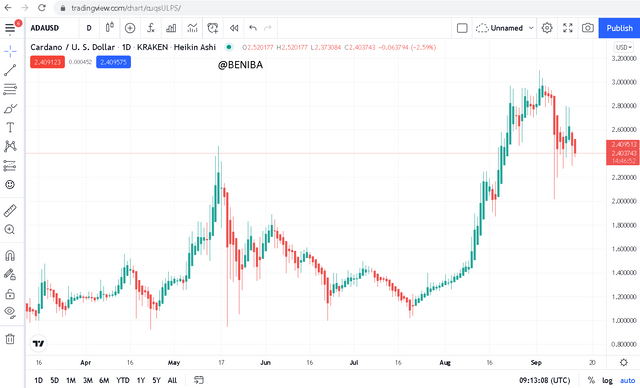
HEIKIN-ASHI TECHNIQUE USED ON A CHART
| HEIKIN-ASHI CHART | TRADITIONAL CANDLESTICK CHART |
|---|---|
| Price trends are easier to spot because the small changes in price do not change the colors of the candles and hence gives it a more smooth display | The colors of candlesticks frequently change thus the slightest change affects the colors and hence makes it very difficult to analyze. |
| A Heikin-Ashi candle starts from the middle of its preceding candle | a traditional candlestick begins from the close point of the preceding candlestick. |
| Candlestick are generated through calculated with preceding candlestick data | candlesticks open at where the preceding candlestick closed. |

Explain the Heikin-Ashi Formula. (In addition to simply stating the formula, you should provide a clear explanation about the calculation)

Heikin-Ashi has 4 types of data and these data has a way it can be calculated and in this question I will be explaining the formula of calculating their values. IN ORDER FOR YOU TO CALCUALATE THE VALUES OF THE NEXR CANDLE YOU WILL NEED TO USE THE FOLLOWING FORMULAE.
CLOSE IS CALCULATED BY FINDING THE AVERAGE PRICE OF THE PREVIOUS CANDLESTICK.
CLOSE = (open + close+ low+ high) divided by 4
Note: all values are values of the previous candlestick.
Every candlestick has an open, a close, a low and a high so you need to sum all these values and then divided by 4 because there are four values.
OPEN is calculated by finding the mean of the open price and close price of the current candlestick
You need to sum the value of the open and close of the previous candle and now divide by 2 to get their average and that becomes your open for the next candle.
HIGH is obtained by picking the highest value from high, open, or close of the current period
LOW is obtained by picking the lowest value from low, open, or close of the current period

Graphically explain trends and buying opportunities through Heikin-Ashi Candles. (Screenshots required)

Just like the traditional candlesticks, Heikin-Ashi candles are made of the body and wicks. In an uptrend the candles present have their wicks above their body and in a downtrend the candles have their wicks below their body and in a case where the wick is visible on both ends then it signals indecision and suggest a market trend reversal.
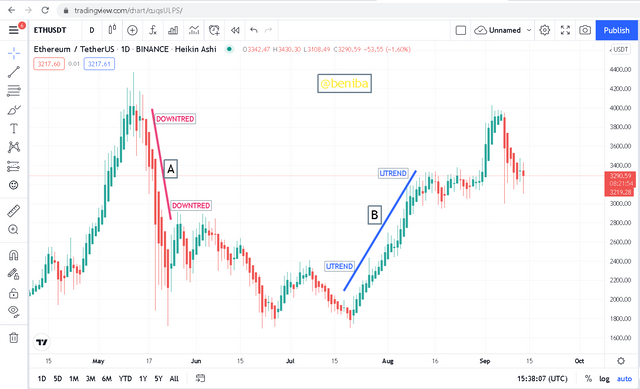
From the screenshot of the chart above line A indicates a downtrend in the market, as seen the wicks of the candles are below the body of the candles and Line B also shows an uptrend in the market the wicks are also above the body of the candle.
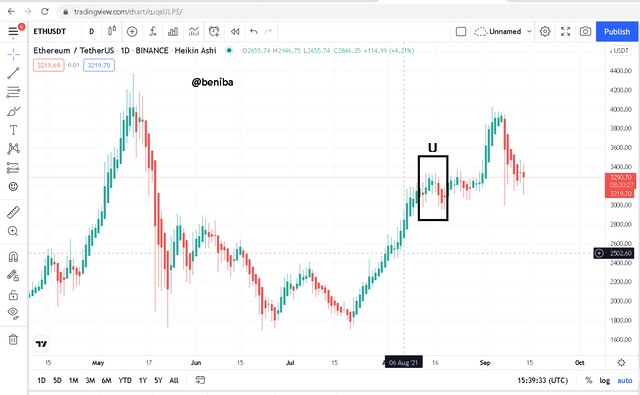
Also from the chart above the portion marked with the box labelled U is a point where investors can enter into a trade because a trend reversal is expected because the candle marked has visible wicks on both ends. Its an opportunity to buy and expect an uptrend soon.

From the chart above the portion marked with a box labelled D is a point where a trend is expected to be reversed from an uptrend to a down trend and so investors should sell their assets in order to take profit. That is a sell signal.

Is it possible to transact only with signals received using the Heikin-Ashi Technique? Explain the reasons for your answer.

Transacting only with signals received from the Heikin-Ashi is quiet risky and can be misleading. Heikin-Ashi in itself is not an indicator but a representation of price movement. Even though most at times the signals are correct it is very risky to rely on just the signals from Heikin-Ashi technique.
Even with technical indicators it is advisable to combine different indicators in order to get very effective results so I will also advice than Heikin-Ashi should be used with other indicators to confirm signals. More to the point some times the Heikin-Ashi gives signals that are not fulfilled.

6- By using a Demo account, perform both Buy and Sell orders using Heikin-Ashi+ 55 EMA+21 EMA.

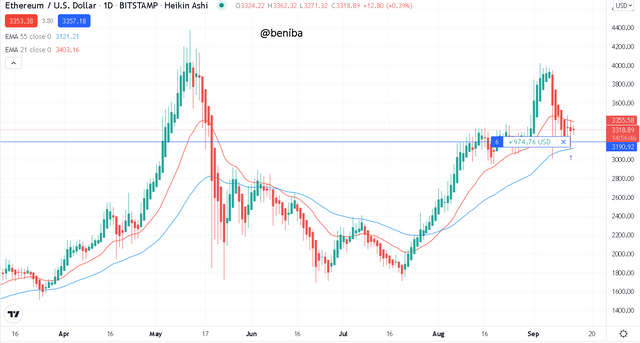

I added the 55 EMA and 21 EMA to the Heikin-Ashi on the ETHUSD chart and after a series of bearish candles there was an indecisive candle which suggested a trend reversal and the EMA also confirmed the anticipation of an uptrend so I bought 6 units of ETH
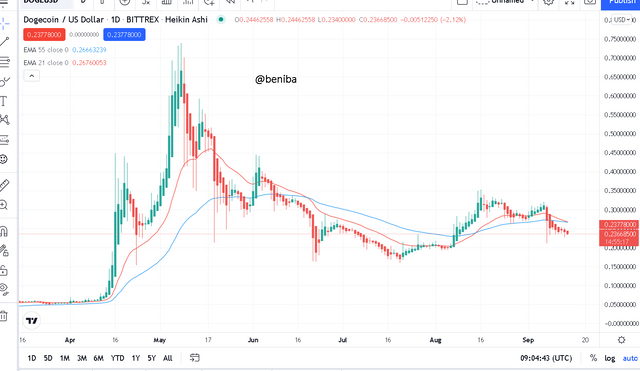

I added the 55 EMA and 21 EMA to the heikin-Ashi and after a series of bullish candles there was an indecisive candle which suggest a trend reversal so I bought 6 units of doge.


Technical analysis is the key to a successful crypto trade and the Heikin-Ashi has made it very easier to spot market trend and spot reversals. This helps investors know when to open trades. Thanks to professor @reddileep for this lesson.