Crypto Academy / S5W2 - Homework Post for @sachin08".
![AddText_11-27-10.33.17[1].jpg](https://steemitimages.com/640x0/https://cdn.steemitimages.com/DQmY7me4dPL5Qkd7dusUGGwSUnwqiKVRueGwjsqiVtZWi19/AddText_11-27-10.33.17[1].jpg)
What is your understanding about Triangles in Trading. Explain all forms of triangles in your own words. (Screenshot required)
Triangle patterns in trading are types of trend continuation patterns and the function of this class of patterns is to tell whether a current trend in the market is likely to continue or not. The triangle pattern is made up of two trend lines that originate from different points but finally meet a one particular point. It is a very good tool used by traders to time their trade. Basically the triangle patterns are in three forms namely:
• Ascending triangle
• Descending triangle
• Symmetrical triangle
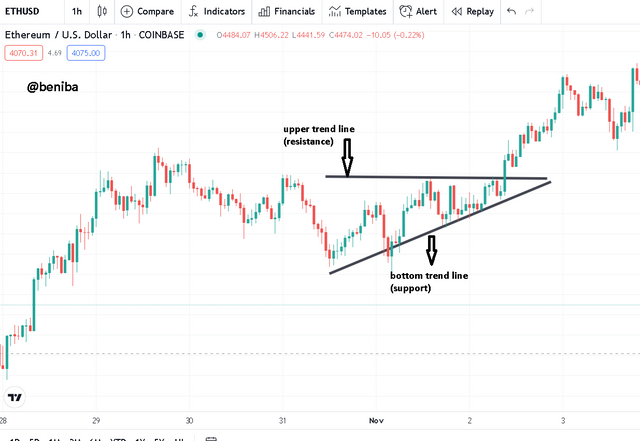
From our knowledge in English we all know that the word “ascending” is associated with the act of going up. In this case it is the same the ascending triangle pattern is seen during a bullish market. In as much as I said it appears in a bullish trend I must clarify that the trend is not always a very strong trend that is the bull run is some how limited because the growth is within a range that is generated by the upper trend line.
Let me now touch a little on the structure of the ascending triangle, I already said that is made up of basically two trend lines. The two trend lines can be labeled as upper and bottom trend lines. In an ascending triangle the upper trend line appears to be flat and it serves as the resistance line of the pattern whilst the bottom trend line is seen to be moving in an upward direction and is also serving as a support level. In the long run the market continues in a bull run and there is a good tool for those who want to enter into long trades.
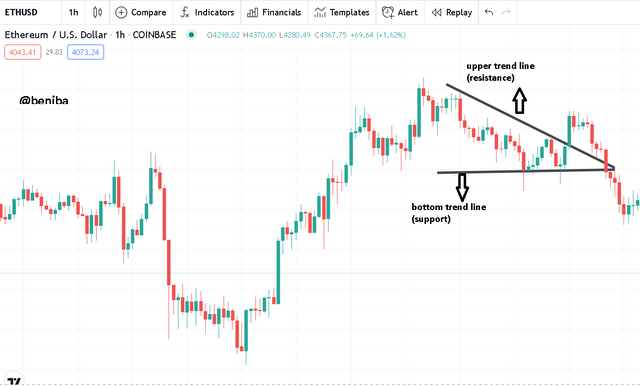
In English language when we hear ‘descending’ we know it is associated with the act of coming down so it is simple if we conclude that descending triangles are patterns that are generated during a bearish trend. Just like any triangle pattern, the descending triangle is drawn using two trend lines where the upper trend line projects a downward movement whereas the bottom trend line remains flat which serves as the support level for the market.
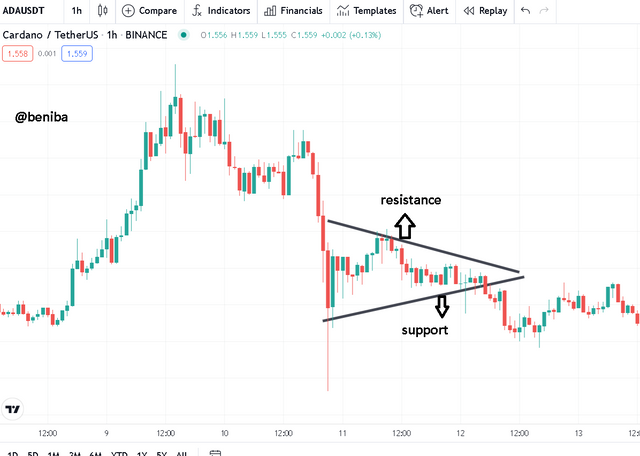
This is the last triangle pattern. This pattern occurs during a period of indecisiveness. It is not clearly a bullish trend neither is a bearish trend. The market Is said to be indecisive. In this pattern both trend lines appears to be converging at a particular point unlike in the previous two patterns where one trend line remains flat whilst the other appears to be moving in a certain direction. During this pattern the range narrows down until either a breakout or break down is experienced.

Can we also use some Indicators along with it Triangle Patterns? Explain with Screenshots.
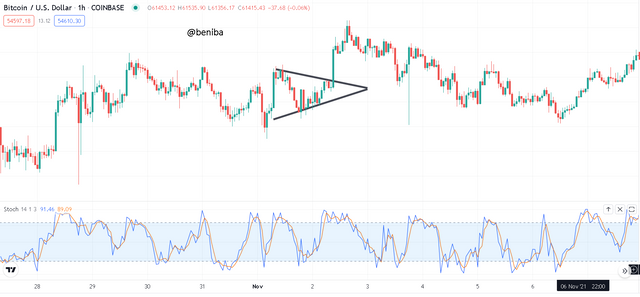
In general trading, we already know that no technical tool or strategy is 100% or perfect so it is always advisable to combine different types of indicators in order to be sure of signals generated. It is same as the triangle patterns, they are not 100% and so we need to combine them with other indicators. I will choose to use the triangle patterns with the stochastic indicator in the example below.
Explain Flags in Trading in your own words and provide screenshots of both Bull Flag and Bear Flag.
Flag patterns are patterns that are established after a sharp movement of the price in either directions in a very short time. The sharp movement of the price is then accompanied by a series of candlesticks forming another pattern which in most cases are triangle patterns. The flag pattern is a pattern that gives clue after a possible trend continuation or a trend reversal. There are two types of flag patterns. I will briefly describe their anatomy in the next paragraphs the two types are
• BULLISH FLAG
• BEARISH FLAG
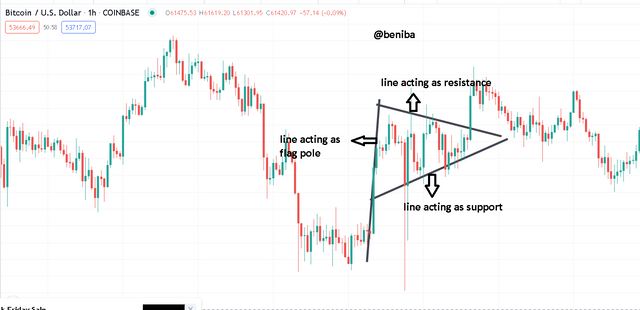
This is a type of flag pattern where there is a sudden surge in price of an asset after which the markets seems to be in a triangle pattern representing resistance and support levels. The candlestick(s) becomes the pole of the flag and the pattern formed afterward is called the flag. Just like the normal triangle pattern the upper trend line is the resistance level and the bottom trend line is called the support line. When there is a break out it send signals to the trader.
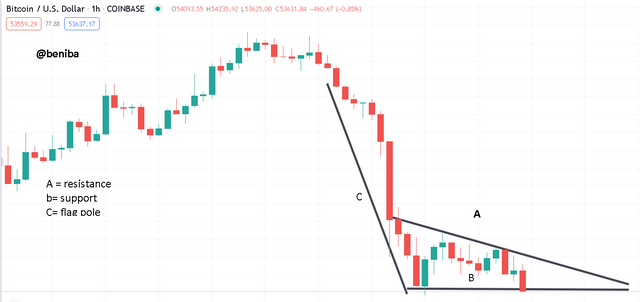
This is a type of flag pattern where there is a sudden decline in price of an asset after which the markets appears to be in a triangle pattern with the two trend lines becoming the resistance and support levels. The candlestick(s) representing the decline in price becomes the pole of the flag and the pattern formed those candlesticks are called the flag. The upper trend line of the Triangle pattern is the resistance level and the bottom trend line is called the support line
Show a full trade setup using these Patterns on any Cryptocurrency chart. (Ascending Triangle, Symmetrical Triangle, Bear Flag)
ASCENDING TRIANGLE
As described earlier, the ascending triangle is made of two trend lines one been a resistance line and the other being a support zone.
• My entry point will be the point where the price breaks the resistance line. In my screenshot that point is marked A
• I will set up my take profit at point marked P on the screenshot which is higher than the resistance zone
• My stop loss point will be the place marked L which is place a little below the support level.
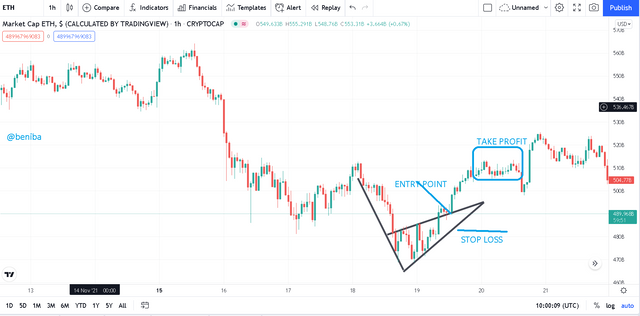
SYMMETRICAL TRIANGLE
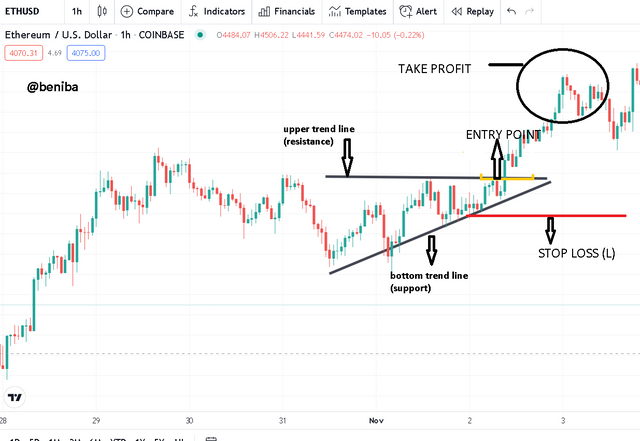
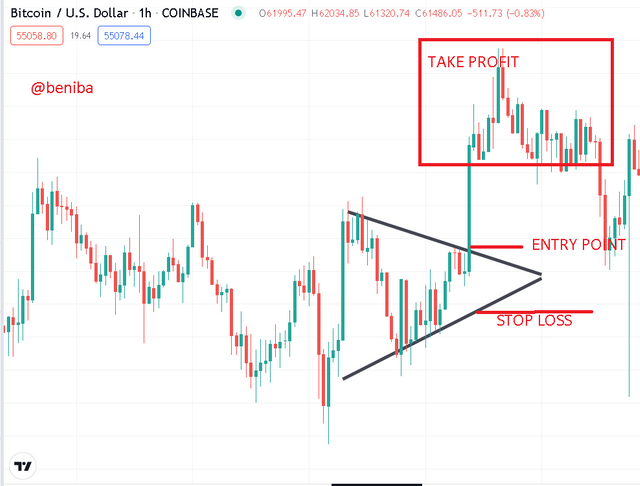
Just like the ascending triangle the symmetrical triangle also has a resistance line and a support line. Below is how I will setup my trade:
• My entry point will be the point where the price breaks the resistance line which indicates a bullish wave. In my screenshot that point is marked A
• My take profit will be at the point marked P on the screenshot which is higher than the resistance zone
• My stop loss point will be the place marked L which is place a little below the support level.
BEAR FLAG
The bear flag has a flag pole and a different pattern (triangle or wedge) itbis from these patterns that we can get resistance and support levels and plan our trade.
• The triangle or wedge pattern formed has a trend line called resistance line so the poin where the price breaks this line is where I will enter the trade.
• My take profit will be set at a place a bit higher than the resistance line.
• My stop loss will be considered at a point slight lower than the support level.
In crypto trading we use charts in technical analysis, we try to get the best out of these charts. One of the ways of using charts s your ability to identify and interpret patterns on the chart. We are guided in the decisions we make during trades. The triangle patterns and flag patterns are very good options we can use during trading. These patterns has the ability to predict trend reversals and trend continuations. This lecture was a very educative one thanks to professor @sachin08.