Ultimate oscillator indicator- Steemit Crypto Academy- S5W8-Homework post for @utsavsaxena11.
Hello wonderful people, how are you today? I hope you're having a fantastic week. I'm ecstatic to be a part of this unforgettable lecture. In this article, I'll share my experience with the Ultimate oscillator indicator

What do you understand by the ultimate oscillator indicator? How do you calculate the ultimate oscillator value for a particular candle or time frame? Give real example using chart pattern, show complete calculation with accurate result
The Ultimate Oscillator indicator measures price momentum. William Larry invented it in 1976. This price momentum indicator has been designated as such since it produces few trade entries. This is a trend-following indicator that generates fewer trade indications across all time frames.
The Ultimate Oscillator was created to eliminate trading strategies that are virtually always generated by other oscillators that do not last. The situation generates minimal trading signals and is thought to be functioning normally in the marketplace.
The indicator employs time periods of 7, 14, and 28 to illustrate the various timescales in a trending market.
How to calculate the Ultimate Oscillator
Before using any market indication, it is important to comprehend the instrument, because "neglect is not an explanation" in the market. I'll explain the process of calculating the indicator.
Formulas
We begin by presenting the ultimate oscillator indicator formula, which we then calculate using the formula below;
UO = [[((A 7 * 4) + (A 14 * 2) + (A 28)] * 100
Where;
- The ultimate indicator is represented by UO.
- A 7 is the average of the seven periods.
- 14 denotes the average of the 14 periods.
- A 28 denotes the average of the 28 periods.
Now I'm measuring the buying force and the true range;
The purchasing pressure is calculated as = current close –min (previous close or current low)
= max (prior close or current high) - min gives the true range (previous close or current low)
How to identify trends in the market using the ultimate oscillator. What is the difference between ultimate oscillator and show stochastic oscillator.
We can discover price movements by using the ultimate oscillator, which detects possible overbought and oversold situations in the market. The indicator is divided into two primary lines: the 70 level and the 30 level. Passing the 70 level indicates an overbought condition, while passing the 30 level indicates an oversold condition. I'll go over each of them in more detail following.
Uptrends with Ultimate Oscillator.
In contrast, for the Uptrend trend detection, indicator values are discovered in the oversold zone, where band values are reported to be between 30 and well below, indicating that a trend reversal to an Upwards trend is expected.
Ultimate Oscillator Downtrends
To detect a downtrend using the Ultimate Oscillator, the indicator trend should be discovered in the overbought zone, in which the market trend is noted to be in band values of 70 and above, indicating that a trend reversal in the negative direction is expected.
Difference between the ultimate indicator and the stochastic indicator
The stochastic indicator contains two oscillator lines, but the final indicator only has one.
The stochastic indicator often uses the 80 and 20 levels, whereas the ultimate indicator employs the 70 and 30 levels to signify overbought and oversold conditions.
The ultimate indicator analyses the use of three separate periods in its computation: 7, 14, and 28, whereas the stochastic indicator employs the 14 and three periods.
The ultimate indicator provides fewer indications, but they are more useful, whereas the stochastic creates numerous signals, which mostly require confluence to filter out misleading signals.
How to identify divergence in the market using ultimate oscillator, if we are unable to identify divergence easily then which indicator will help us to identify divergence in the market.
Identifying Divergence using the ultimate oscillator indicator
Divergence to the upside
Divergence to the upside
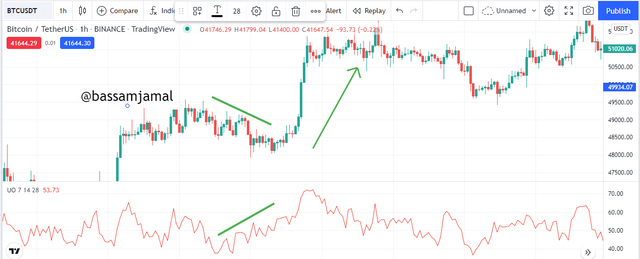
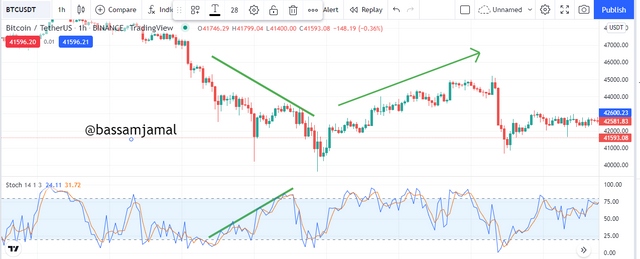
The bullish divergence with the ultimate oscillator occurs whenever the price swings with the development of lower lows whereas the indicator goes with the development of higher lows as it climbs higher. The development of lows in the values of the btc/usdt in the graph below shows a trend reversal from the current downtrend to an uptrend, whereas the indicator travels in an upswing with the construction of higher lows, indicating a trend reversal from the current downtrend to an uptrend. This is depicted below.
Divergence to the downside
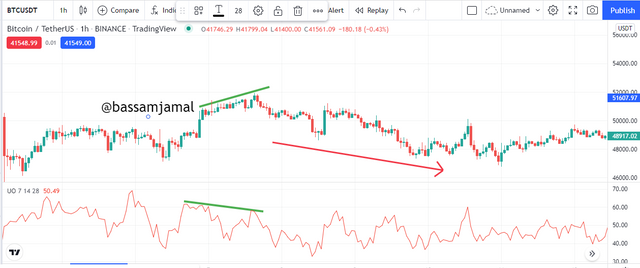
The bearish divergence with the ultimate oscillator occurs whenever the price movement is accompanied by the development of higher highs, whereas the indicator is accompanied by the construction of lower highs as it travels lower. In the chart below, we can observe the construction of higher highs in the xrp/usdt prices whereas the indicator moves in a decline with the creation of lower highs, indicating a trend direction from the present upswing to the present decline. This is depicted below.
Another signal to aid in the detection of divergence
If we can't discover a divergence in the marketplace, a better indication to utilise is the stochastic indicator or the relative strength indicator, which detects overbought and oversold regions by forming higher and lower highs.
In this respect, we may detect zones of bullish and bearish divergence, as seen in the graph beneath.
What is the 3 step approach method through which one can take entry and exit from the market. Showing real examples of entry and exit..
Market Entry Position - Buy Signal
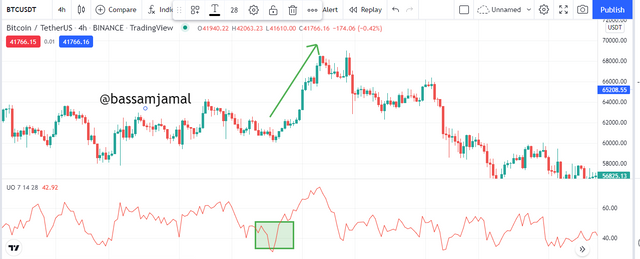
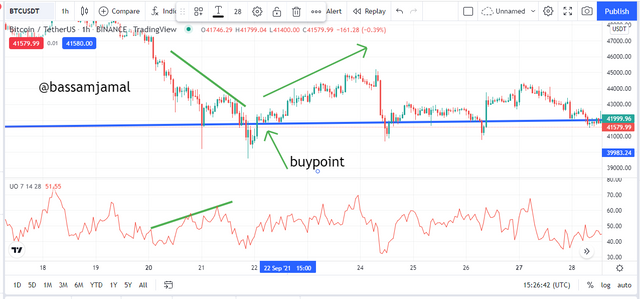
The market trend is downwards with lower-low signals, while the Ultimate Oscillator indication is in the other position with more momentum upward with a higher-high signal. In the opinion of the indicator's indications, this implies additional purchasing pressure.
Indications from the indicator must be noticed first in the oversold zone, when indicator band values are less than 30. This ensures a comeback because the market is at its low point and there is more purchasing demand than selling pressure.
Finally, to establish a legitimate bullish divergence situation, the indicator should be noticed above the divergence high, that is in the overbought area.
Exit Positioning in the Market -
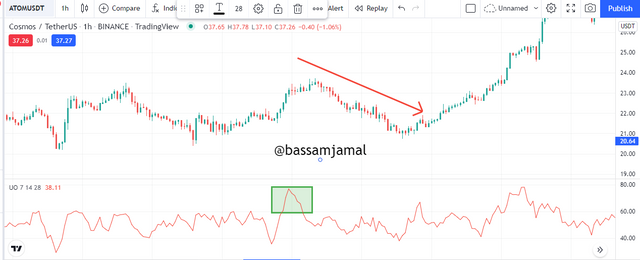
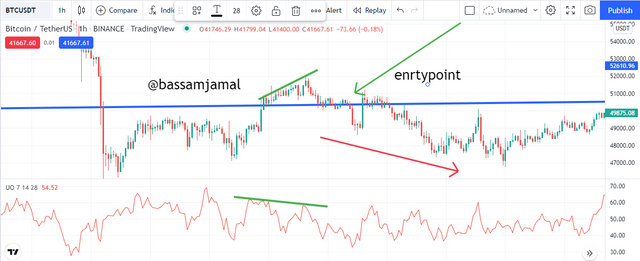
The market trend keeps rising with higher-high signals, while the Ultimate Oscillator indication is in the reverse way with more push downhill with a lower-low signal. In the opinion of the indicator's indications, this implies additional selling pressure.
Indications from the indicator should be noticed first in the overbought zone, which is defined as indicator bands values over 70. This ensures a comeback since the market has reached its high and there is much more selling push than purchasing demand.
Finally, to establish a true bearish divergence situation, the indicator should be examined low the divergence high, that is in the oversold area.
What is your opinion about ultimate oscillator indicator. Which time frame will be preferable to use ultimate oscillator and why
Given the fewer indications it generates, the Ultimate Oscillator has shown to be more trustworthy, indicating that it has a low specificity for market fluctuations. Although the Ultimate Oscillator may be utilized without any other tools, I believe it is ideal to use it in conjunction with other tactics. It assists us in determining the present market tendency. This indicator is used to determine buying and selling signals. It doesn't produce a lot of signals, which is why the majority of the signals we get from this approach are correct and have minimal fluctuation.
This oscillator is well-balanced since it always displays the markets cycle's reality, and when it doesn't, it alerts us of a potential deviation. The ultimate oscillator indication was designed to respond properly over many periods, allowing it to adapt to any trading style and timeframe. Because the lowest period, which is 7, has a strong weight, the ultimate oscillator indicator is a particularly effective instrument in short-term trading. With three separate periods encoded in its reading, it's much easier to eliminate fake and misleading signals from the results.
When it comes to the appropriate timeframe for this indication, the ultimate indicator analyses three distinct periods (7, 14, and 28 periods). As a result, most traders may select the timeframe that best suits their needs. When the fluctuation of a portfolio's assets is strong, I favor the default time frame of 7, 14, and 28. If the asset's volatility is minimal and it does not provide buy and sell signals while passing the upper 70 and lower 30 levels, the indicator's sensitivity must be increased by shortening the time period. Several trading indications may be identified in shorter periods. The combination of 7, 14, and 28 appears to have to be ideal since it strikes the right balance between all of the periods and price appearances.
Conclusion
A momentum-based indication is the ultimate indicator. The Ultimate Oscillator Indicator is a near-perfect indicator that allows traders to take more precise trading positions. Although the ultimate oscillator indicator is a highly useful tool for trading cryptos, it does have certain drawbacks. Its benefits exceed its drawbacks. It was created for a variety of objectives. It's implemented to find out what the market's current trend is.
It is available in three distinct period time frames, each of which has been shown to provide less signal in trading activities, as well as a lower affinity for market volatility and, as a result, a lower sensitivity to market forces. The ultimate oscillator is characterized by minimal volatility and a limited number of signals. This Oscillator's underlying calculation mechanism is highly balanced, since it uses three averages of distinct price periods for a specific commodity item.
The ultimate oscillator indicator is an excellent technical analysis tool for examining various market periods and finding deviations.