Trading Using Wedges Pattern - Steemit Crypto Academy - S5W5 - Homework Post for @sachin08
Hello wonderful people, how are you today? I hope you're having a fantastic week. I'm ecstatic to be a part of this unforgettable lecture. In this article, I'll share my experience with Trading Using Wedges Pattern


1. Explain Wedge Pattern in your own word.
When it comes to trading, there are numerous patterns to consider. The Wedge pattern is one of the patterns we'll be talking about currently. When we speak of a Wedge in investing, we are talking to a trend or price structure that is represented by two trend-line lines, one at the top working as opposition and the other at the bottom functioning as support. The pattern is defined by the convergence of these two trendlines at the end.
A wedge pattern is a triangular design having a broad base and a small or tiny edge. This indicates that a wedge pattern is a pricing trend that begins wide and then narrows over time to concentrate at a point. Wedge patterns suggest a price movement that is delayed or paused in one way. On a graph, it's commonly shown as a concentration of trendlines.
The top and the bottom trendlines of a wedge pattern. Active resistance is on the higher trendline, and lively support is on the lower trendline. The market in a wedge pattern continues to strike both active resistance and support trendlines till it breaks through.
The wedge pattern can appear to indicate pattern persistence or reversing. Whenever it appears at the finish of a recent trend, it denotes a trend reversal; however, when it appears in the center of a trend, this always implies that the trend will continue. Rising wedge and falling wedge are indeed the two forms of wedge patterns.
2. Explain both types of Wedges and How to identify them in detail. (Screenshots required)
Rising Wedge.
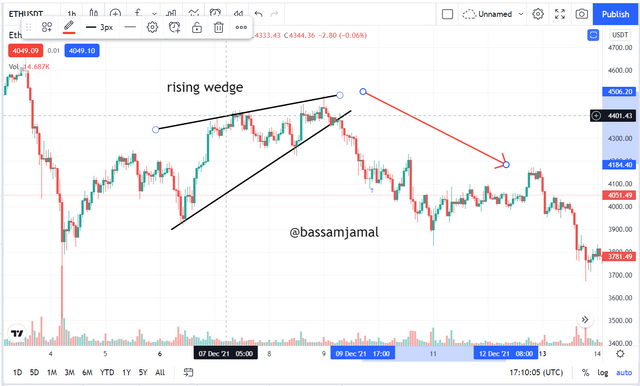
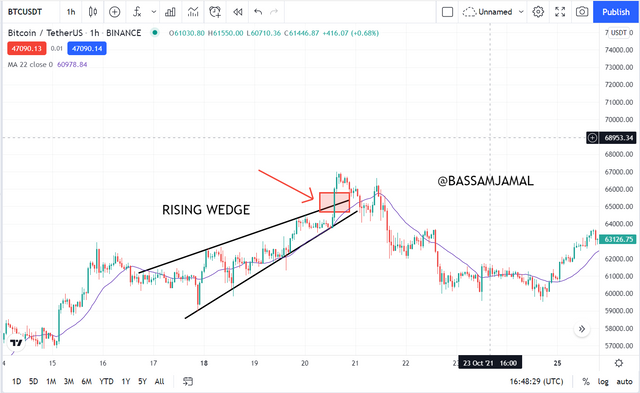
The rising wedge, also known as the negative version of the wedge pattern, is a sort of wedge with an upswing in the price chart that continues until the asset's price breaks out. Whenever this breakout occurs, the trend will revert to its previous direction of motion, i.e., the market will shift from an upswing to a downturn.
Typically, two trendlines are employed in any wedge, as mentioned above, and these two trendlines must converge at the conclusion of the price. A breakthrough is also observed to initiate the trend direction. Let's have a look at the image below and observe whether the rising wedge appears.
falling Wedge.
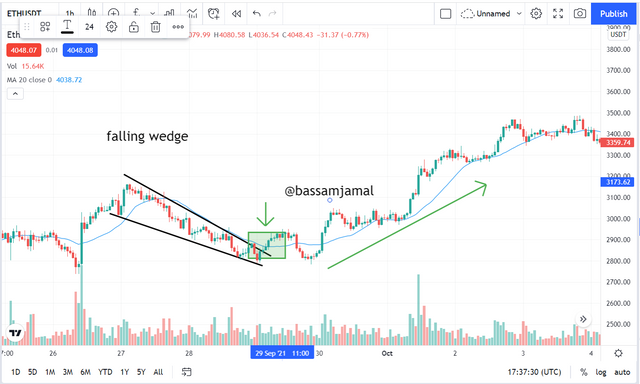
The falling wedge, also known as the bullish variant of the wedge pattern, is a sort of wedge with a decline in the price movement that continues until the entity's price breaks through. Whenever this breakthrough occurs, the pattern will revert to its previous direction of motion, in other words, the market will shift from decline to upwards.
Typically, two trendlines are employed in any wedge, as mentioned above, and these two trendlines must coincide at the conclusion of the price. A breakthrough can also be seen to initiate the trend reversal. Let's have a look at the image below and see how the collapsing wedge appears.
How to Identify Rising Wedge Pattern.
To begin, two trend lines must be formed on the price graph; one will be placed just above the market as resistance, while another is placed underneath the price as support.
At least 2 or 3 points should be reached by the trendline depicted on the graph. It might be three on the upside and two on the downside or vice versa. In the price chart, this contact of the trendline can be greater than 5
Make certain that whenever this wedge forms, the market volume is in order of diminishing, i.e. downward movement.
How to Identify Falling Wedge Pattern
To begin, two lines must be created on the price graph, one just above price and another underneath the price, functioning as resistance and support, respectively.
At least 5 points must be crossed by the trendline depicted on the graph. In other words, it may be three on the upside and two on the deficit side, or the other way around.
Make sure whenever this wedge is established, the price volumes are dropping, i.e. moving down.
3. Do the breakout of these Wedge Patterns produce False Signals sometimes? If yes, then Explain how to filter out these False signals.
Price movements aren't always reliable. They frequently produce erroneous indications. The response is affirmative in the instance of the Wedge pattern. The breakup of these patterns can occasionally result in a false signal. We'll use indicators to filter out the erroneous signal that this pattern generates.
Every skilled trader who wants to make money considers the use of two or even more indicators in conjunction with the terms of trade in order to minimize loss and maximize profit. This implies that the more indicators you add to your trade, the lower your risk will be because they will assist you in tracing out all of the false signals in the transaction at the moment. Take a look at the graph below. To get a more reliable outcome, we'll use an indicator in conjunction with the wedge pattern.
True Breakout.
False Breakout
We used the 20 MA indication to our price graph in the chart above, and as you can see, the indicator assists us to determine whenever the market is still bull and when it is bad. As we've seen, whenever the entity's price breaks out, the indicator accepts it and displays it as a cross-over between the MA and the candles. If we see different things in pricing and other things in the indicator, we understand the trend is fragile and therefore we should be cautious when making decisions at that time.
4. Show full trade setup using this pattern for both types of Wedges. ( Entry Point, Take Profit, Stop Loss, Breakout)
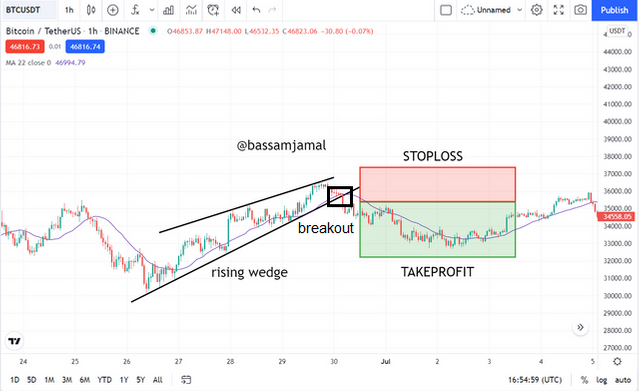
Trade Setup for Rising Wedge
The form of trade we should put up in this kind of wedge is a short entry trade since the following thing that's happening after the breakthrough in this type of wedge is a reversion in the pattern motion. This reversion will always be in the negative direction, indicating that traders have complete control of the market. Take a look at the graph below.
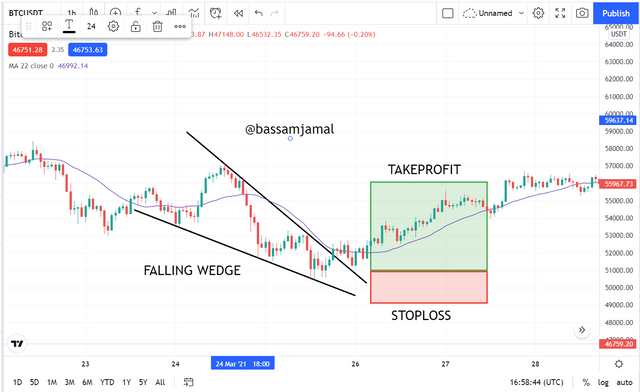
Trade Setup for Falling Wedge
The form of trade we should put up in this kind of wedge is a long entry strategy since the next thing that's happening just after a breakthrough in this sort of wedge is a turnaround in the trends motion. This reversion usually occurs an upwards manner, indicating that purchasers have complete command of the market. Take a look at the graph below.
Conclusion.
The Wedge Pattern is an excellent trading strategy. It is defined by the intersection of two trendlines, one of which is located at the top of the cost and works as resistance, and another of which would be located underneath the price and acts as support. The pattern is qualified when the two lines at the end are about to join.
The falling wedge pattern and the rising wedge pattern are the two basic forms of wedge patterns. As we've observed, the trend isn't totally trustworthy for investing except when it's combined with additional indicators like the RSI, MA, MACD, and so on.