Trading Crypto with Keltner Channels - Crypto Academy / S5W6 - Homework Post for @fredquantum
Hello wonderful people, how are you today? I hope you're having a fantastic week. I'm ecstatic to be a part of this unforgettable lecture. In this article, I'll share my experience with Trading Crypto with Keltner Channels


1. Creatively discuss Keltner Channels in your own words.
Chester Keltner invented Keltner Channels in the 1960s, while Linda Bradford Raschke improved the indicators in the late 1970s. That's the edition of the indication that is currently in operation.
Keltner Channels are indeed a combo of the exponential moving average and the average true range
The moving average is a value that has been averaged across a number of periods. More current prices are given a higher significance by the exponential variability, whereas older prices are given a lower value.
The Keltner Channels operation is identical to the Bollinger bands in appearance and operation. The enlargement and constriction of the Keltner Channels bands are affected by market instability, much like the Bollinger bands. Narrow bands and a sideways motion of the indicator would indicate a much less volatile market. Larger bands and the upward or negative swing of the indicator based on the trending line would indicate a more volatile market.
2. Setup Keltner Channels on a Crypto chart using any preferred charting platform. Explain its settings. (Screenshots required).
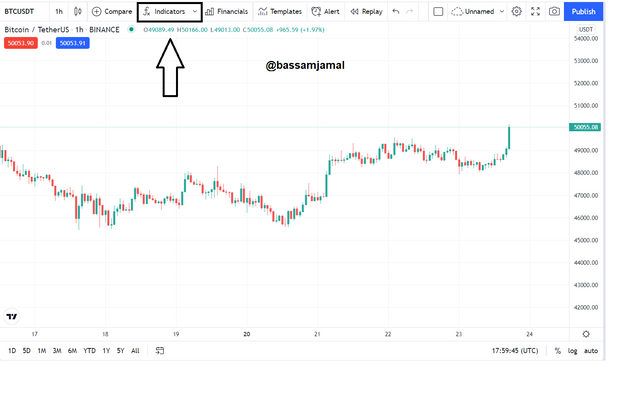
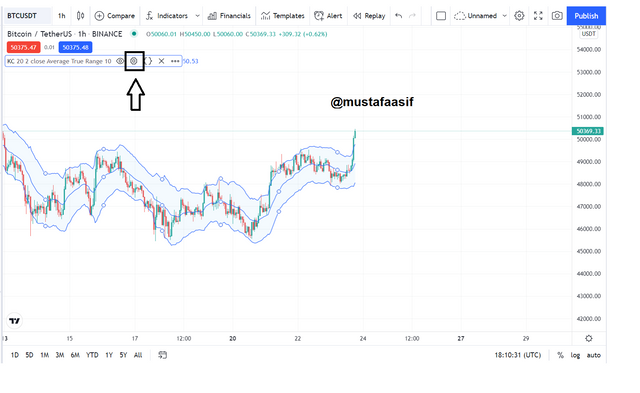
- Pick a selected chart in TradingView and select fx indicator.
- Find Keltner and select the indicator.
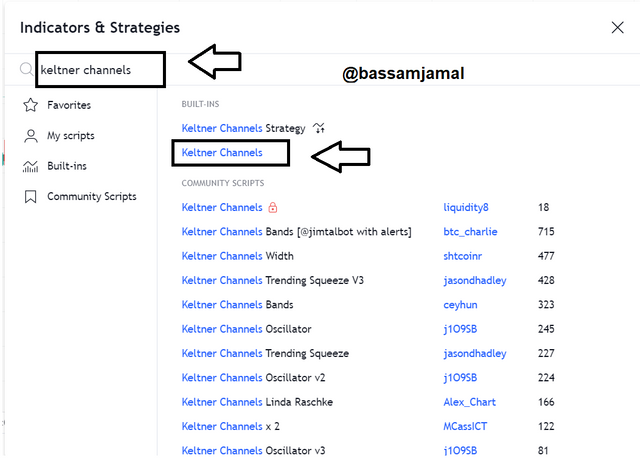
- That's all there is to it! The indication appears.
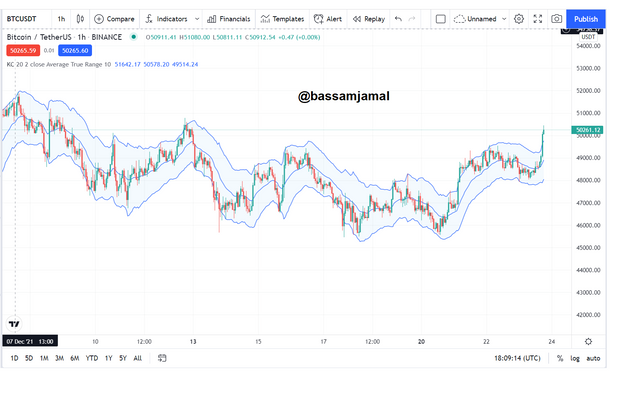
- Click on the respective settings symbol to see the options.
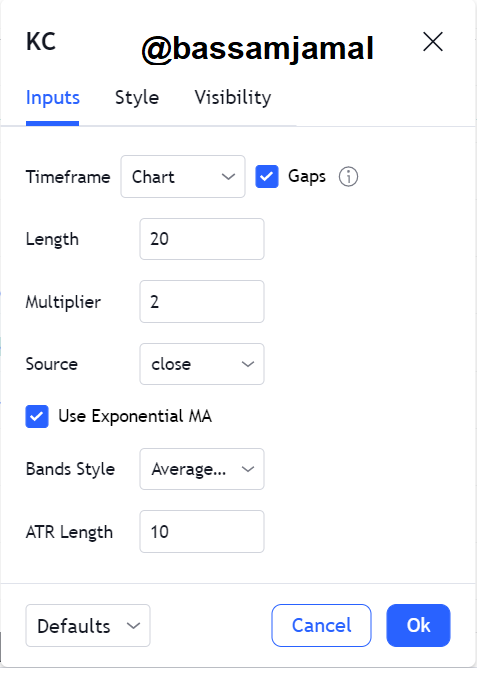
- The Keltner channel indicator has a standard period of 20, a multiplier of 2, and an ATR length of 10 on the displayed inputs menu. The indicator period parameters can be modified to match the investor's trade policy and approach.
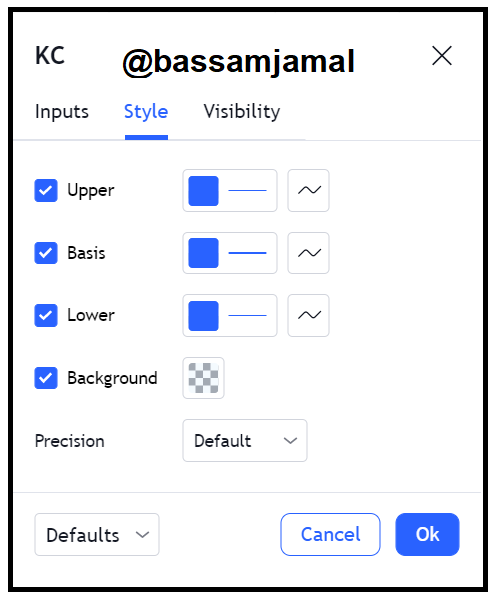
- The Keltner channel indicator curve color, width, and accuracy for the upper boundaries, lower boundaries, and EMA can be adjusted on the Style page to meet the treader's preferred criteria.
- The Keltner channel indicator has a standard period monitoring of 20, a multiplier of 2, and an ATR value of 10, although the ideal configuration is determined by the trading and commodity exchanged. Shorter indicator durations are used by short-term traders, whereas higher indicator values are used by long-term traders.
3. How are Keltner Channels calculated? Give an illustrative example.
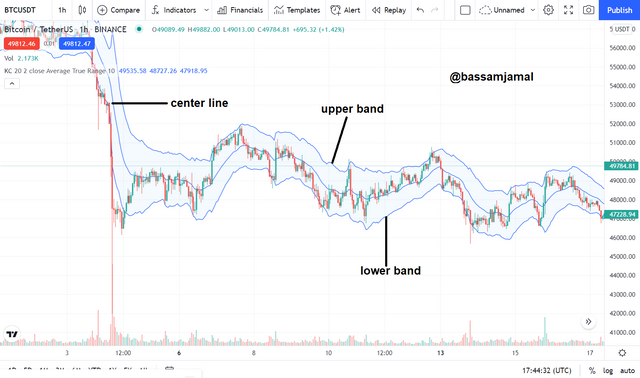
A centerline and two bands along each make up the Keltner channels. By definition, the centerline is an exponential moving average of the price activity.
The bands are computed by calculating the price's average true range (ATR) for a certain period (10 by default), multiplying it by a factor (2 by default), and then subtracting or deducting it from the centerline for the top and bottom bands, respectively. This is pretty simple actually and can be represented using graphs. I'll go into further detail below.
The ATR, like other averages, is displayed on graphs as an indication. We can quickly add the indicator to the graph and observe how its variables influence the Keltner Channels bands.
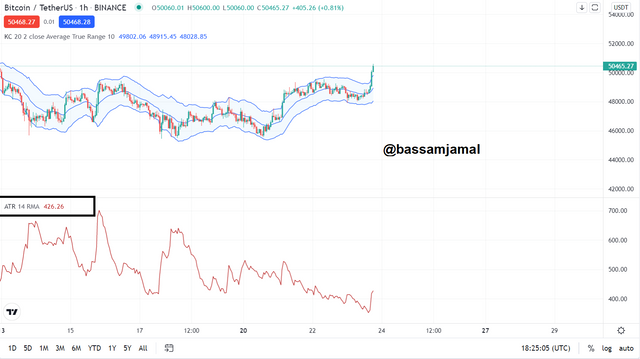
A chart using Keltner Channels and ATR is shown in the image above. This is an effort to show how the ATR is used to determine the Keltner Channel Bands. To accomplish so, we must adjust the ATR's duration from the default of 14 to 10 periods, which corresponds to the Keltner Channels' parameters. This is how I accomplished it.
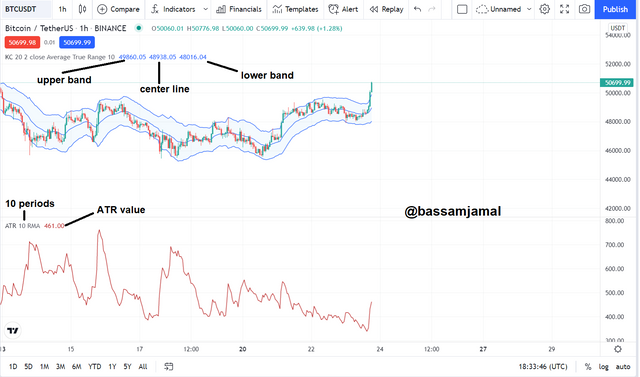
On a 10 -day timeframe, the ATR has a number of 461. The first figure is the value of the upper band, the second is the number of the centerline, and the third is the value of the bottom band for the Keltner Channels. The price's EMA is already used to calculate the centerline. Now we'll use the method to compute the upper and lower bands to see if the results match.
- Center line = 48938
Upper Band = EMA + (2 x ATR)
= 48938 + (2 x 461)
= 48938+ 922
= 49860 (the same as the value on the chart)
- Lower Band = EMA - (2 x ATR)
= 48938 - (2 x 461)
= 48938 - 922
= 48016 (the same as the value on the chart)
4. What's your understanding of Trend confirmation with Keltner Channels in either trend? What does sideways market movement looks like on the Keltner Channels? What should one lookout for when combining 200MA with Keltner Channel? Combine a 200MA or any other indicator of choice to validate the trend. (Separate screenshots required)
The Keltner Channels can be used to quickly detect and validate a trend's path. This is simply accomplished by examining the indicator's angle. I'll go over the two possibilities in more detail below.
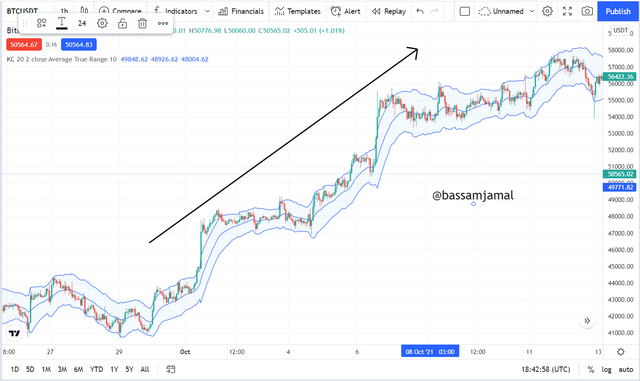
Uptrend
The Keltner channels could form and travel at an upward angle during an upswing. The value of the asset should rise, with the majority of the price movements taking place here between the upper band and the centerline. The upper band could operate as a price barrier in this situation, while the centerline will act as price support.
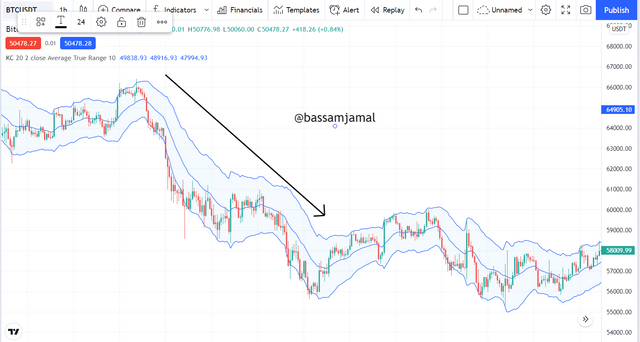
Downtrend
The Keltner channels would form and travel at a low angle during a downturn. The price should start moving in this situation, with the majority of the price action taking place between the lower band and the centerline. The bottom band would operate as a support line in a downturn, while the centerline will act as resistance.
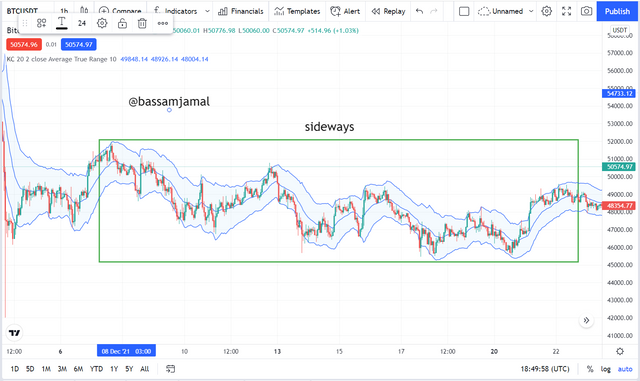
Keltner Channels have a sideways market.
Any marketplace that is not growing is referred to as a sideways market. That is, the currency pair does not move in an upswing or downturn, but rather within a much less unstable price point. Low volatility characterizes this sector, which can be seen plainly on the Keltner Channels.
What to look out for when combining 200 MA with Keltner Channels
A 200-period Moving Average can be utilized to corroborate a Keltner Channels-identified trend. The placement of the 200 MA with relation to the Keltner Channels achieves this.
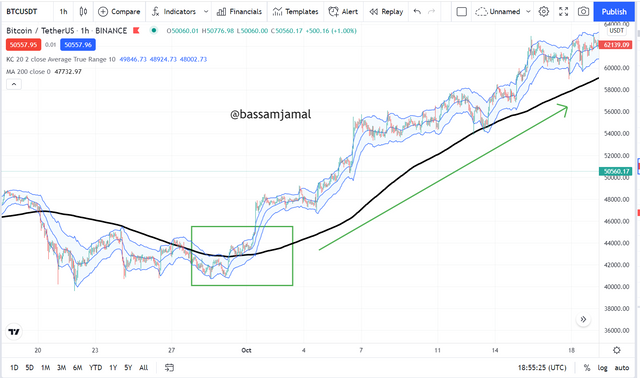
Bullish Trend
The 200 MA would go upward below the Keltner channels in a bullish trend. This is readily seen in the image below.
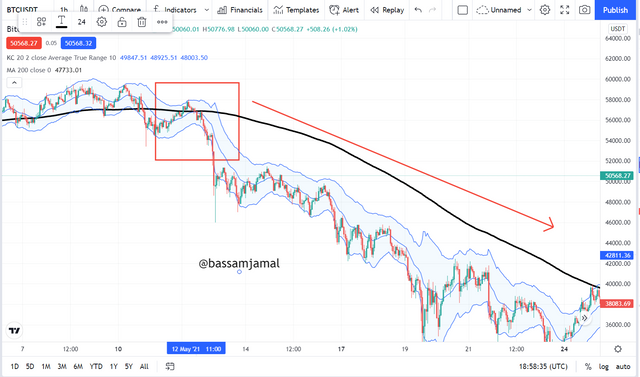
Bearish Trend.
The 200 MA would go downwards above the Keltner channels in a bear market. In the photograph below, we can plainly observe this motion.
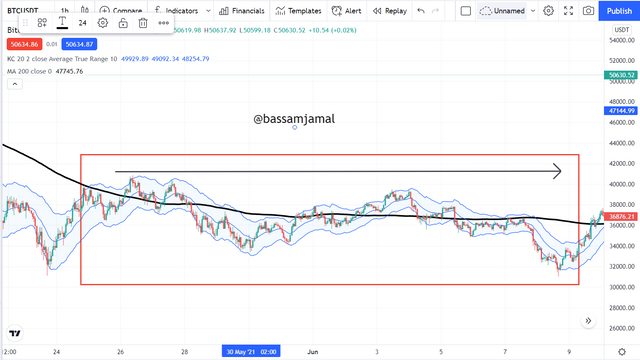
Consolidating or Sideways market
The 200 MA would shift horizontally within the Keltner channels in a consolidation marketplace. In the picture below, I've emphasised this.
5. What are Dynamic support and resistance? Show clear dynamic support and resistance with Keltner Channels on separate charts. (Screenshots required).
We're all familiar with the terms "support" and "resistance." Support and resistance are parallel areas from which prices rebound, as we all know. Support is a pricepoint from which price is predicted to rise, and resistance is a price level from which price is predicted to break. As these are horizontal levels established at a specific price point or position, we might call them stable support and resistance levels.
We've seen that various lines of the Keltner channel indicator work as support and resistance in multiple markets using the Keltner channel indicator. In an extending market, the higher band operates as resistance and the lower band works as support, as we can see from the two different lines - upper and lower band. Because these lines do not appear at set or specific price levels, they continue to move, however modestly and are referred to as dynamic support (lower band) and resistance (upper band).
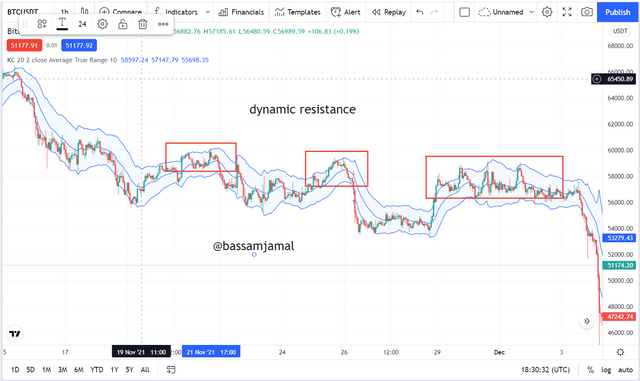
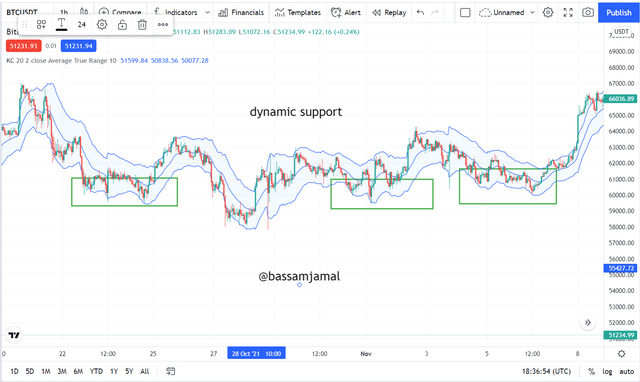
Dynamic support and resistance can be seen on the BTC/USDT graph. Dynamic resistance is provided by the upper band, while dynamic support is provided by the lower band.
6. What's your understanding of price breakouts in the Crypto ecosystem? Discuss breakouts with Keltner Channels towards different directions. (Screenshots required).
The Keltner channel indicator is also used to detect and evaluate breakthroughs. We understand that when a breakout occurs, it signifies that fluctuation has kicked in. This implies that there had to be significant instability in the value of the asset in order for it to break out and advance to something like the resistance or support zone. The Keltner indicator usually verifies this breakthrough because it is observed heading in the right direction as the breakout.
Keltner Channel Bullish breakout
Breakout of a resistance level indicates that the market is likely to persist upward. As I previously stated, a breakthrough in an upward trend between the EMA line and the upper band indicates that buyers have complete control of the commodity at that time. A bullish breakout has occurred. The Keltner indicator usually confirms this because price breaks and closes above the upper limit.
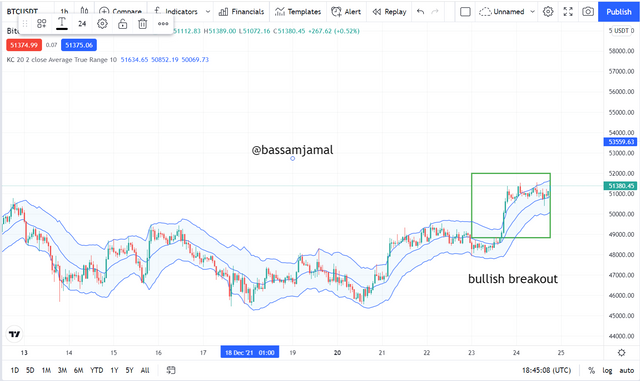
We can observe how the market breached and afterwards finished above the upper band in the image above. The EMA line acted as a support in this case, while the upper band line acted as resistance. The keltner flows in the same way as the price movements, indicating that the breakout indication has been confirmed.
Bearish breakthrough in the Keltner Channel
Breakout of a support level indicates that the trend is likely to persist downward. As I previously stated, a negative breakthrough between both the EMA line and the lower band indicates that sellers have complete control of the asset at that time. A bearish breakout has occurred. The Keltner indicator usually confirms this because price breaks and closes above the lower band.
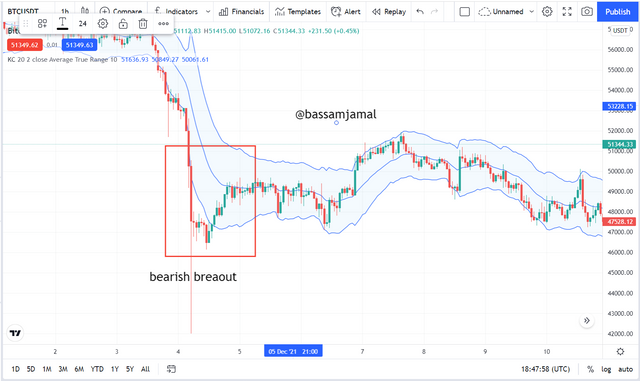
One can observe that the price broke and afterward settled below the lower band in the picture above. The EMA line acted as resistance in this case, while the lower band line acted as support. The Keltner flows in an identical way as the price movements, indicating that the breakout signal has been confirmed.
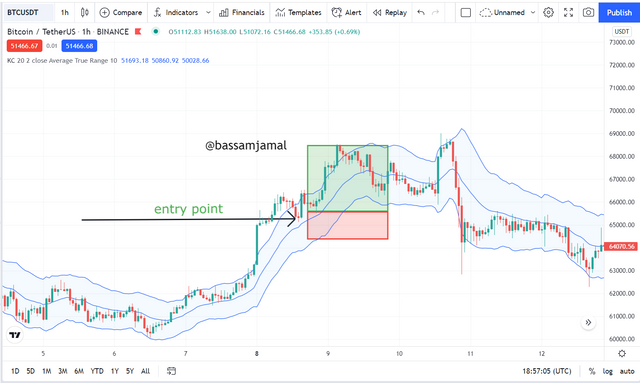
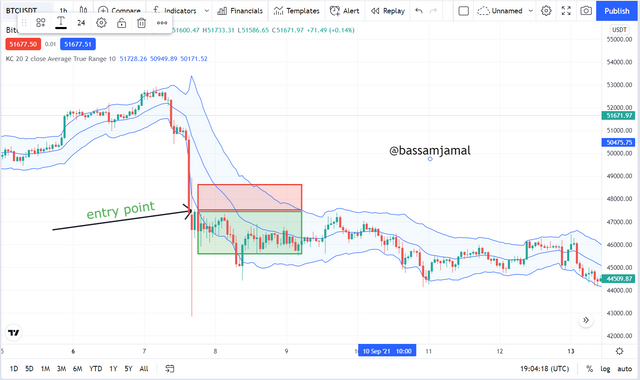
7. What are the rules for trading breakouts with Keltner Channels? And show valid charts that work in line with the rules. (Screenshot required).
Able to trade breakouts utilizing Keltner channels has a fairly basic system of regulations. First and foremost, we must determine the location of the breakout. It implies resistance has indeed been eliminated if it goes just above the upper channel. Similarly, we might claim that support has indeed been shattered if it breaks below the lower band.
Keltner channel trading rules for bullish breakouts
To begin, ensure that the investment's price action is visible between both the EMA (Middle line) and the top band. Watch where the price goes and moves near to the upper band at this moment.
Permit the market to decline and then go in a downward manner after that.
Keltner channel regulations for trading bearish breakouts
To begin, ensure that the investment's price action is visible between the EMA (Middle line) and the bottom band. Watch about where the price drops and moves closer to the lower band at this moment.
Wait for the price to recede after that and climb higher.
The market is projected to move higher, and the EMA will operate as a price resistance once it is shown throughout the middle range. Let the price move below 2 or 3 candles after that has been noticed, and then initiate a short entry in that position.
8. Compare and Contrast Keltner Channels with Bollinger Bands. State distinctive differences.
The Keltner channels and the Bollinger band indicator have a lot of similarities. The reality that they each have three bands, the top, middle, and lower band, is one of the similarities. In addition, since of their commonly described, it's difficult to tell whether the indicator is on the graph when both are visible in a chart.
These indicators are volatility-based indicators that are used to determine the direction of the market of an asset's value. Both indicators use similar methods to determine the price trend direction of an asset. Take a look at the screenshots of both indicators in action on the graph beneath.
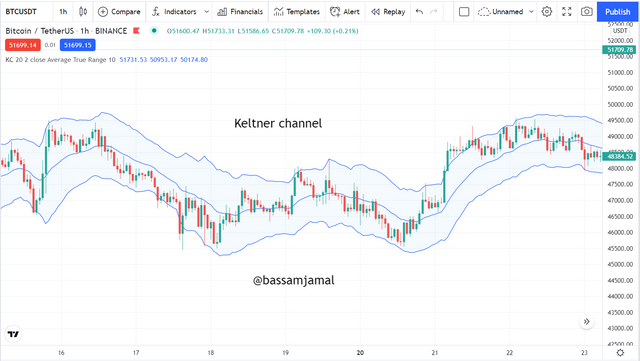
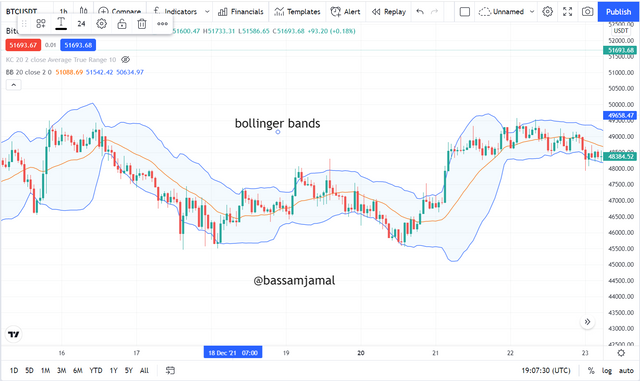
It's practically hard to tell the difference between the two indicators by just glancing at them on a chart, as shown in the images above. As we can see from the graph, they all seem the same. Now that we've seen how similar the two indicators are, let's take a closer look at the differences between them.
The upper and lower bands of the Bollinger band indicator are calculated using the price standard deviation, while the upper and lower bands of the Keltner channel indicator are calculated using the ATR.
One distinction between the two indicators is that the Bollinger band is usually used to indicate a strong trend, whilst the Keltner channel has always been used to indicate a slow trend.
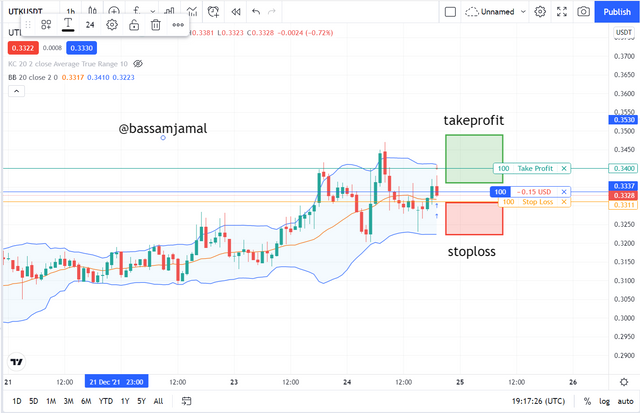
9. Place at least 4 trades (2 for sell position and 2 for buy position) using breakouts with Keltner Channels with proper trade management. Note: Use a Demo account for the purpose and it must be recent trade. (Screenshots required).
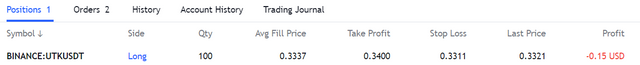
- Trade 1: This is a buy entry for the UTKUSDT pair, with a time of 1 hour The entrance point was taken quickly above the EMA line in the picture below, indicating that it is a bullish sector with a long entry authorized within that position.
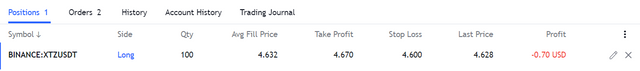
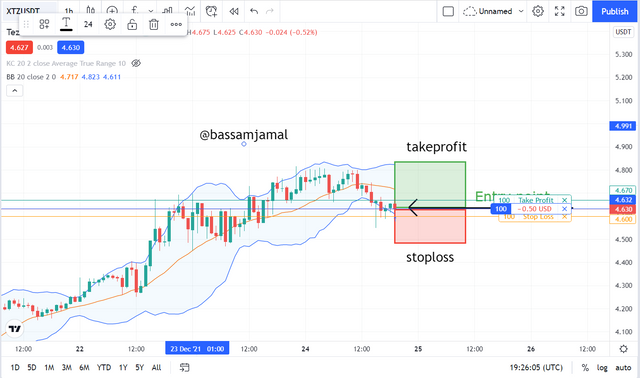
- Trade 2: This is a buy entrance for the XTZUSDT pair, which has been placed on the 1 hour period. The point of entry was picked right after the 2nd bearish candle above the EMA line in the picture below, indicating it is a bullish sector with a long entry permitted within that position.
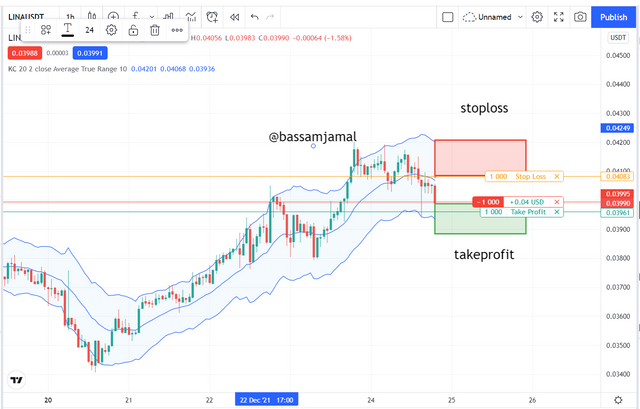
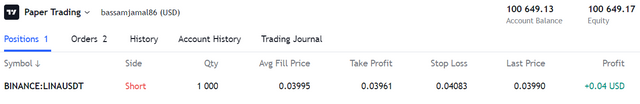
- This is a trading entry for the LINAUSDT pair that was executed during the 1-hour timeframe. The point of entry was taken immediately below the EMA line in the picture beneath, indicating that it is a bearish sector where a sell entrance is permitted.
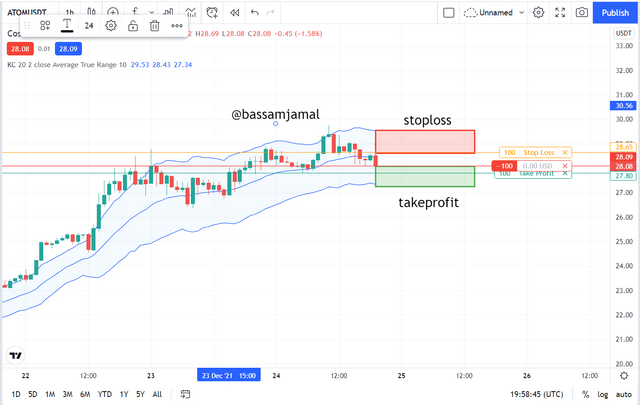
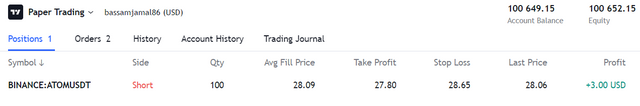
- Trade 2: This is a trading entry for the ATOMUSDT pair that was executed for a 1-hour timeframe. The entry point was picked after two bearish candles exactly below the EMA line, indicating that it is a bearish sector with a short entry possible at that point, as shown in the picture beneath.
10. What are the advantages and disadvantages of Keltner Channels?
Advantages .
The indicator is a volatility indicator, which implies it is excellent at predicting price fluctuations.
When a buyer detects a breakthrough in either the bottom or higher band, it's a clear sign that he or she should enter trading.
The indicator is straightforward to read and comprehend. This indicates that the Keltner channel indication can be used by even those who aren't very knowledgeable with indicators.
While using the Keltner channel, trend verification is simple. Its because we consider price to be bullish if it is located between both the middle and higher bands, but negative if it is located between the middle and lower bands.
Disadvantages
The indicator can show a false signal because it is not 100percent reliable. As a result, it must be combined with other indicators in order to be filtered.
There's a chance of a delayed pattern confirming. As a result, traders will miss out on possibilities to join the market at the proper time.
The Keltner indicator produces conflicting viewpoints in different timeframes on charts.
Consluison.
The Keltner indicator is a technical analysis tool with a fluctuating premise. This indicates it's a metric for determining the price fluctuations of a certain item. The indicator, among many other things, aids traders in determining the direction of the market, acting as support and resistance, and allowing them to initiate or exit trades at the appropriate time.
Because no indication is 100 percent effective when used individually, it is typically advised that indicators be used in conjunction with other technical analysis tools in order to generate a more accurate signal. There is no difference in the instance of the Keltner channel indication. When combined with the 200MA or any other indication, the indicator performs better.