Support and Resistance Breakouts - Steemit Crypto Academy |S6W3| - Homework Post for Professor @pelon53
Hello wonderful people, how are you today? I hope you're having a fantastic week. I'm ecstatic to be a part of this unforgettable lecture. In this article, I'll share my experience with Support and Resistance Breakouts.


Advantages of Locating Support and Resistance on a Chart
Technical analysis is without a question the most essential type of analysis offered to trade nowadays in order to comprehend the market. The support and resistance lines on the graph are some of the most essential technical analysis tools. These are critical levels that every investor watches for it before executing a trading choice. Before making any trading decisions in the market, a trader must first comprehend how the price is behaving at the support and resistance levels.
Support and resistance are important levels on the chart where there is a lot of buying and selling activity. At this time, the marketplace is taking a breather in order to build momentum for the following phase of price movements. Price response at support and resistance levels is driven by price market forces.
Support and resistance levels are significant because they assist investors in determining future price reversals and continuations in the market. Price rejection at support and resistance levels acts as market turnaround markers. Furthermore, the breach of support and resistance levels acts as a continuance of the initial movement.
Breakout of Support and Resistance
The idea behind support and resistance is that market will revert upward when it reaches a support level, and vice versa when it reaches a resistance level, although that isn't always the situation. When prices reach this level, what may occur is determined by the market's purchasing and selling desire. If there is still purchasing activity at a resistance level, a breakthrough is expected for the positive trend to continue. Likewise, if there will still be selling demand at a support level, the price bursts out underneath the resistance level, indicating that the downturn will continue.
Breakout of a Resistance
The markets consider the resistance to be a region of considerable selling demand. Purchase orders are typically completed at the resistance, creating selling momentum in the market and causing the prices to drop. In certain circumstances, there is a huge requirement for market price, causing the price to burst through the resistance level. The breakthrough of price above the resistance level suggests strong buyer enthusiasm to continue pushing the price upward.
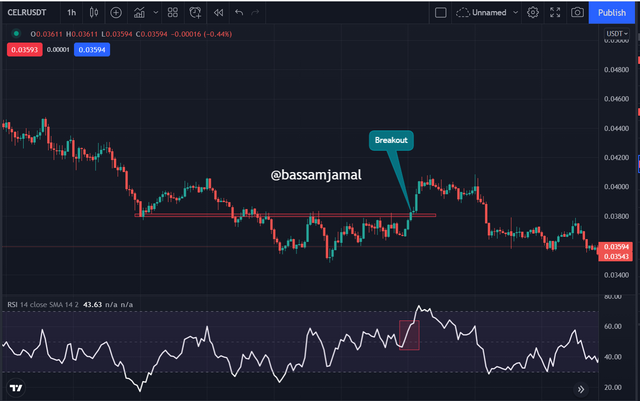
In the chart above, I have added the **RSI as a filter to the breakout. as RSI crossed the 50 middle point we can confirm the breakout
Support Breakout
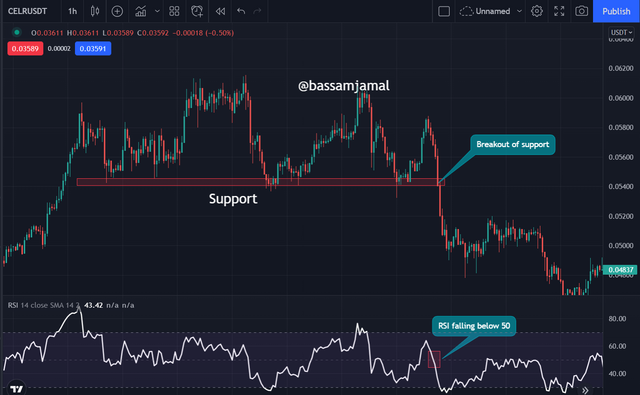
The market's support point acts as a level of considerable purchasing demand. Dealers typically book gains on-sell positions in order to hunt for purchase chances. Pricing is usually rebound at the support line, however, this is not always the case. During periods of intense selling momentum, the price may burst through the support level, allowing the bearish trend to extend. The chart below shows an example of a support breakthrough.
False Breakout and How it can be Avoided
In the marketplace, we occasionally see price break through a point. Price reverses again into the zone following the breakthrough candlestick. This is known as a fake breakout, and it is commonly used by large players to generate liquidity for their positions. As a result, a trader must be cautious and refrain from entering the market soon after a breakthrough.
False breakouts are disastrous and can result in massive financial losses. As a result, adequate validation is essential to establish the validity of a breakout. Though it is impossible to predict the market's movement when it reaches support and resistance levels. You have no way of knowing if the price will be rejected or if a breakthrough would happen. This is why support and resistance levels are employed in the marketplace as profit-taking targets.
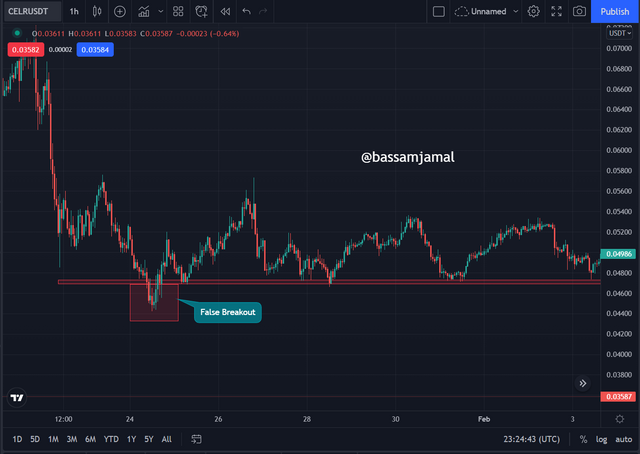
We can see an instance of a fake breakout on CELRUSDT in the graph above. Price broke through a support level, which has now transformed into a resistance level. After a little period, the price broke above the resistance, indicating a possible uptrend. It proved out to be a deception, trapping the short positioners.
Avoiding False Breakout
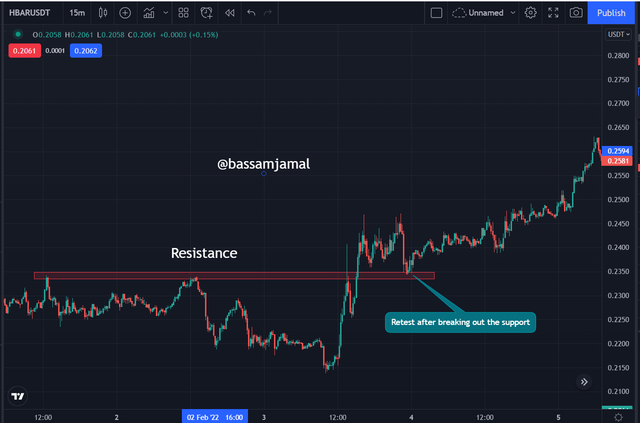
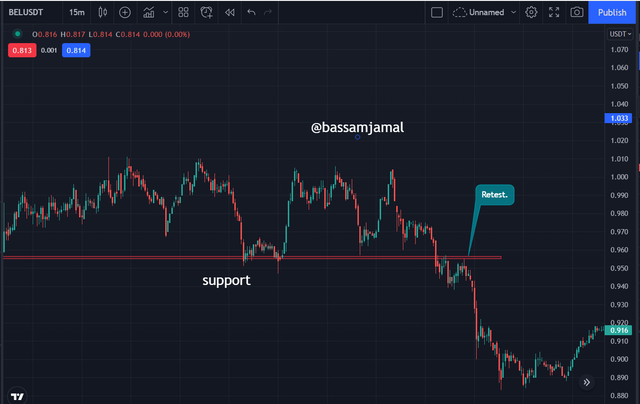
To prevent caught up in fake breakouts, wait for a breakout and then retest the breached mark. When a level is breached, the price returns to retest it before reverting back to the position of the breakout. This proves the existence of a breakout.
Whenever prices cross above a resistance level, it returns to test this level, which has now transformed into support, in order to continue the bullish momentum. Whenever price comes again after retesting the broken resistance with a bullish candlestick pattern such as bullish engulfing or the hammer, this is an entry. An example is shown below.
When price falls under a support level, it returns to test the level, which has now become resistance, in order to continue the negative motion. When prices swing around to test the broken support, which has now become resistance, a bearish candle formation might signal an entry. An instance is provided below.
Demo Trade Using Break of Resistance and Support
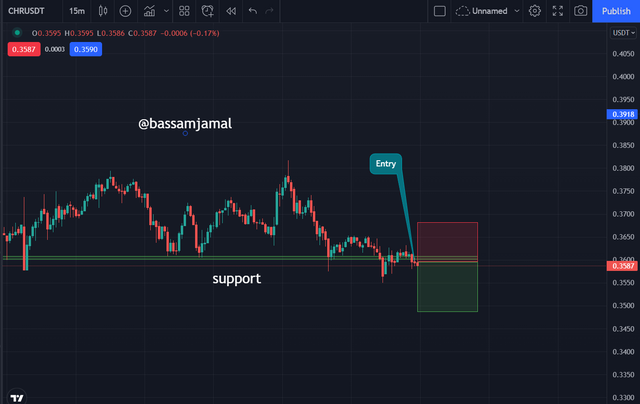
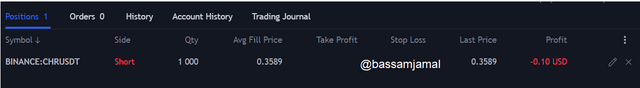
Sell Trade.
When I looked into CHR/USD, I noted that the price had broken through a support level. After the price flipped back downwards, I initiated a sell trade with a stop loss above the broken support and a take profit below my entry. The trade's specifics are depicted in the screenshot below.
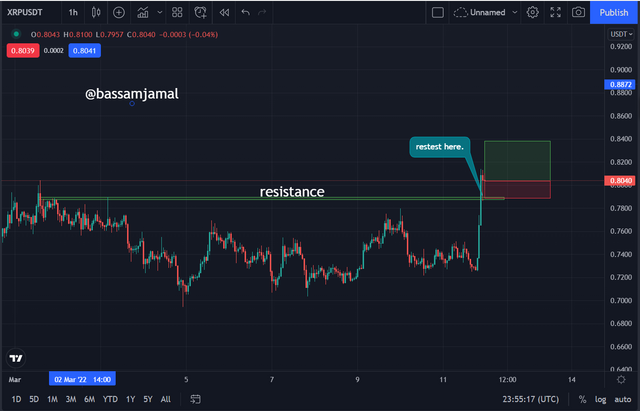
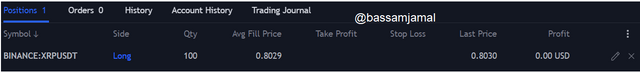
Buy Trade.
On the XRPUSDT chart below, I noted that price has repeatedly tested a resistance level. Typically, this is a hint that prices will break through this resistance and continue to rise. After a while, the price broke through the barrier and re - tested it, forming support. It is now proven that the breakout is not a fake breakout. Before starting a buy position, I watched for the price to retrace back up.
Conclusion.
We've spoken about support and resistance breakouts in the marketplace. Each investor searches for support and resistance areas on the chart before making a decision on whether to buy or sell. As several studies have shown, pricing is not always disregarded at these ranges.
The breakout might be tough for investors to identify sometimes. Many breakouts are fake, causing traders to become caught in the trade. A retest of this level is necessary before a trader may seek an entrance.