Steemit Crypto Academy | Season 5: Week: 8 | Homework post of @reddileep || Advanced Technical Analysis Using Fractals by @bassamjamal
Greetings, to all Steemit Members:
I hope you are fit and fine and enjoying your life full of fun. yet, again this is week 8 of season 5 in Steemit crypto academy. A warm welcome to all of you guys in my post. so, let's move it to the topic:


1. Define Fractals in your own words.
From so, far we have studied multiple chart patterns. like a candlestick, Heiken Ashi, head and shoulder, etc. some of these are the patterns and some are the indicators. with the help of these patterns and indicators, we can identify the trend and reversals in the market means what type of trend is going on. either it is Bullish or Bearish. so, today, in this post we have learned about the Fractals patterns.
Fractal is used to examine the market in terms of technical analysis. Fractal patterns are referred to the recurring pattern in a large number of price movements. it composed of five bars that identify the trend and reversal of token or coin. this pattern if consists of mathematical operations.
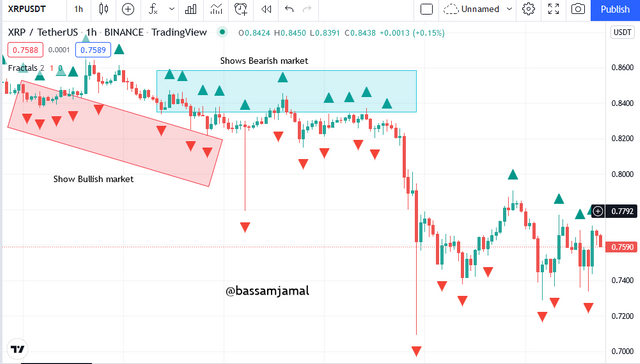
Fractals indicator is very handy to understand the trend and reversals in the market. Fractals indicator shows the pattern of tokens. in a later question, we have to discuss the Fractals in the Bullish or Bearish scenario. now, I will explain a bit about the Bullish and Bearish market. in a bullish market, Fractals shows in a bottom arrow, or in a Bearish market, the Fractals shows in the up arrow.
Fractals in very helpful when we trade the reason that is it identifies the Trends correctly, and sometimes the trend generates fake signals so, we can easily identify with the help of this indicator.
2. Explain major rules for identifying fractals. (Screenshots required).
As we all know that every indicator and every chart pattern must be tell us the trend whether it is in a Bull run or Bear run. the same scenario is applied over here. but the criteria are a bit different because of some validations. so, if we find the Fractals in the Bull or Bear run. we must have seen the five candlesticks. as I mentioned above that this indicator is very handy if we want success in our trading and taking profit from it. so, we can see the fractals of more than five candles not less or not more. so, let's understand the scenario in Bull or Bear run:

For Bullish:
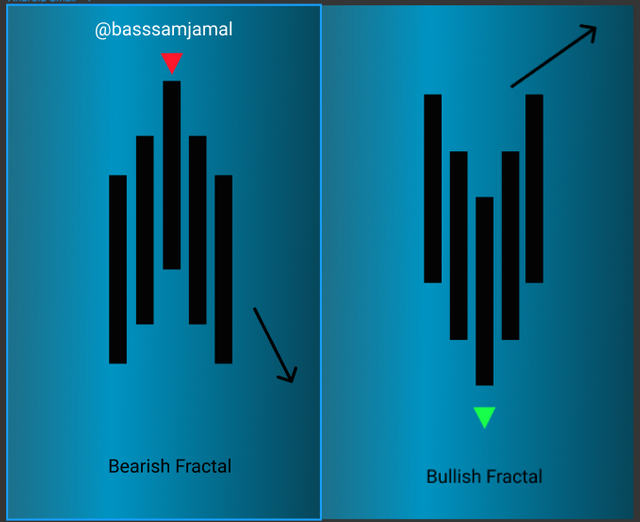
In the bullish scenario, a point that turns the direction is the lowest low in the midline of two higher lows on both sides. see in the screenshot which is shown below in this picture you have clearly seen that the bullish run starts according to the Bullish Fractals. let's see in the chart:
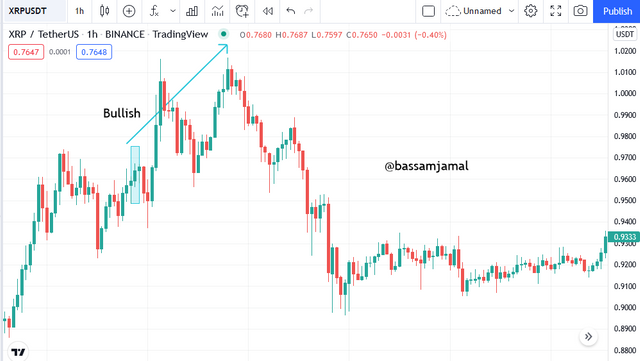
In the above image, you will clearly see that the midline or the middle line is in the low as compared to the other two lines left and right, etc. which indicates the bullish trend is starting in the market.
For Bearish:
In the bearish scenario, a point that turns the direction is the highest high in the midline of two lows highs of both sides. in the below chart you have clearly seen the Bearish fractals. basically, this will show you the Bearish market will start in the upcoming time. this is the perfect time to leave the market because the indicator says.
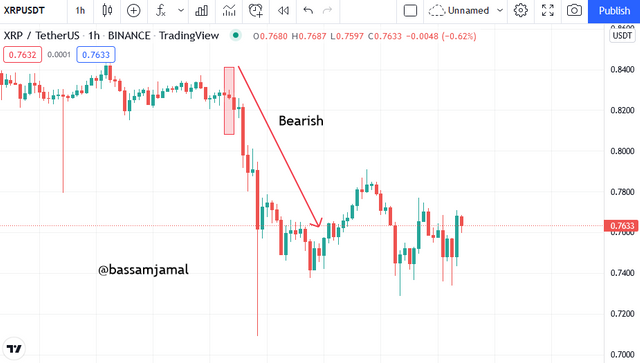
from the above image, you see that the midline or the middle line is in the high as compared to the other two lines left and right, etc. this indicates the trend reversal is starting in the market.
3. What are the different Indicators that we can use for identifying Fractals easily?
Until now, we have discussed the Fractals in-depth means what is the scenario, in bull or bear run. but in this answer, I will explore the more in-depth regarding that. Fractals indicator has many types like William fractals, Fractal Support and Resistance, and Fractal Breakout Strategy like that. but, in this Blog, we will be focusing on the William Fractal. I will be explained in more depth regarding that. but also I will show the setup and working of Fractal Support and Resistance, and Fractal Breakout Strategy. so, let's discuss first William Fractals:
For William Fractals:
Step # 01: At the very first you need to go to the web browser and type trading view. after that the trading view official website will be open so, let's select the chart in my case I will select the XRP/USDT. after selecting the chart the next step is going to indicator option and type William Fractal" click on it it will appear in your screen. see in the snapshot:
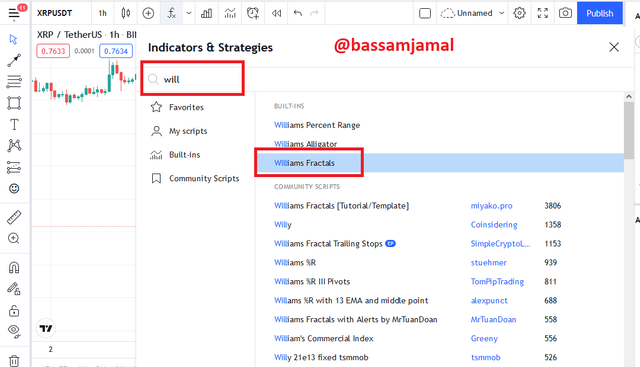
Step # 02: After applying the indicator you will clearly see that the arrows will appear in Red & Green colors. both of these colors identify the trends. the Red color shows the Bullish Trend and the Green color shows the Bearish trend. this is visual, helping the trader regarding the pattern. see in the snapshot:
For Fractal Breakout:
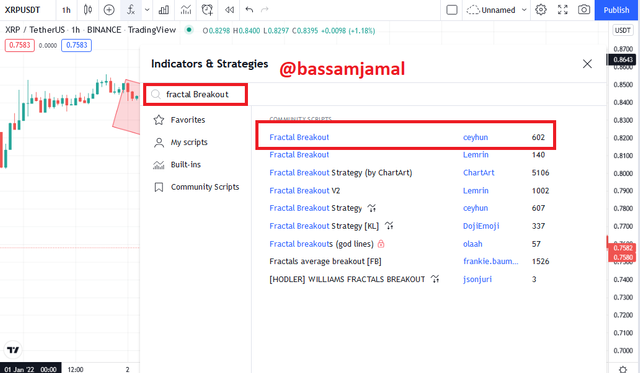
Step # 01: At the very first you need to go to the web browser and type trading view. after that the trading view official website will be open so, let's select the chart in my case I will select the XRP/USDT. after selecting the chart the next step is going to indicator option and type Fractal Breakout click on it it will appear in your screen. see in the snapshot:
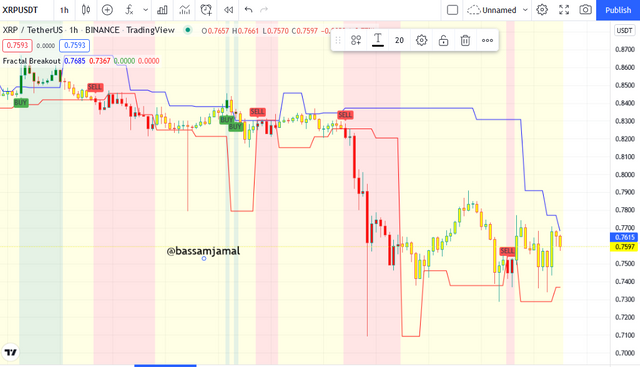
STEP-02: The Fractal Breakout has been added to our chart, which I can see through the screenshot above. in the chart you will see the blue and red lines both of these lines are shows the Breakouts. the blue line shows the resistance and the red line shows support. if the price breaks the green so, shows the buy order, and if the red line breaks. it shows the sell order.
Fractal Support & Resistance:
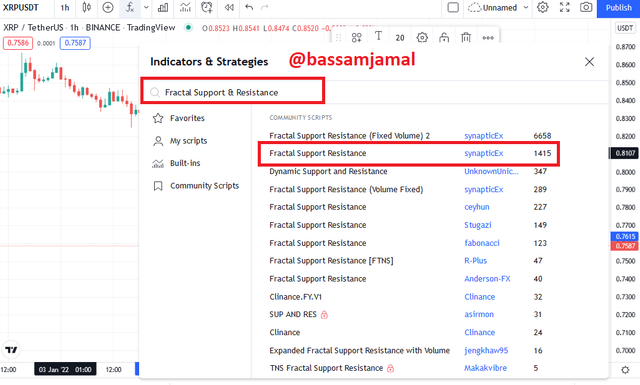
Step # 01: At the very first you need to go to the web browser and type trading view. after that the trading view official website will be open so, let's select the chart in my case I will select the XRP/USDT. after selecting the chart the next step is going to indicator option and type Fractal Support & Resistance click on it it will appear in your screen. see in the snapshot:
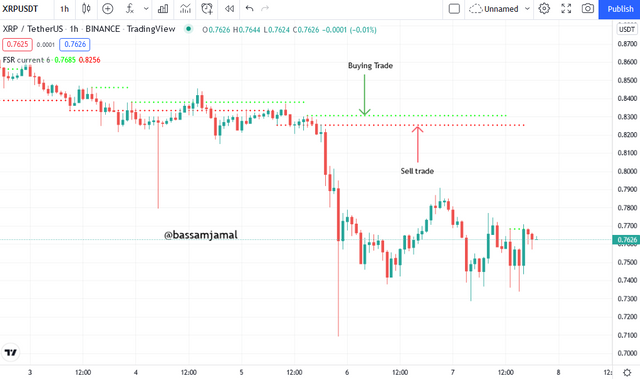
STEP-02: The Support & Resistance has been added to our chart, which I can see through the screenshot above. in the chart you will see the dotted lines in two colors Green & Red. the Green dotted line shows the support and the red dotted line shows the resistance. if the price move above the green dotted line so, take a buying trade and if the price is below the red line so, take a sell trade.
4. Graphically explore Fractals through charts.
In the above 3 questions, which I have been the answer it is the detail of what is fractals, how the William fractals work. I have also discussed the knowledge about the support and resistance, also we discuss the Break out in Fractals, and in the end, we have discussed the buying and selling point in the market. In this answer, we will identify the Fractals with the trading tool, and also explore its chart. so, same as the above question I have used the Tradingview to explore it. first we will go to the official website of trading view and select any chart.
The Fractals pattern which we will create is a good and profitable opportunity for all the traders. the reason for that is we used the current trend, and match the previous trend in a very simple manner.
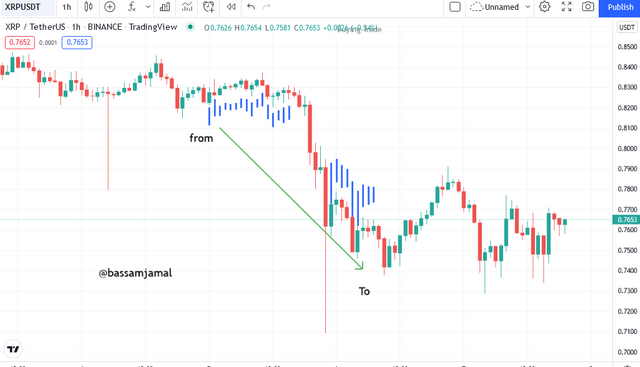
so, In my scenario, I was select the chart of XRP/USDT. basically, in this section, I will select the bar chart which is in Tradingview and set it as the position which I need. the pattern has been repeated. see in the snapshot:
XRP/USDT:
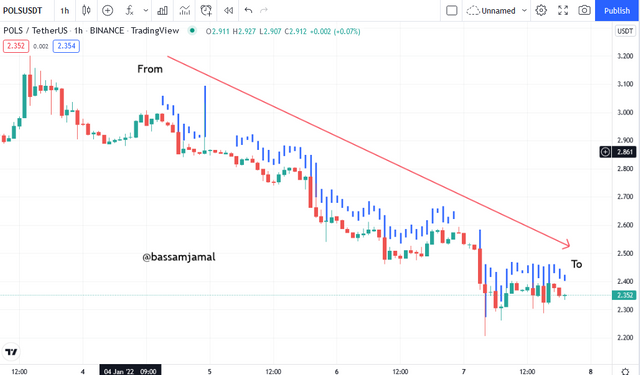
POLS/USDT:
5. Do a better Technical Analysis identifying Fractals and make a real purchase of a coin at a suitable entry point. Then sell that purchased coin before the next resistance line. Here you can use any other suitable indicator to find the correct entry point in addition to the fractal.
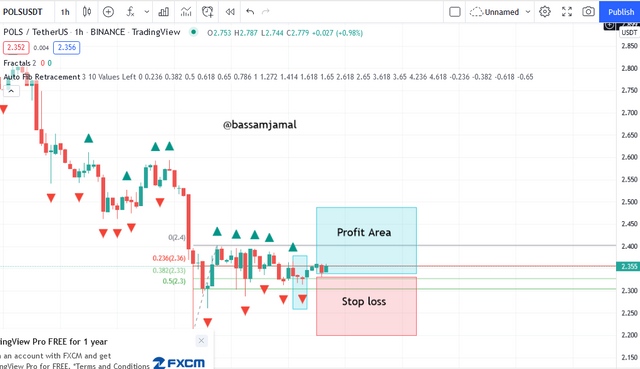
In this answer, I take trade from the Binance. before, a trade I will be analyzing the market with the help of a trading view. so, I select POLS/USDT first I will perform the analysis on it. see in the snapshot:
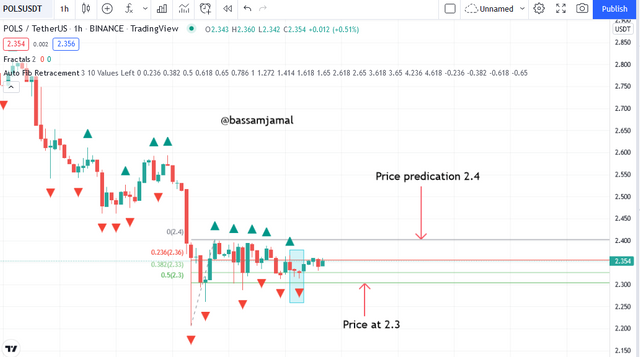
In the above image, you will see that I add the William Fractal on the chart, and after it, I will be adding an indicator which is called a Fibonacci Retracement. this indicator predicts the price and the movement of the price in higher highs or lower lows.
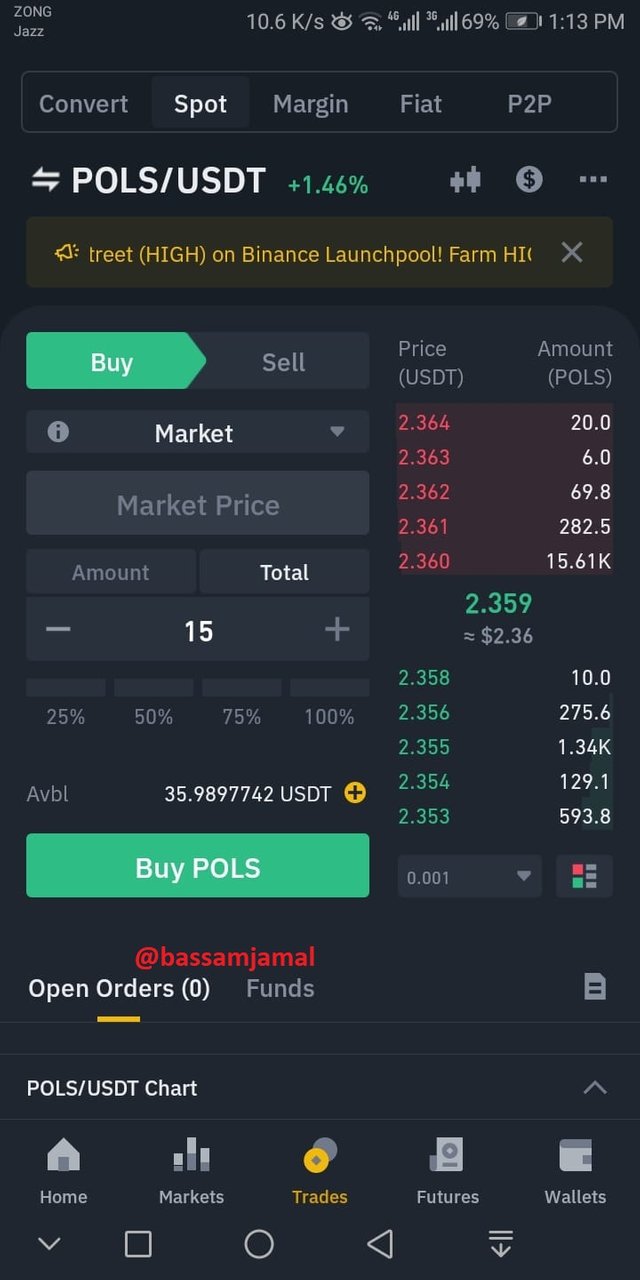
After performing the analysis, I go to the Binance account and perform a trade on it. see in the snapshot. for buy trade:
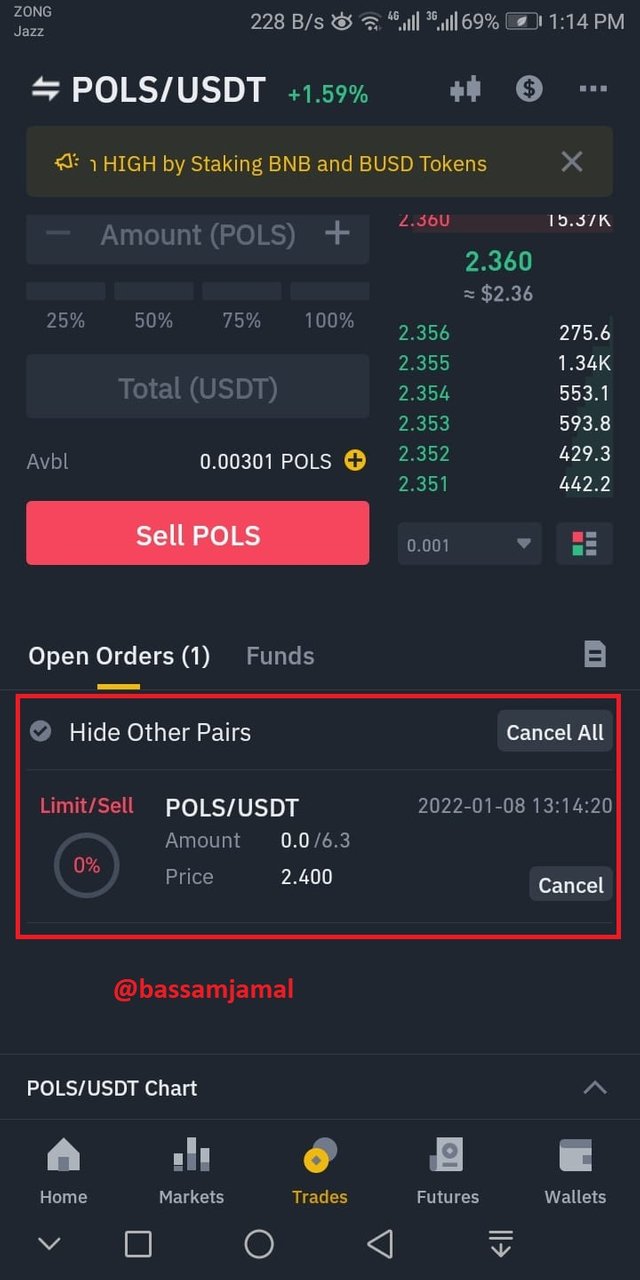
after buying trade I set a sell order which is at $2.4. see in the snapshot:
Conclusion:
Williams Fractals are a popular type of Fractal indicator. this indicator is most used by traders because of its ease. and also accuracy. this is indicator is more efficient than other indicators like Fibonacci retracement other indicators to filter signals, it is more utilized by traders due to its ease of use and accuracy.
We can use fractal patterns to find reversals, but it's not always as easy as we like because these patterns don't always work. finding Fractal patterns on the chart is a bit difficult. but, Practice makes men perfect. if you analyze more and more so, you make a profit from it.
So, that's it from my side. and I am very glad that you read my blog till the end.
Thank you!
Regards,
#reddileep-s5week8 #cryptoacademy #club5050 #steemit #steemexclusive #pakistan