REPOST || Trading Using Rectangular Pattern - Steemit Crypto Academy - S5W4 - Homework Post for @sachin08
Hello wonderful people, how are you today? I hope you're having a fantastic week. I'm ecstatic to be a part of this unforgettable lecture. In this article, I'll share my experience with Trading Using Rectangular Pattern.

Explain Rectangle Pattern in your own word.
The rectangle is a traditional technical analysis pattern with parallel lines indicating considerable support and resistance. Purchasing at support and selling at resistance, or watching for a breakthrough, can be profitable trading strategies.
Whenever the price moves between horizontal support and resistance levels, it forms a rectangle.
As the price goes up and down among support and resistance, the chart indicates that there is no trend.
Whenever there is a breakthrough, and the price moves out of the rectangle, the rectangle terminates.
Some recommend waiting for breakthroughs and play rectangles, purchasing at the bottom and selling or short selling around the peak.
Price fluctuation inside a predefined range is referred to as a rectangle pattern of price action. Clearly stated, a rectangle pattern is created when the price of an item moves among two more or less well established price levels. These price levels, which are marked by horizontal trend lines, operate as resistance on the upper side and support on the lower side.
How to identify Rectangles. Explain with Screenshots.
One can usually recognise rectangles at the top or bottom, thus these are the probable regions to search for the rectangular structure. Secondly, the price must be accumulating along more or less strictly defined two lines on both the top and lower sides. As previously stated, the upper level will act as resistance, while the lower level will act as support for the asset in question.
Any trendline must have at minimum two values when the price touches the line to be legitimate. It is not essential for the value touch points to be alternated. A minimum of two minor highs must contact the resistance line, and a minimum of two lesser lows must hit the support line.
###Rectangle pattern.
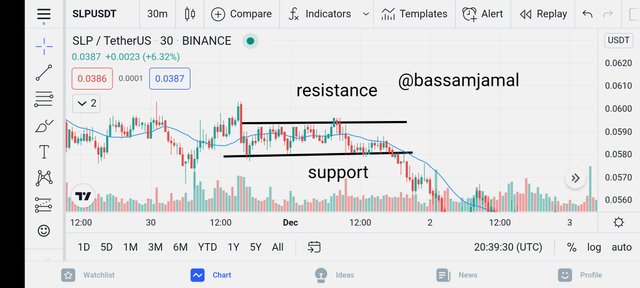
The cost of Slp is rebounding up and down from two well-defined market prices, as shown in the graph above. Several times, the price has come close to touching the resistance and support lines. As a result, it creates a proper rectangular pattern.
Can we use indicators with this pattern to get accurate results? Explain with Screenshots.
The rectangle pattern is a legitimate price action pattern in and of itself for generating a breakthrough signal. The "VOLUME" indicator, on the other hand, improves the precision of the signals generated. The value of a volume indicator resides in its ability to keep a trader out of bogus breakouts and fakeouts.
There must be sufficient volume represented on the indicator for confirmation of a real Breakthrough at a support or resistance level, which is usually expressed as a long extended candle. As a result, the emergence of a power candle during a breakoit usually indicates actual breakouts, and the volume indicator must show extended volume bars.
True breakout
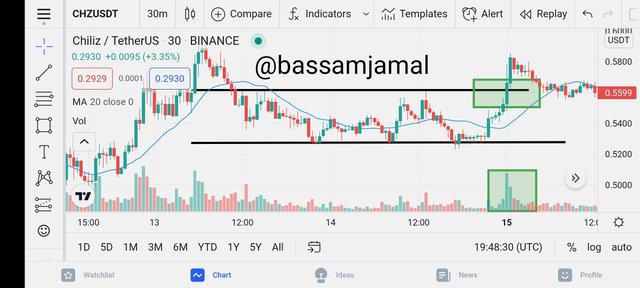
I merely want to emphasize the significance of using a volume indicator with a rectangular structure. Looking at the chart, we can see that a strong candle breaking through the rectangle's resistance line contributes to a strong movement up, which is confirmed by extended volume bars on the indicator placed above the chart.
Fake breakout.
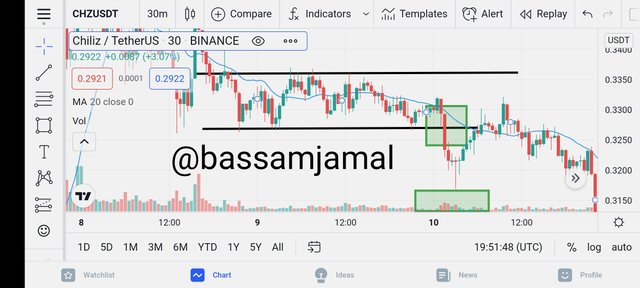
There are three bearish candles projecting below the support line shortly well before long bullish candle. Since a bearish candle broke the support line and the next two bearish candles were more devisive, one may quickly make the mistake of thinking it was the start of a negative trend. Looking at the volume indicator for these bullish candles, we it seems that there is no sell activity, indicating that an investor may have avoided the entrapment by checking at the volume indicator.
Explain Rectangle Tops and Rectangle Bottoms in your own words with Screenshots of both patterns.
At the top of a trend, rectangular tops form, while rectangle bottoms establish at the bottom of a trend. To determine whether a rectangle is produced from the top or bottom, we must examine the architecture of the candles that lead to the start of a rectangle. The price will move higher before flattening into a rectangle at the rectangle top, while the price will move decrease before becoming a rectangle at the rectangle bottom.
The significance of determining the top and bottom locations resides in their ability to culminate into a new trend. The top of the rectangle will result to a downturn, while the bottom will contribute to an uptrend.
Rectangle top.
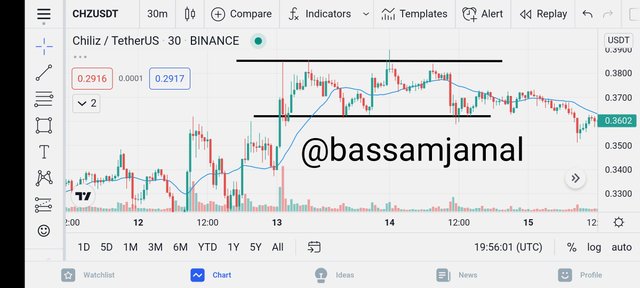
We can see from the graph above that an uptrending value corresponds to a consolidated pattern, which indicates to the top. The price then begins to fall, leaving the rectangle as the top.
Rectangular bottom.
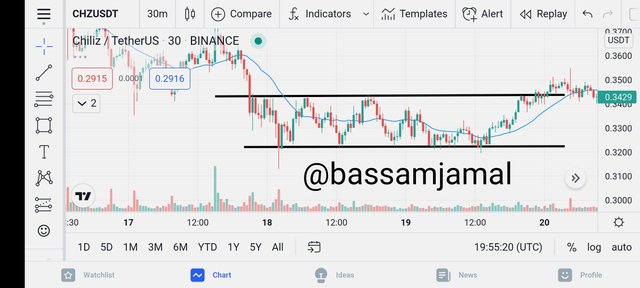
A downtrending price rally accommodates to a rectangle bottom, that is further emphasised by the start of an upswing, as shown in the graph above.
Show full trade setup using this pattern for both trends. ( Entry Point, Take Profit, Stop Loss, Breakout)
Trade setup for buying.
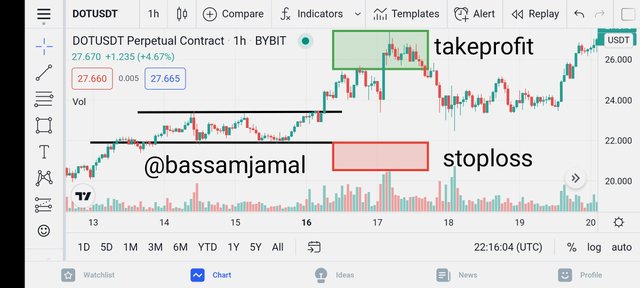
A valid breakthrough of the rectangle pattern on the top part (resistance) by a demonstrates the high candle and lengthy volume bars (good volumes) triggered a buying opportunity with the following requirements in the DOT/USDT chart above.
BREAKOUT :$23.4
ENTRY : $24
STOPLOSS :22
TAKE PROFIT : $25.45
Trade setup for selling.
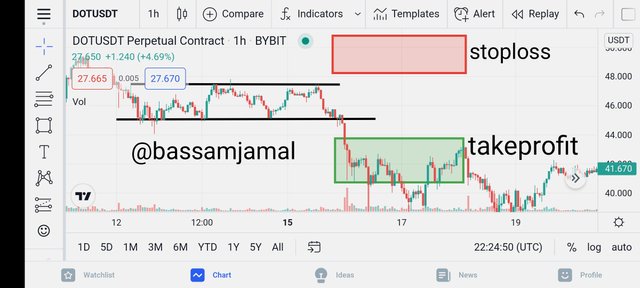
A valid breakthrough of the rectangle pattern on the bottom part (support) by a powerful bearish candle and lengthy volume bars (good volumes) triggered a sell signal with the following requirements in the DOT/USDT chart above.
BREAKOUT :$45
ENTRY : $44
STOPLOSS :48
TAKE PROFIT : $43.7
Conclusion.
Traders and economic experts have spent a great deal of time studying asset price trends and have established particular patterns that traders can profit from. After the establishment of these levels, price begins to act in a specific pattern, which can be realized if these patterns are understood. Rectangle pattern or accumulating market is one such pattern that we discussed today. Although the rectangle itself is technically understood to represent a no-trading zone, its breakthrough in either way signals the start of a new pattern that can be exploited.
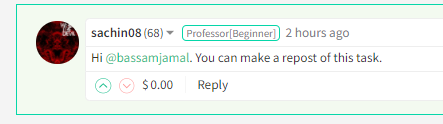
IT'S BEEN CHECKED AND THE PROFESSOR ASKED ME TO REPOST IT.
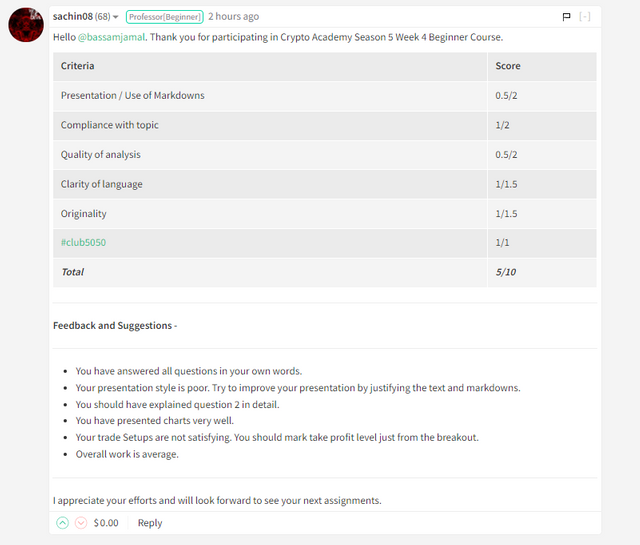
@sachin08