[ Highly [Profitable Trading Strategy with VuManChu Cipher B ]-Steemit Crypto Academy | S5W6 | Homework Post for @reddileep
Greetings,

1.Define VuManChu Cipher B Indicator in your own words.
As we all know that the crypto market is volatile in nature. nobody can say what next happen. so, in this scenario, we have to study the market in depth. like, we do technical analysis and fundamental analysis to avoid losses. so, we learn the technical analysis indicator which is the VuManChu Cipher B indicator. basically, this indicator is nothing but simple. it tells us the market price prediction movements in the Bullish or Bearish scenario.
VuManChu Cipher B Indicator is a high profitability indicator.the reason for that is it is the combination of different types of an indicator like RSI, Market Momentum and Money flow chart. this combination makes the trader more efficient and perfectly trading signals.
VuManChu Cipher B Indicator Illustraion
This indicator is freely available on a trading view. if we compared to other marker Cipher indicators. so, these indicators are wave trend indicators, and the difference is not to much between them.
The reason is this indicator combines multiple indicators, VuManChu Cipher B can be considered a trading method for experienced traders.
2- How to customize the VuManChu Cipher B Indicator according to our requirements? (Screenshots required)
VuManChu Cipher B Indicator Illustraion
To customize VuManChu Cipher B Indicator so, we need to follow the instruction which is provided by prof @reddileep in its blog. so, first, we need to open the trading View platform.
After opening the app. so, we need to select any coin and click the fx indicator.
VuManChu Cipher B Indicator Illustraion
After clicking the fx the new window will be open so, I search on the search bar tab and type VuManChu Cipher B. so multiple indicators appear on the screen. In my scenario, I will select the VuManChu Cipher B click on it.
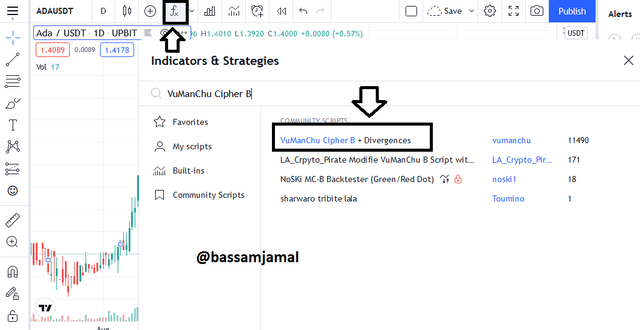
VuManChu Cipher B Indicator Illustraion
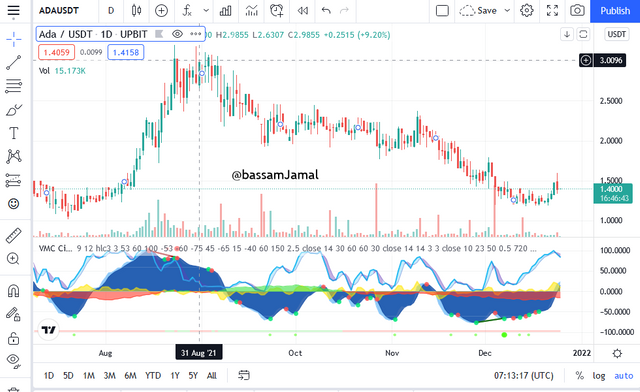
so, after selecting the indicator. it will appear on the chart. see in the chart below. the colorful lines.
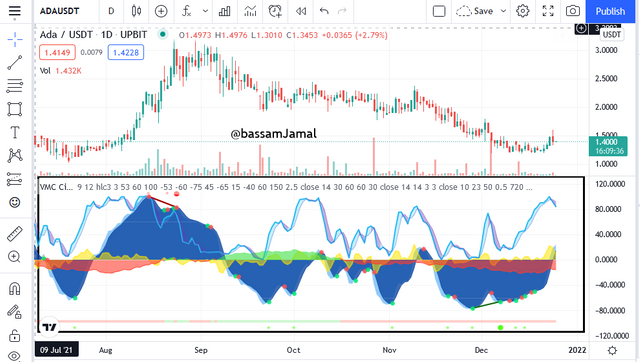
VuManChu Cipher B Indicator Illustraion
All the above images are just a setting for how to set the indicator on the chart. the default chart is just a default parameter.so, if we want to change the settings, so, we need to configure the settings.
see in the image.
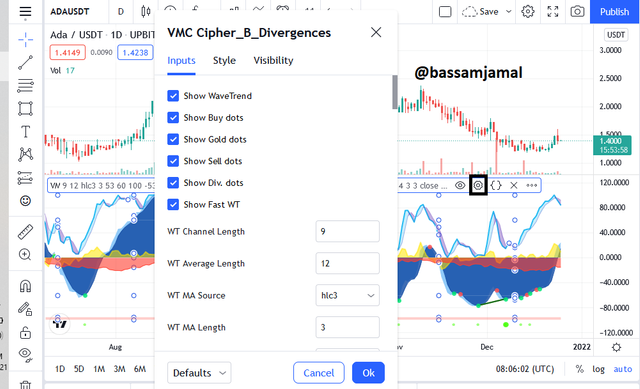
VuManChu Cipher B Indicator Illustraion
so, clicking on the settings the new window is open which is showing the default properties of the indicator. the configuration depends on your trading strategy. means what is your requirements.so, I uncheck the two properties. see in the image:
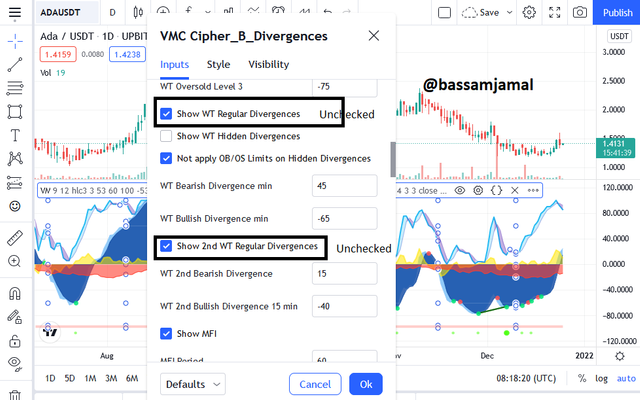
VuManChu Cipher B Indicator Illustraion
further scrolling down the one more column checkbox which is Stochastic RSI to uncheck. so, this becomes easier to understand.
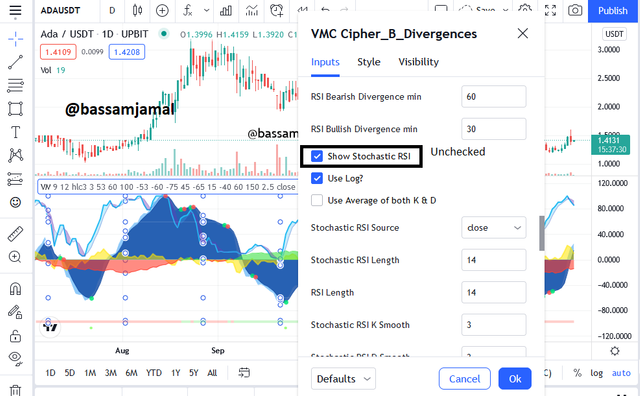
VuManChu Cipher B Indicator Illustraion
Style Tab Customization:
so, the next tab is style. in this tab, we change the color of the applied indicator. so, I will remove the Average price indicator which is in yellow color because it is easy to understand.
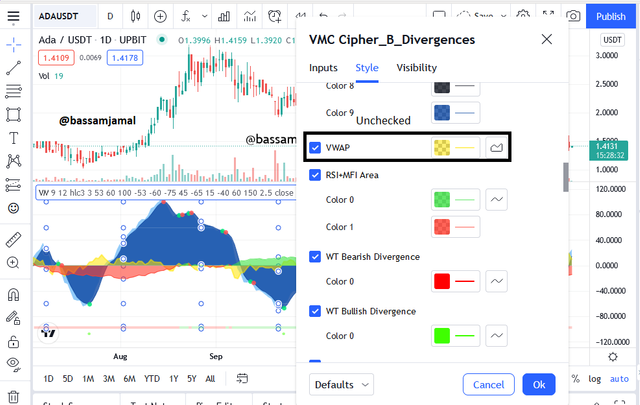
VuManChu Cipher B Indicator Illustraion
one more thing which is MFI colors. I will also remove it. see in the image:
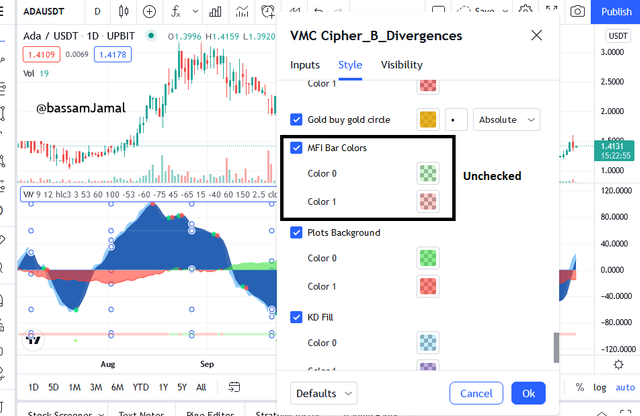
VuManChu Cipher B Indicator Illustraion
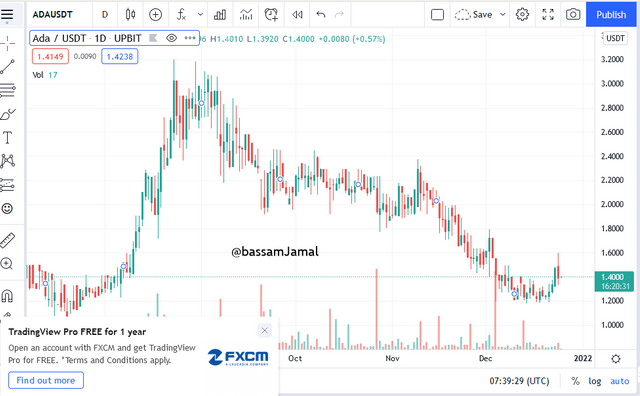
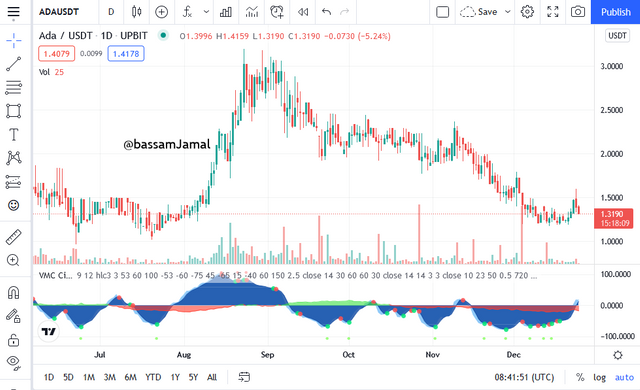
see the final chart after configuration which is easier to understand and more sophisticated.
3- Explain the appearance of the VuManChu Cipher B Indicator through screenshots. (You should Highlight each important part of this indicator by explaining their purpose)
VuManChu Cipher B indicator and its Appearance:
As previously explained, the VuManChu Cipher B indicator is a combination of multiple indicators together to create the trading system for traders. To better understand the indicator, we have to study parts of this indicator. let's understand one by one:
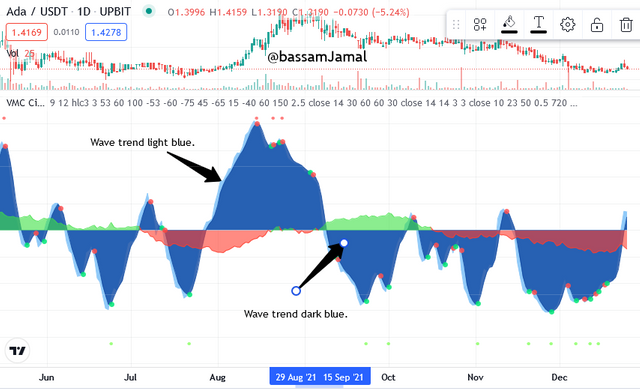
Wave Trend Indicator:
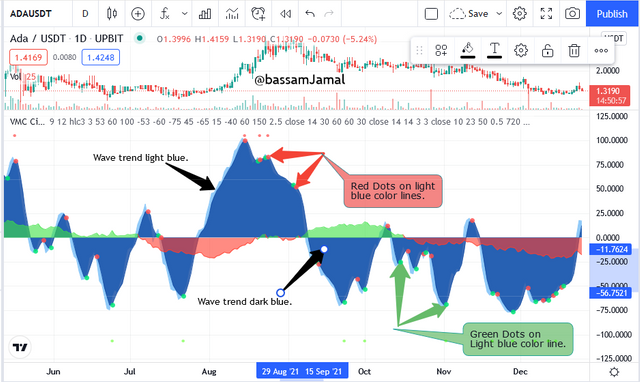
the very first part is Wave Trend Indicator. this wave trend indicator area is filled with dark blue color. which rounds the indicator and forms the base of the indicator. the wave is derived with two different colors one is dark blue and the other or last is light blue. on the light blue color line, you see the dots in red or green color. these dots indicate the price control in the market. see in the image:
Money Flow Index Indicator:
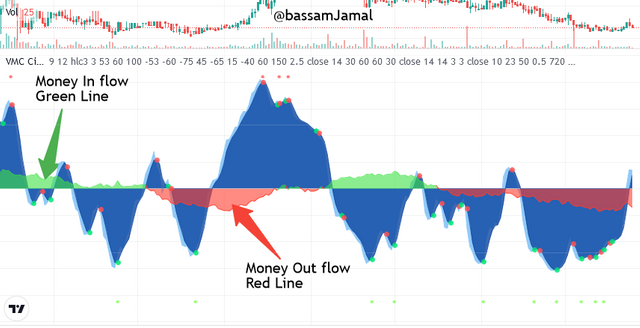
The second part is the money flow index which belongs to the cloud-like filled line in wave trend. the indication on this cloud line is the flow of capital amount which is in the trade or out the trade of assets. cloud-filled lines are in two colors which are sometimes green and sometimes red. these two colors show the indication. the green color shows the inflow amount of capital. and while the red color shows the outflow of capital.
4. Demonstrate your preparation for the Trading Strategy by combining other indicators. (Instead of showing the addition of indicators to the chart, you should explain the purpose of each indicator for this trading strategy.)
VuManChu Cipher B indicator And EMA:
As we all know that in the technical analysis we used different indicators. the best practice is we used more than one indicator to perform the technical analysis. so, in VuManChu Cipher B we used another indicator which is called the Exponential moving average (EMA). if we combined this indicator so, we can filter out the false signals. and the result we get is more accurate. VuManChu Cipher B indicator combines with (EMA) exponential moving average with 55 and 200 periods.
these EMA's periods determine the signals like the entry and the exit periods. when the 55 EMA crosses above the 200 EMA, so, it indicates the buying signals mean it's time to enter the market. similarly, when 200 EMA crosses above 55 EMA. so, this opposite signal indicates the sell start in the market. means it's time to leave the market. both of these EMA points combine with the VuManChu Cipher B indicator to understand the trade signals.
so, here is the important point the VuManChu Cipher B indicator must confirm the trade signal line with EMA crossover to take it a good trade signal.
5. Graphically explain how to use VuManChu Cipher B Indicator for Successful Trading. (Screenshots required)
VuManChu Cipher B indicator:
As I mention above Using the levels of EMA and the VuManChu Cipher B indicator these two indicators affirm the price's directional before verifying the trade signals. so, let's understand this in detail:
In Bullish Scenario:
The 55 EMA must cross it above the 200 EMA in a bullish scenario, verifying the EMA bullish trade signal. The VuManChu Cipher B indicator must confirm the trade signal once the demand is fulfilled.
The volume flow (MFI) on the VuManChu Cipher B indicator must be green, indicating the inflow is started adding on it. as we all know the Rule of Economy which says if the demand is high so, the supply is low. the same rule is apply here, as inflow increases demand, which forces the asset's price to trade upwards.
The VuManChu Cipher B indicator's trend wave must be the crossover of the dark blue and light blue lines also should be marked with a green dot, indicating that the current trend is bullish to take the trade. this shows that buyer is in control of the price at a specified level. see in the chart:
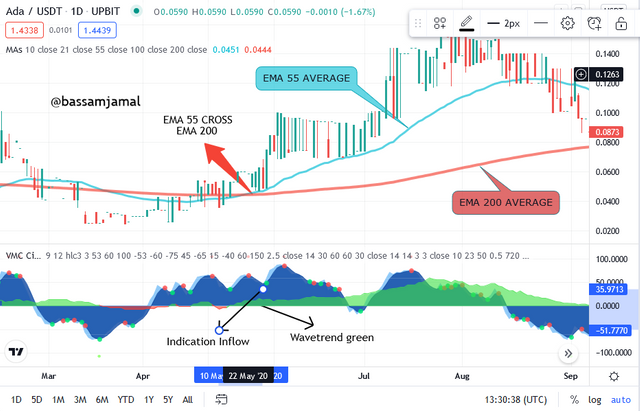
In the above image, you will clearly see that the EMA 55 line crosses the EMA 200 and in the indicator, the green dot indicates the money inflow starts. or the green cloud indicates the Bull run starts all the conditions meet in this scenario.
Bearish Scenario:
If we talk about the Bearish scenario, so, the EMA 200 is a must to cross 55 EMA. if this condition is met so, this shows that it is a Bearish trade signal. because the condition is satisfied.
if the above signs show and meet its condition. now, we have to see the VuManChu indicator. in this indicator the red dot and the red color cloud confirm that the outflow of the money. means supply more than demand. so, as the result, the price of assets goes down.
the one thing which is to be discussed here is the trend wave in VuManChu Cipher B the Dark blue line and the light blue line should be indicated with a red dot which shows the trend is Bearish. see in the chart:
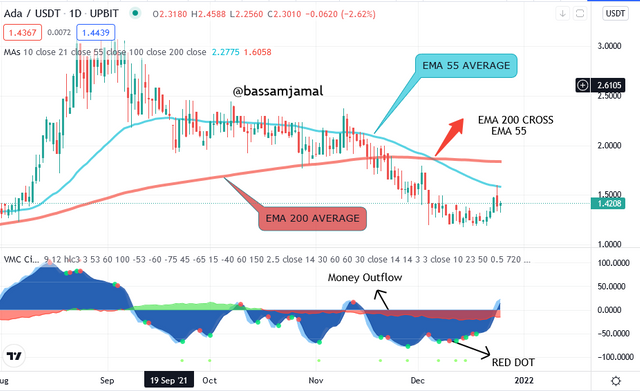
In the above image, you will see the EMA and VuManChu Cipher B indicator both of these two market indicators indicate the Bearish market starts. and money outflow is also started or the red cloud also indicates that this time to leave the market.
6. Using the knowledge gained from previous lessons, do a better Technical Analysis combining this trading Strategy and make a real buy or sell order in a verified exchange. (You should demonstrate all the relevant details including entry point, exit point, resistance lines, support lines, or any other trading pattern)
I will select Litecoin and perform the analysis according to the question. I use the platform which is the trading view. so, let's move towards the question:
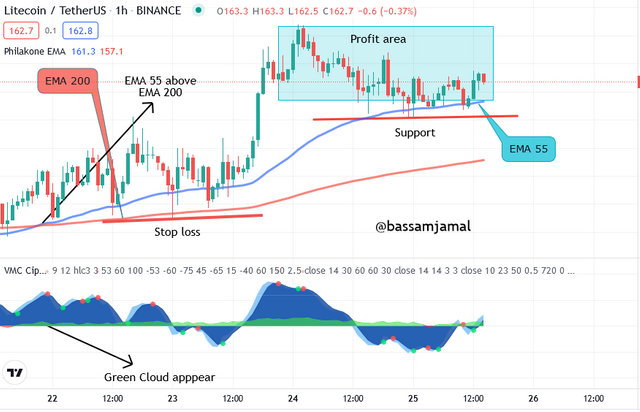
Technical Analysis:
In the above image LTC/USDT of technical analysis, you will see I have used two indicators which are EMA & VuManChu Cipher B. the levels of EMA's are 55 and 200. both of these have different colors to make them identical.
The VuManChu Cipher B indicator confirms the trend with the money flow index (MFI) which indicates the money is the inflow in the market. due to this, the demand increases in a short time.
2. Buying using Binance:
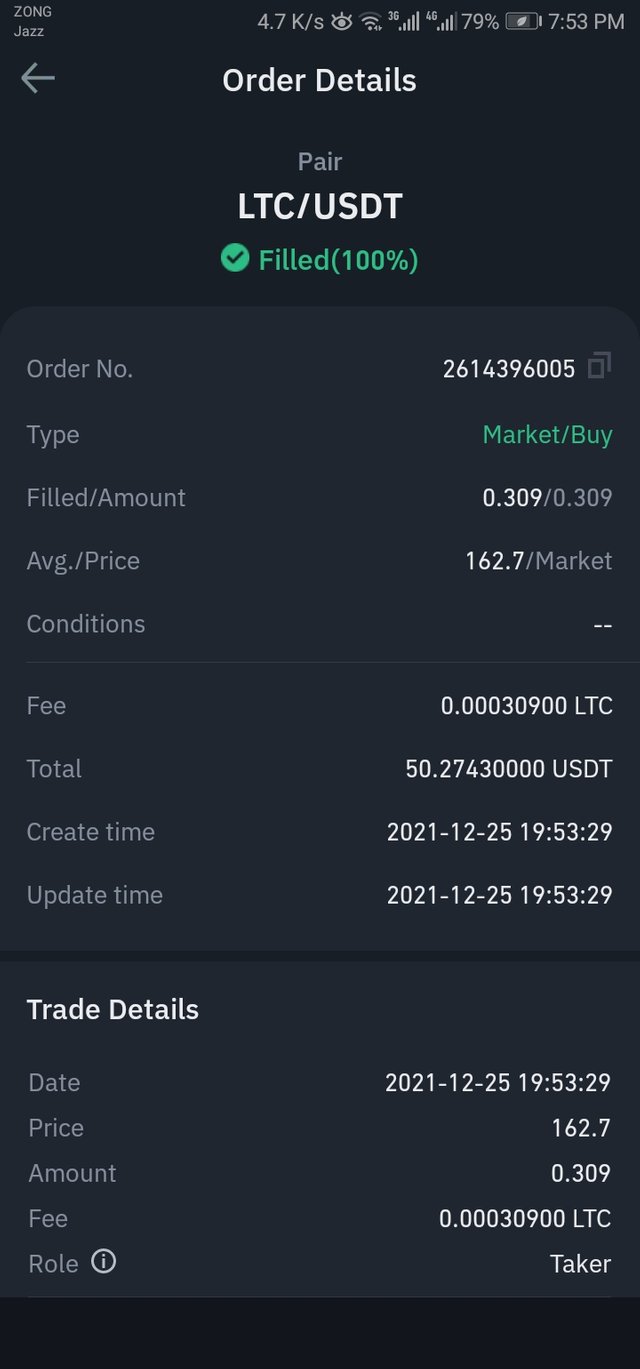
there are the following parameters that I have been used which are:
- Profit area maximum 167.
- Support at 158.
- Stoploss is 153.
- Buying at 162.
all these parameters are in the one-hour time frame.
Conclusion:
The relative strength index (RSI), market volume and momentum, money flow, and other indicators are the base VuManChu Cipher B. additionally, EMA's periods like 55 and 200 are shown more accurate levels. the inflow or the out flow also helps the trader to take its position in the market.
In the end, I am very thankful to prof. @reddileep, that shares the knowledgeable article with all of us. thank's for reading my post.
Regards,
Hello @bassamjamal ,
Unfortunately, you were failed to maintain your club5050 level at least until the curation. Therefore, I'm unable to request a reward for you. Please remember that it is your responsibility to maintain your club5050 level if you need to stay in the academy.
I've done the enough powerup sir kindly check and request a reward please
Ok, let me check.