Crypto Trading With SuperTrend Indicator - Steemit Crypto Academy - S5W7 - Homework post for @kouba01
Introduction
Hello wonderful people, how are you today? I hope you're having a fantastic week. I'm ecstatic to be a part of this unforgettable lecture. In this article, I'll share my experience with Crypto Trading With SuperTrend Indicator.

1. Show your understanding of the SuperTrend as a trading indicator and how it is calculated?
The super trend indicator is one of the most popular and commonly used indicators among traders. This is due to the indicator's ease of implementation and comprehension. The indicator is primarily used to follow the asset's direction of the market, and it shows which trend the market is currently on using two colors (red and green).
Olivian Serbian came up with the indication. When evaluating its relative value of market volatility, the designer used the Average true range.
The indicator turns color to green by default in a positive trend and appears at the end of the price graph. As the market begins to progress, the indication visible underneath the price movement acts as support.
In that it monitors patterns and operates as a dynamic support and resistance level for the price, the supertrend is comparable to a Moving Average. The super trend, but unlike Moving Average, does not intersect the price movements in a pullback; instead, it begins at a level in the other way and plots to adopt the current trend.
How the Supertrend is calculated
The Average True Range of a given time is used to compute the Supertrend. The ATR aids in the adjustment of the indicator to price fluctuations. This indicator's equation:
UpTrend (Lower Line) = (High + Low) / 2 - Multiplier x ATR
DownTrend (Higher Line) = (High + Low) / 2 + Multiplier x ATR
To begin, we must first get the ATR for the periods under consideration. To compute the ATR, first determine the True Range. This True Range is the greatest number resulting from three formulas:
- Current high - Current Low
- Absolute value (Current high - Previous Close)
- Absolute value (Current low - previous Close)
then,
- ATRn = [ATRn-1 x (n-1) + TRn] / n
The ATR is calculated and then added to the Supertrend algorithm. Throughout a decline, multiplication is used and the mean of the elevated/low values is combined to determine the number for the line above. In an upswing, though, the value of the line underneath is deducted from the average.
It's crucial to examine factors like closing prices and Supertrend readings from the previous and present periods to see where and how the super trend will be drawn on each period. This can be computed to ensure that the indicator tracks the trend at all times.
2. What are the main parameters of the Supertrend indicator and How to configure them and is it advisable to change its default settings? (Screenshot required)
- The ATR period and ATR multiplier or factor are the two crucial components of the Supertrend indicator. After we've added the indicator to the chart, we'll need to click the Gear icon to set it.
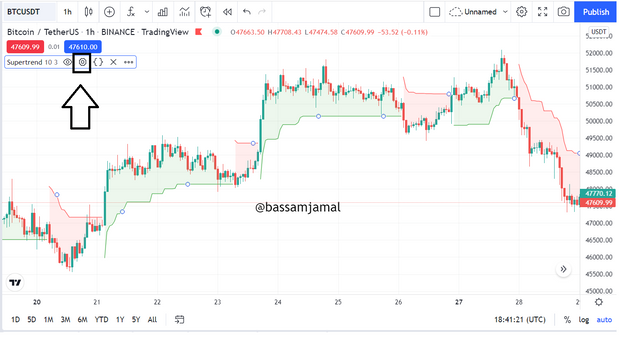
- The settings in question can be found under the input tab.
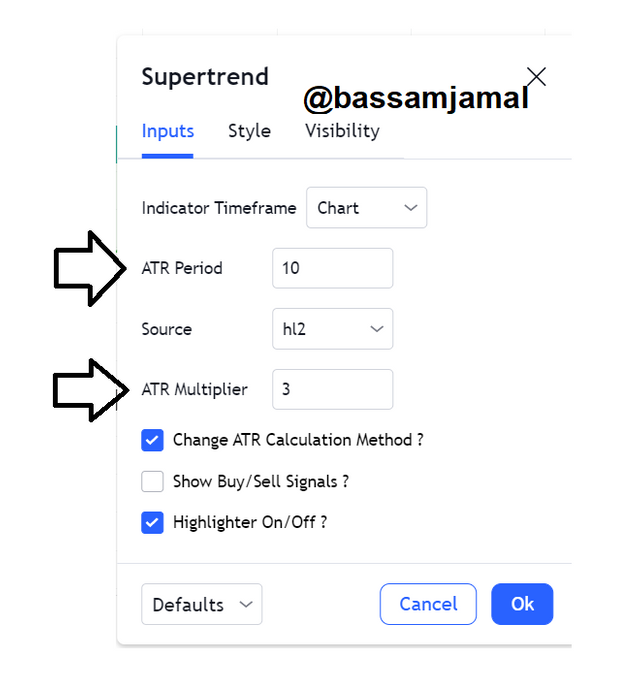
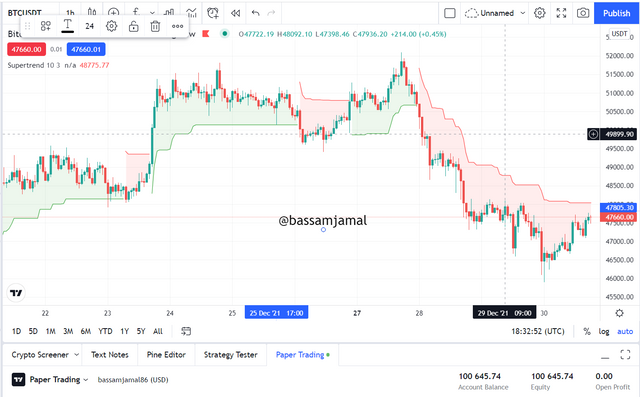
- The default settings for these settings are 10 for the period and 3 for the multiplier. In the graph below, we saw how they combine to generate the indication.
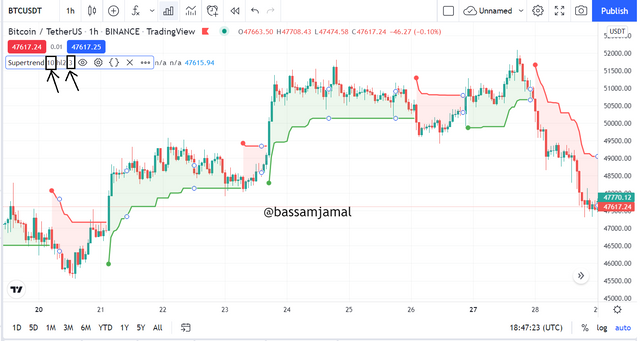
ATR Period
I'm going to try changing the ATR period to 5 and 15 and see what happens.
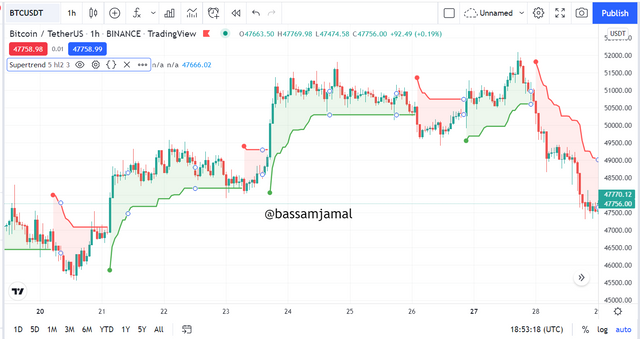
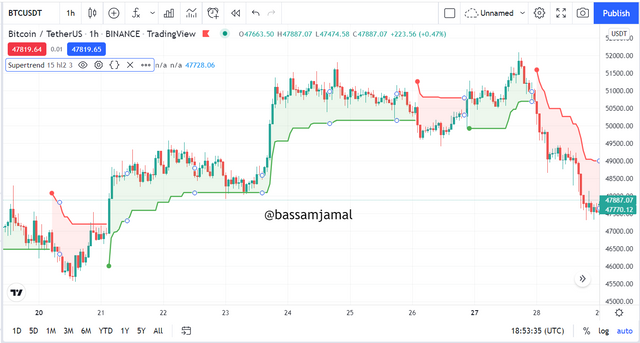
I modified the ATR period to 5 in the first screenshot and to 15 in the second. According to my findings, the indicator with a shorter period of 5 had more peaks and a few late indications. The indicator, on the other hand, was shallower and contained a few early alerts with a 15-period duration. Apart from that, there were few distinctions.
ATR MultiplierM
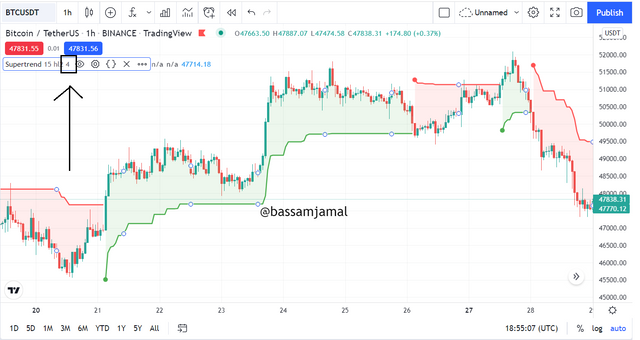
The Multiplier is set to 4 in the figure above. This level reduces the indicator's sensitivity to market volatility, resulting in fewer indications. Because it filters noise during retracements, it creates fewer signals but is less subject to errors indications.
3. Based on the use of the SuperTend indicator, how can one predict whether the trend will be bullish or bearish (screenshot required)
The SuperTrend indicator, as previously mentioned, is a trend tracking predictor. It recognizes a trend by its color and moving orientation.
Bullish Trend
The indicator would be green and placed beneath the price movements in a bullish trend. It would act as a variable support level for the price at this time. This is depicted in the graph below.
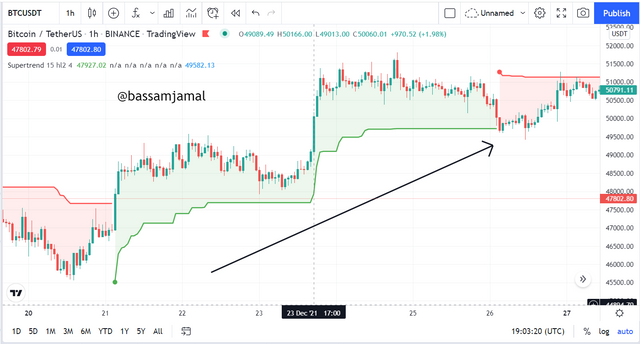
The Supertrend is green and underpins the whole price movement, as shown in the chart above. It serves as a flexible support level for the market in this scenario.
BearishTrend
The super trend in a downtrend would be red and plotted above the price action. It would act as a dynamic resistance level for the market at this time. This is depicted in the graph below.
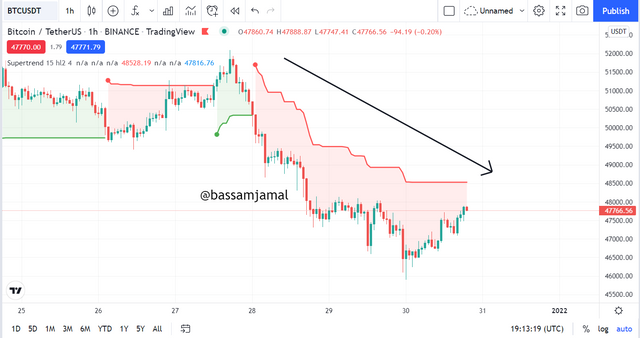
The Supertrend is red and is above the overall price movement, as shown in the chart above. In this situation, it serves as a flexible pricing resistance point.
4. Explain how the Supertrend indicator is also used to understand sell/buy signals, by analyzing its different movements. (screenshot required)
The super trend can be utilized to initiate winning trades, just as it could be used to detect the present market direction. Entering positions in reversals is crucial.
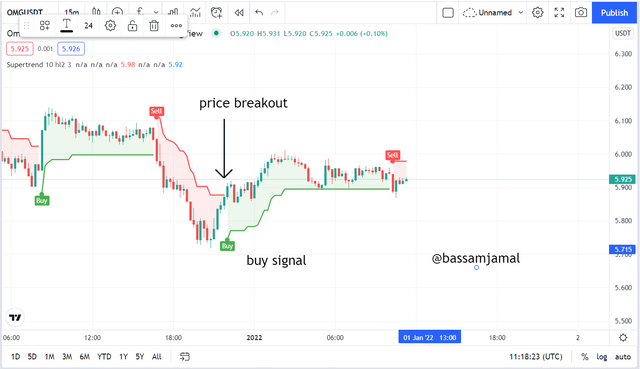
The asset's price will be in an upswing for a buying opportunity, but the super trend would be in a decline at first. We establish a buy trade when the super trend dips below the price and becomes green.
Buy signal
Ensure the trend is negative and the market reaction is making lower highs and lows before placing a buying opportunity. The trend will subsequently diminish, and the price will ultimately break through the upper band to rise above it. We watch for the line's color to shift to green and for it to move below the price action.
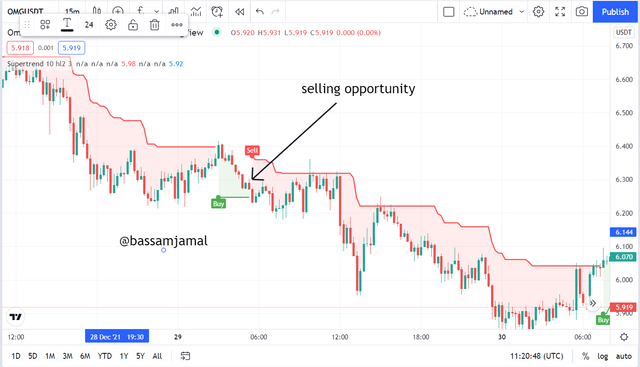
Signal to Sell
In the instance of a sell indication, the market should be strong right now but showing signs of reversion. After the establishment of an upper band and a red range, the bearish candles must eventually break the lower band.
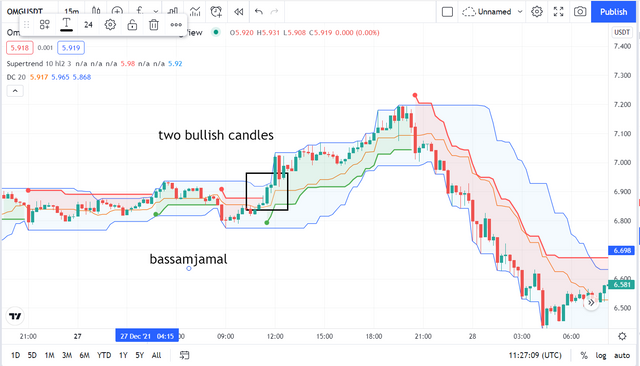
5. How can we determine breakout points using Supertrend and Donchian Channel indicators? Explain this based on clear examples. (Screenshot required)?(screenshot required)
The Donchian, when combined with the Supertrend, validates the breaking point and eliminates the possibility of incorrect guesses. On Donchian, we seek breakthroughs and then correlate them to the Supertrend indicator to confirm the breakout.
In the event of a buy signal, we search for 2 sequential bullish candles breaching the upper line of the Donchian channel and then channels, and contrast to check if the Supertrend is also in green and the bottom band is showing a bullish trend.
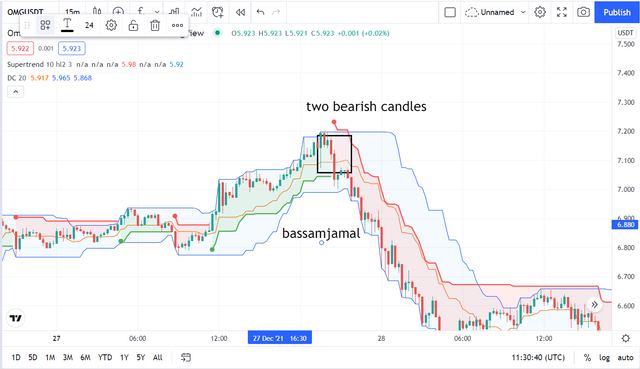
When looking for a sell indication, watch for two bearish candles that contact and exceed the lower line of the Donchian indicator, then contrast to check if the Supertrend is also exhibiting a bearish trend with the development of a red Upper band.
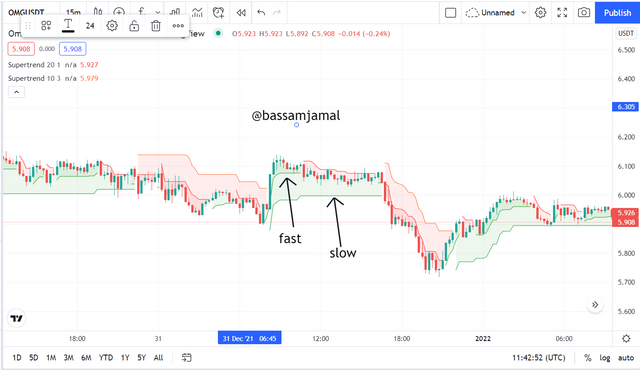
6. Do you see the effectiveness of combining two SuperTrend indicators (fast and slow) in crypto trading? Explain this based on a clear example. (Screenshot required)?
It's customary to utilize MA lines with varied periods to predict breakouts and trend confirmations by observing their overlap or free motion. Connecting different Supertrends, one slow and one fast, would have a comparable forecasting impact.
In the same way that we look at both Ma's while putting a buying and selling order in a double MA setup, we will seek for the synchronization of both indicators to place a signal in this scenario.
We'll utilize the default configuration for a slow indication, while a rapid indicator, which will be more sensitive
The slow indicator was still displaying a green horizontal line, but the fast indication was indicating a downward trend. It is not a question of whose readings is more correct; rather, the dispute between the two demonstrated that now may not be the best time to place an offer, so one should wait until both come in alight, as they do later.
Another consideration is that using a slow term indication in conjunction with a fast term indication helps to avoid premature withdrawals, but you may miss early signals while waiting for the two parameters to realign, resulting in you obtaining roughly the same profit on the trading.
As a result, many traders choose to utilize two distinct indications rather than two Supertrend indications.
7. Is there a need to pair another indicator to make this indicator work better as a filter and help get rid of false signals? Use a graphic to support your answer. (screenshot required)?
Using a collection of indications rather than a single signal is always preferable. Since no indicator is 100 percent accurate, a single indicator is more likely to provide wrong signals that can be detected in real-time if another indication is used in conjunction.
Furthermore, it is important to note that we utilize a second indication not only to filter out confusing signals but also to view the marketplace from several angles. For instance, if we combine RSI with Supertrend, we will be able to make selling or buy orders based on the pattern, unpredictability, and momentum caused by buying and selling force, which will improve the accuracy of our research.
We will place a buying opportunity if the RSI has escaped the oversold region and positive market candles have developed. We now can compare the two knowing that we all have Supertrend and RSI. We did not execute the trading until we verified a breakthrough on the Supertrend, as indicated in the picture below, although the RSI was out of the overbought range.
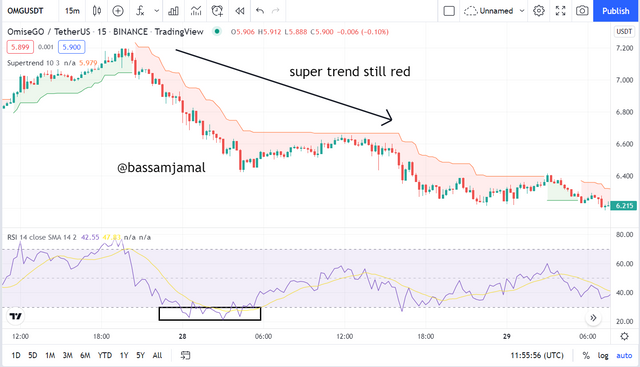
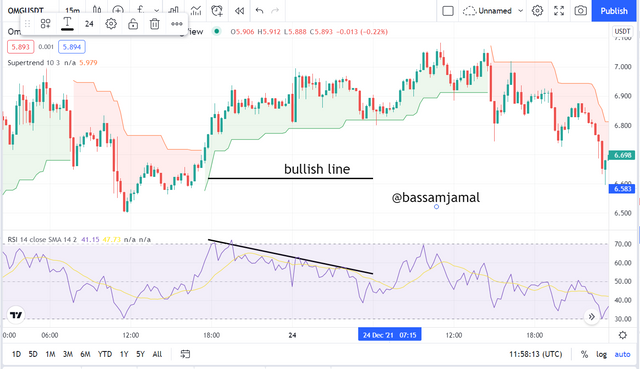
On the other hand, even if the RSI was falling below, the Super trend displayed a green line in the scenario below. Although Supertrend suggested that a bullish trend might still be forecast, RSI revealed that a negative breakout is imminent.
8. List the advantages and disadvantages of the Supertrend indicator?(screenshot required)?
Advantages
- It acts as a visual indication and moves in lockstep with the market activity.
- It is simple to comprehend and interpret.
- It may be utilized for a variety of assets after adjusting its specifications.
- It considers both the average price and the price volatility.
- To confirm indications, it might be combined with additional indicators.
Disadvantages
- Because it is based on simple on-chart data, it can show erroneous and postponed indications.
- In the absence of an overall market, it is unable to provide useful information.
- For proper period and ATR settings depending on your item, you may need to learn skills.
Conclusion:
To sum up the article, The ATR and the factor are the two components of the Supertrend indicator. It's being used to validate trends, determine market direction, identify breakouts, and put buy and sell signals. When combined with the Donchian indicator, it can assist in the correct forecast of breakthroughs. It is also recommended, like with other indications, that it be used in conjunction with others.
CC:
@kouba01