[Crypto Trading With Linear Regression Indicator] || Crypto Academy / S5W5 || Homework Post for @ kouba01
Hello wonderful people, how are you today? I hope you're having a fantastic week. I'm ecstatic to be a part of this unforgettable lecture. In this article, I'll share my experience with Crypto Trading with Linear Regression Indicator.

Question 1
Discuss your understanding of the principle of linear regression and its use as a trading indicator and show how it is calculated?
In a comparable pattern to moving averages, the Linear Regression Indicator is used to identify and track trends. Linear Regression Lines, that are linearly matched to a sample of data are not to be confounded with the indicator. The Linear Regression Indicator shows the end points of a sequence of linear regression lines generated over a period of time. The benefit of the Linear Regression Indicator over a regular moving average is that it has less latency and reacts to changes in trend faster. Its disadvantage is that it is more susceptible to procedure is as follows.
The indicator is more commonly employed in marketplaces, and it consists of several factors, including variables, to decide a result. In other words, the conclusion is the result of the correlation between the elements and free parameters.
Whenever the LR indicator is placed on a graph, it begins with a single line that touches and crosses numerous points highlighted on the chart, forming a connection between the dependent variables on the y axis and the independent variable on the x axis.
We can derive the trend direction, trend intensity, so the moment of trend conclusion from all of the data. It is used in the same way as moving averages are. The primary benefit it has over the moving average is that it is more responsive to market fluctuations, resulting in less lags. It displays the total current of the linear regression line formed on the given candlesticks.
A linear aggressiveness line is constructed by calculating the squared of the terminals, and the points further away from the line have a greater impact on the course.
Linear aggressiveness is used to capture trading indications after strong trends that follow a similar pattern to that of a moving average. It also aids in the detection of oversold and overbought indicators.
Calculation
The formula is used to calculate it.
- A + Bx = Y
-A is the price-time intercept, and B is the slope of the line.
The regression coefficient is x. (Time).
The dependent variable, Y, is computed by summing the numbers in the equation.
If x=20, B=1.8, and A=10, then Y = A + Bx Y=10+1.8*20=46.
Question 2
Show how to add the indicator to the graph? How do you configure the linear regression indicator and is it advisable to change its default settings? (Screenshot required) ?
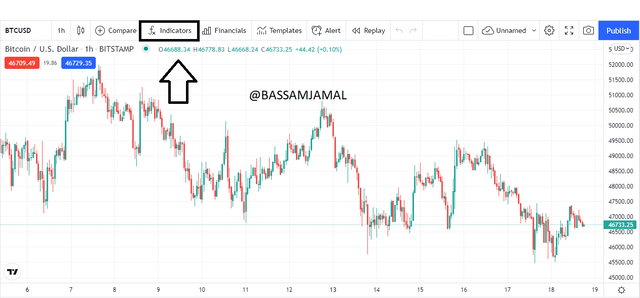
Sign up for free at tradingview.com to add a linear regression indicator to the graph.
Choose any pair from the chart menu. On the top bar, click the fx symbol logo.
- Look for the name in the search bar.
Click on it to insert it into the graph, a single click will add the indicator once.
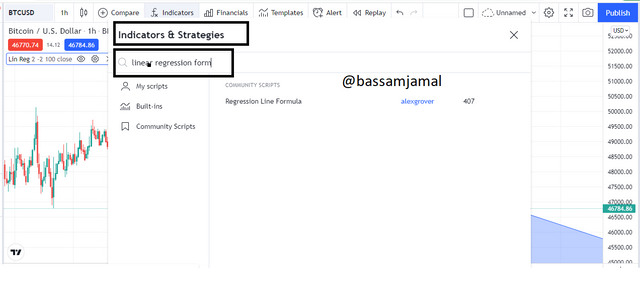
- Indicator will be added successfully.
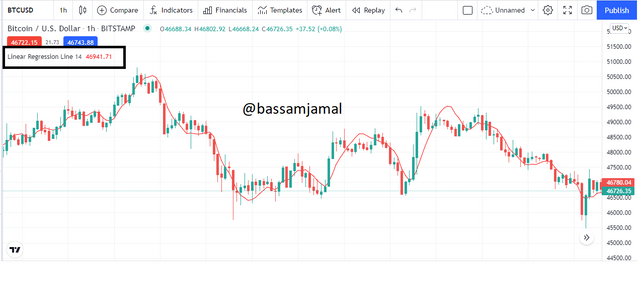
- We can modify the layout and period of the indicators by clicking on the settings option in the indicator modification bar on the top left.
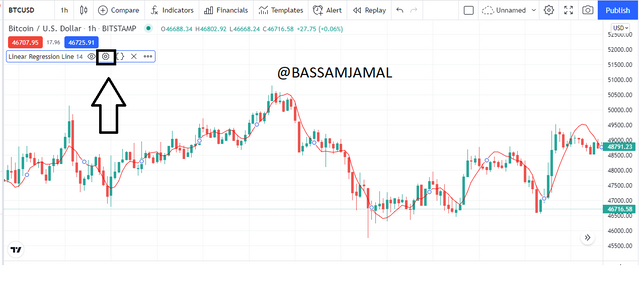
- We can also adjust the line's width, look, and colour.
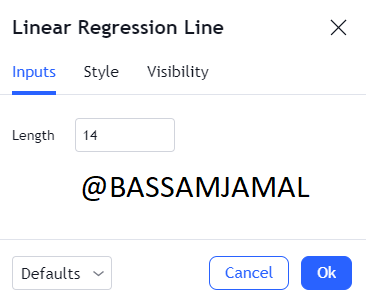
- Most traders believe that altering the default configuration is not recommended; nevertheless, altering the periods and length is entirely up to the investor. Long-term investors frequently prefer longer periods to see just the strongest indications, whereas scalpers choose shorter periods. Here is a chart showing LR with 14 (red line) and 50 (blue line) periods, accordingly.
Question 3
How does this indicator allow us to highlight the direction of a trend and identify any signs of a change in the trend itself? (Screenshot required)?
As previously noted, linear regression can be employed in the same way that a moving average can, in because when it travels along to the price movements, it indicates the trend's orientation. Whenever the LR moves in lockstep with the price, it is an unmistakable evidence of a trend. The market will not breach the LR indication at this moment. The slope of the LR indication will vary throughout a reversal.
As a result, we can notice the indicator's trend shifting. After that, the price line passes the LR. As the price changes course, so does the LR line, and the indicator follows suit.
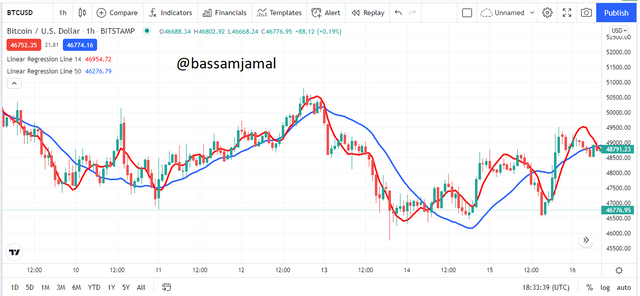
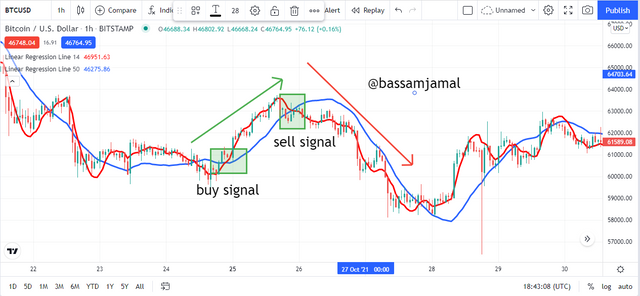
In the BTC/USDT chart below, for instance, we could see that the LR line went together with the price movements during an upswing. As the tendency slows and turns negative, the slope of the LR changes, and the price movement crosses the LR from above continues to fall.
The LR line swings up in uptrends and down in downtrends since its movement is directly related to the trend. There is indeed a lower or upper crossing as well as variations in the slope whenever there is a turnaround.
Question 4
Based on the use of price crossing strategy with the indicator, how can one predict whether the trend will be bullish or bearish (screenshot required)?
In the case of a bullish crossing, the bullish candle must contact the LR line from below and then cross it. As a result, the bullish candle that appears throughout the crossing should be capable of supporting this crossover. This could also be a preparation to a purchase indication.
In the event of a bearish analysis and prediction, the price movement line must cross and continue below the LR line from the above. When predicting a declining trend, the bearish candle must be powerful enough to break the LR line. This could be a sign of a sell signal.
Question 5
Explain how the moving average indicator helps strengthen the signals determined by the linear regression indicator. (Screenshot required)?
The LR indicator is a smoother form of the moving average since it is calculated by calculating the numeral of the variables included. It excludes lags and is more sensitive to market moves. The main issue is that because it is more responsive, it may produce misleading signals, which can be removed using moving averages.
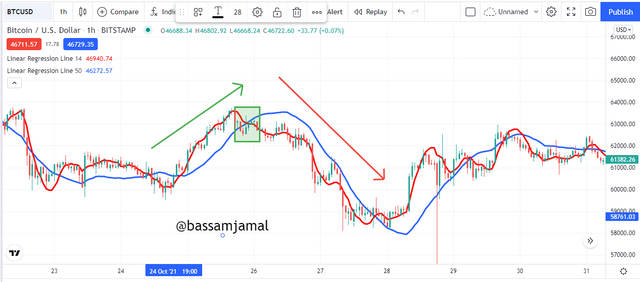
For instance, in the chart beneath, we see a combination of the moving average and the LR.
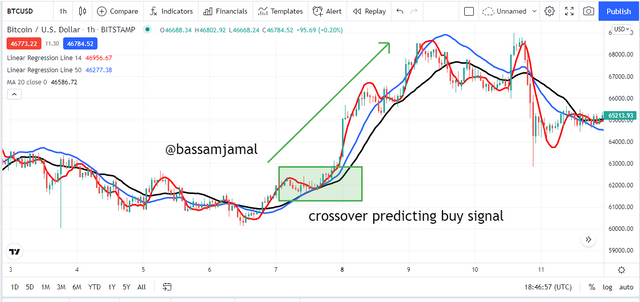
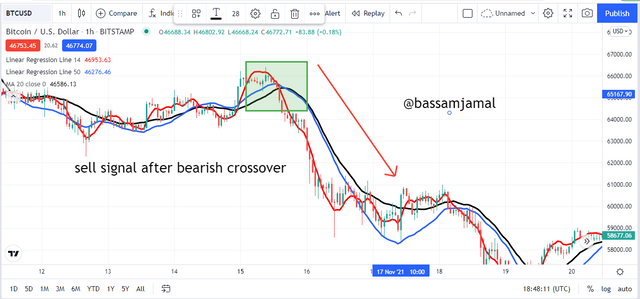
The moving average in the graph shown aids in the verification of the bullish and bearish crossovers, hence eliminating the possibility of incorrect buyers and sellers orders. Similarly, when the moving average and LR indicator are used together, it aids filter erroneous signals due to the responsiveness of the LR and also aids in signal verification.
Question 6
Do you see the effectiveness of using the linear regression indicator in the style of CFD trading? Show the main differences between this indicator and the TSF indicator (screenshot required)?
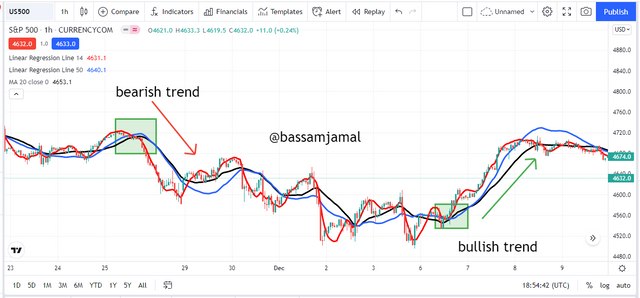
The LR indicator is often used to identify trend direction and changes of direction in CFD trading. It also shows bullish and bearish crosses, as well as the beginning and finish of trend.
The use of the LR indicator in the CFD marketplaces may be seen in the chart below from the US500. Whenever the trend continued and the intensity of the trend in a way, the LR indicator line increased together with the price action, and then when the trend weakened, the sloppy changed until we saw a crossing, identical to the cryptocurrency market.
The main distinctions between the TSF and the Lr indicators.
TSF
Each bar regression in the TSF is evaluated using a process known as the least square fit approach.
The slop is used to compute the regression line's final value.
Long-term investors are more likely to employ it.
The LR is more reactive to price increases.
Lr
- The dependent variable is determined utilising different variables in the case of the LR indicator.
- The slope is not used in the computation of the regression end price.
- Daily traders and scalpers are the most popular users.
- It responds faster than the moving average but not as quickly as the TSF.
Question7
List the advantages and disadvantages of the linear regression indicator?
advantages.
- The smoothed form of the moving average is what it is.
- Moving averages provide more lags than this method.
- It is more attentive to price increases and respond to them.
- If displayed on a graph, it is quite straightforward to grasp.
- It makes identifying the direction of the market, intensity, and reversals a breeze.
disadvantages
- It's only safe to utilize when there's a strong trend.
- It generates a lot of conflicting alerts about market volatility.
- Other indicators, such as RSI or moving averages, can be used to filter misleading signals and corroborate trade indications.
Conclusion.
To summarize, the Linear Regression Indicator is predicated on dependent and independent variables to compute the regression line, which will then be visually shown. The moving average is comparable, except it is more precise and the numbers are square.