Crypto Trading Strategy with Triangular Moving Average (TRIMA) Indicator - Crypto Academy / S6W4 - Homework Post for @fredquantum
Hello wonderful people, how are you today? I hope you're having a fantastic week. I'm ecstatic to be a part of this unforgettable lecture. In this article, I'll share my experience with Crypto Trading Strategy with Triangular Moving Average (TRIMA) Indicator
.jpg)

1. What is your understanding of the TRIMA indicator?
The moving average is a popular trend-based indicator in the cryptocurrency market nowadays. This indicator is a lagging indicator that is calculated using past price data. There are many different types of moving average indicators available today; these indicators are designed as an improvement on the preceding, for example, SMA, EMA, TEMA, and so on. The TRIMA indicator is an enhancement of the SMA indicator. Whenever the SMA indicator was formed, it had several flaws such as trailing behind the value of the asset, responding to the market when it was not essential, resulting in misleading signals, and so on.
The TRIMA indication was created to address the problems associated with the SMA. It is being developed to have a more smooth and clear signal by eradicating any sort of noise from the market. Because the TRIMA indication is a double average with a double smoothed interface, it responds less to unneeded price action and provides a more obvious signal owing to its smoothness.
We understand that the crypto market is very unpredictable and that the only way to limit our losses and maximize our profits is to enter the marketplace time, rather than come to market whenever a price fluctuation appears. The TRIMA indicator may be used to help traders determine whether a market signal is true and when it is bogus. Though no indication is perfect, the TRIMA indicator has shown to be more accurate in terms of providing a correct trade signal.
2. Setup a crypto chart with TRIMA. How is the calculation of TRIMA done? Give an illustration. (Screenshots required).
I'll be utilizing the tradingview website to create a cryptocurrency chart with the TRIMA indicator. Let's start with the fundamentals.
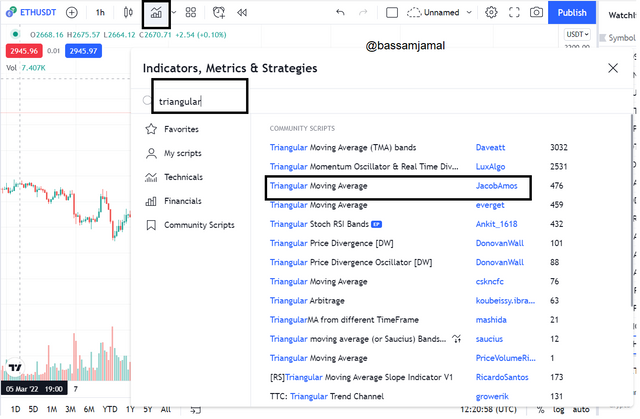
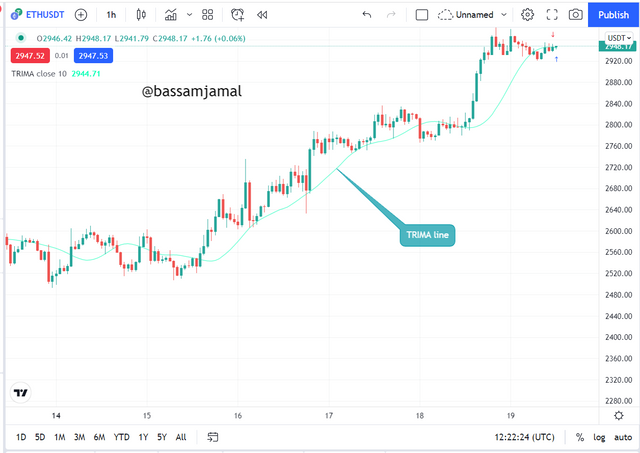
- select any crypto pair click on the indicator icon at the top of the screen, a search bar will appear, then search for the term Triangular moving average, and afterward click on it. The indicator will be added to your chart instantly (see pictures here).
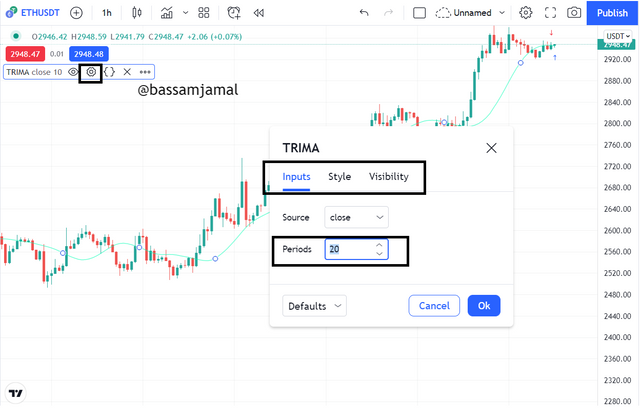
- To adjust your chart, click on the name of the indicator and click on the settings icon. A pop up window will appear with the titles Inputs, Style, and Visibility. In this section, I will adjust the period parameters to fit my trading approach. Please see the image beneath.
Calculations of TRIMA Indicator
Every indication is designed around a mathematical phrase. The TRIMA indication is not an exception to this rule. As previously stated, the TRIMA indicator is calculated using the SMA. This suggests that in order to obtain the TRIMA value, we must first obtain the SMA values and then compute their averages to obtain the TRIMA values. It may be expressed numerically as,
(P1 + P2 + P3 + P4 + P5...Pn) / n = SMA
And
P = Asset Price
P1-5 = The asset's price over 5 periods.
Pn = the most recent price
n = the number of time periods considered
With all this, we can calculate the TRIMA number by gathering the SMA values and averaging them.
TRIMA is equal to (SMA1 + SMA2 + SMA3 + SMA4... + SMAn) / n.
3. Identify uptrend and downtrend market conditions using TRIMA on separate charts.
Because the TRIMA indicator is a trend-based indicator, it may be used to identify the orientation of the trend. While entering any trade, every trader must recognize the market's trend. To utilize the TRIMA indicator for long-term or short-term investing, the trader must first choose an appropriate timeframe that fits his or her ability to trade approach. Short-term traders demand a shorter period with a shorter timeframe, whereas long-term traders want a longer period with a long time frame.
Identifying Uptrends
Whenever the price of an asset is going in an upward manner, i.e. whenever the price is producing persistent higher high and higher low action, the TRIMA indicator will be shown underneath the price movements, indicating that the price is in an upwards. Examine the graph below.
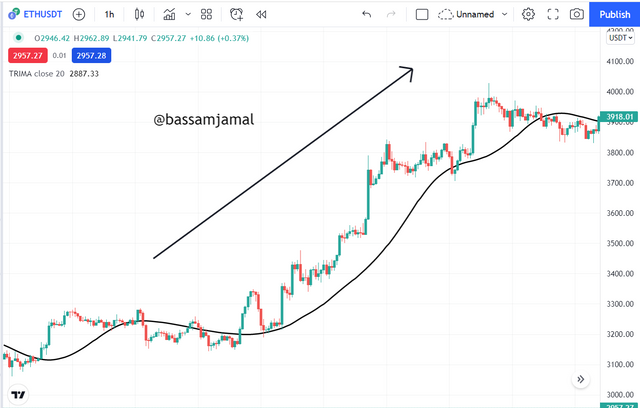
The price of the asset is shown going above the TRIMA signal in the chart above, indicating that the coin is in an uptrend. The TRIMA signal serves as dynamic support to the market action in this case.
Identifying a Downtrend
Whenever the price of the asset is going in a negative manner, i.e. when the price is making a persistent lower low and lower high moves, the TRIMA indicator will be shown just above the price action, indicating that the price is in a downturn. Examine the graph below.
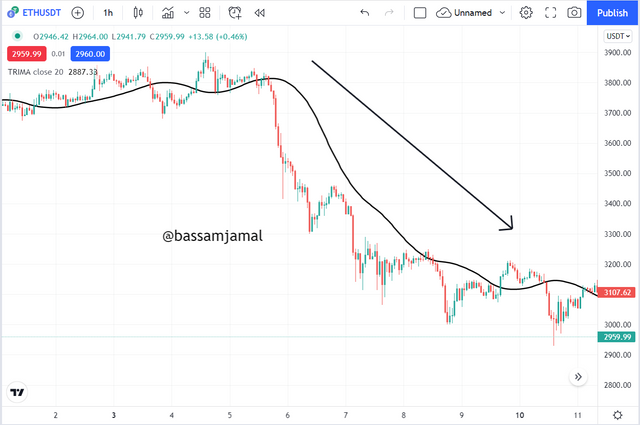
The price of the coin is shown sliding below the TRIMA signal in the graph shown, indicating that the asset is in a downturn. The TRIMA signal serves as a dynamic barrier to the price motion in this case.
4. With your knowledge of dynamic support and resistance, show TRIMA acting like one. And show TRIMA movement in a consolidating market. (Screenshots required).
Traders usually examine the levels of support and resistance since these are the places where they make their profits and halt their losses whenever they initiate a trade. Preferably, a buy entry is made at the point of support, with the take profit placed just above the resistance level and the stop loss placed just below the support level. Similarly, a sell entry is often made at the point of resistance, with the take profit placed below the support level
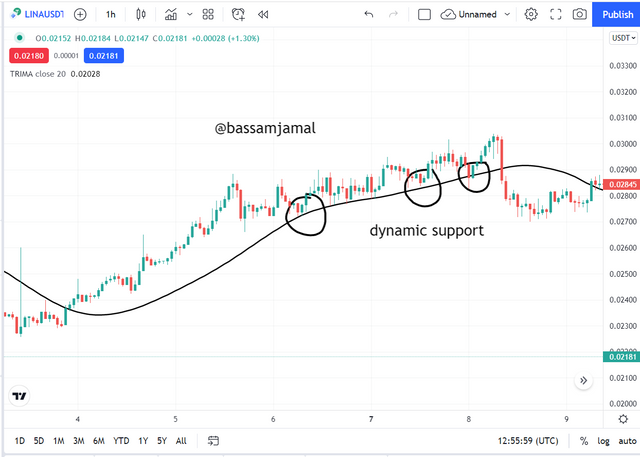
Using TRIMA for Dynamic Support
Whenever the asset's price is in an uptrend, dynamical support is frequently visible. Whenever the price of the asset is retreating throughout this motion, it usually finds support near the TRIMA line. When this pullback occurs, the price reverses and moves upward, in the direction of the beginning trend. Examine the graph below.
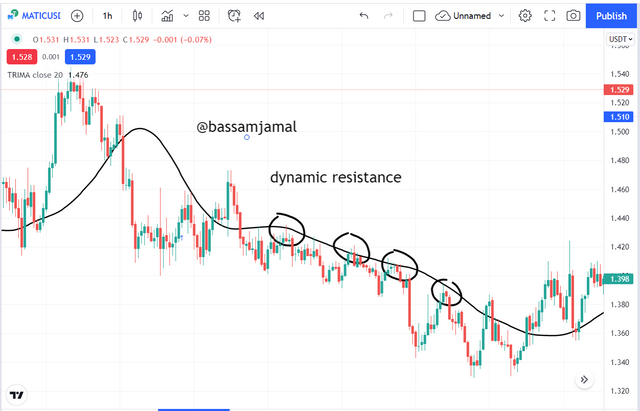
Using TRIMA to Create Dynamic Resistance
The dynamic resistance is frequently visible when the coin's price is falling. Whenever the price of the asset is rebounding during this motion, it usually meets resistance near the TRIMA line. Whenever this pullback occurs, the price subsequently reverses and moves lower.
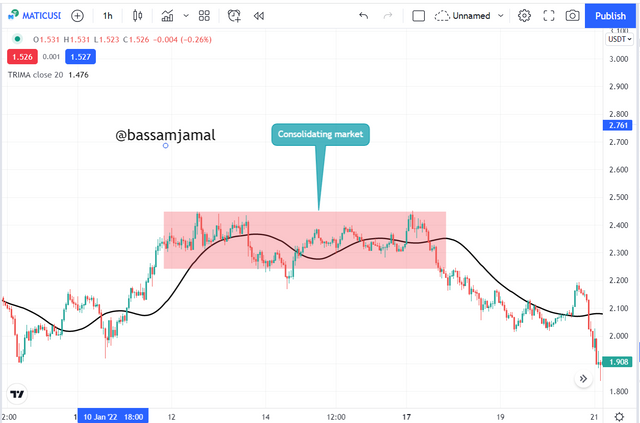
Using TRIMA to Consolidate the Market
A consolidation market, also known as a sideways or ranging market, is one in which the value of the asset doesn't even have a specific pathway. As the price swings down and up, we see horizontal support and resistance.
5. Combine two TRIMAs and indicate how to identify buy/sell positions through crossovers. Note: Use another period combination other than the one used in the lecture, explain your choice of the period. (Screenshots required).
The mixture of multiple TRIMAs indicators of various periods on a graph can assist traders in taking a stance in the uptrend or downtrend via the crossover procedure. Because of the twofold smoothed phase, the TRIMA indicator filters out spurious signals by trailing behind price activity. However, because to its trailing nature, the indicator may provide a hint when the trend is about to terminate.
Periods 15 and 30 will be used here for slow and rapid TRIMA, accordingly. The intersection of these two lines will provide me with a position. Let's have a look at the purchase and sell scenarios below.
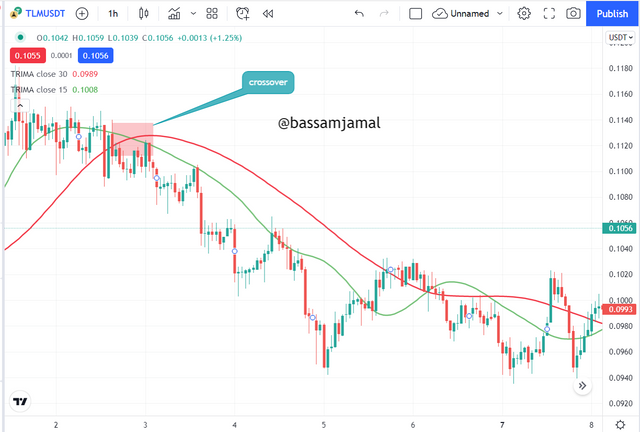
TRIMA Entry Purchase
The asset must be trending in an upward trend for a purchase entry. The TRIMA indicator's shorter period must likewise cross over the TRIMA indicator's quicker period. Whenever this occurs, it indicates that the pattern has shifted from a bearish to a positive direction. Shortly after the crossing, a buy entry with suitable risk management can be taken. Take a look at the image below.
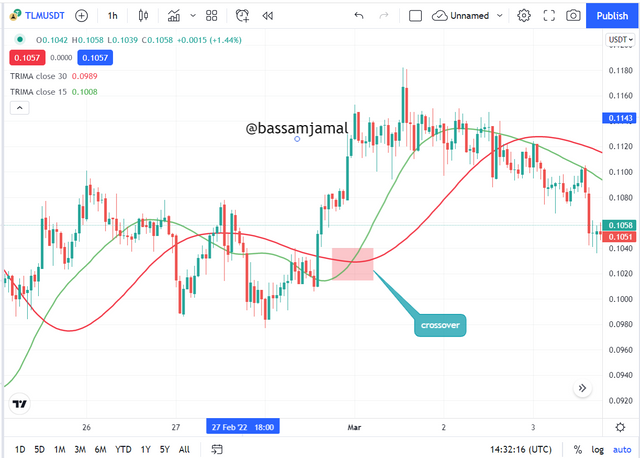
TRIMA is used For selling.
The asset must be trending in a downward motion for a sell entrance. The TRIMA indicator's quicker period must likewise cross over the TRIMA indicator's slower period. When this occurs, it indicates that the trend has shifted from a bullish to a negative direction. With good planning, a sell entry may be taken immediately after the crossing. Take a look at the image below.
6. What are the conditions that must be satisfied to trade reversals using TRIMA combining RSI? Show the chart analysis. What other momentum indicators can be used to confirm TRIMA crossovers? Show examples on the chart. (Screenshots required).
As earlier said, the TRIMA indication is a lagging indicator, and in order to detect a trend direction, we must combine the TRIMA indicator with a leading signal so that investors do not enter the market after the pattern already has reversed. In this part, we will use the RSI indicator to identify the trend reversal zone on the chart. We understand that the RSI indicator reveals oversold and overbought areas or regions, which are potential trend turnaround areas.
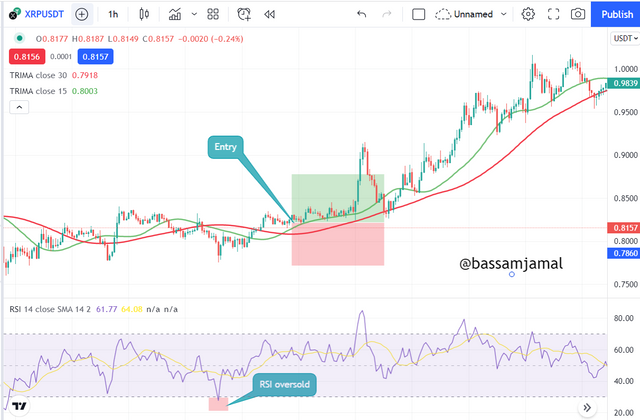
TRIMA Trading Criteria for Bullish Reversal
The following requirements must be followed in order to properly trade a bullish reversal utilizing the TRIMA indicator.
To begin, add two TRIMA indicators, one slow and one rapid, to the chart, as well as an RSI indicator.
To get a bullish reversal signal, keep an eye on the price and make sure it reaches the oversold level during a bearish or consolidation action.
Another sign is when the slower TRIMA line crosses over and moves just above the quicker TRIMA line. When this occurs, we determine that the price has entered an upswing.
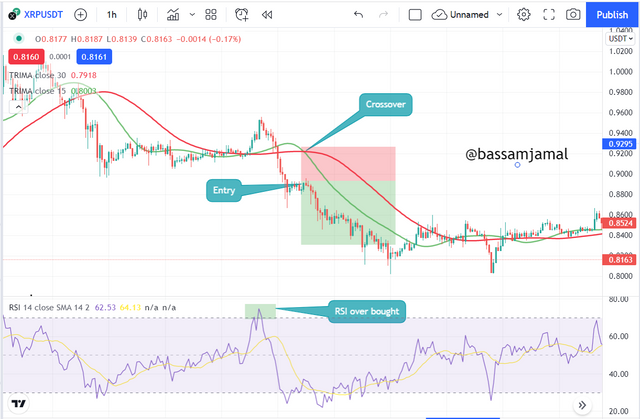
TRIMA Trading Criteria for Bearish Reversal
The following conditions must be followed in order to properly trade bearish reversals utilizing the TRIMA indicator.
To begin, add two TRIMA indicators, one slow and one rapid, to the graph, and an RSI indicator.
For a bearish reversal indication, keep an eye on the cost and make sure it enters the overbought level throughout a bullish or consolidation action.
One sign is when the quicker TRIMA line crosses over and moves above the slower TRIMA line. When this occurs, we determine that the price has entered a decline.
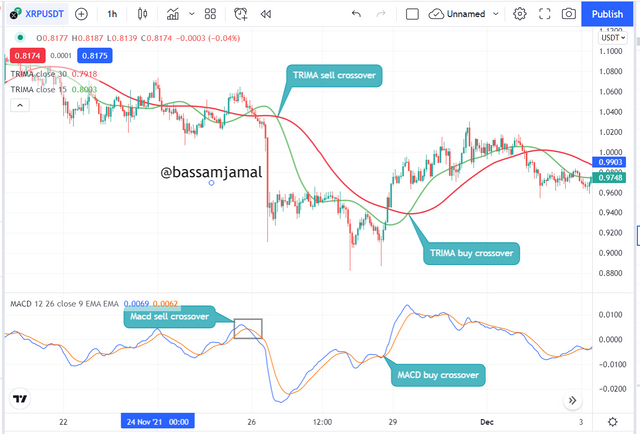
The MACD indicator is used with the TRIMA indicator to confirm trend reversals.
The MACD indicator is another technical indicator that may be used in conjunction with the TRIMA indicator. This indicator is comparable to the TRIMA indicator in that it employs the crossing approach to indicate trend reversal. The MACD indicator is often composed of two EMAs, namely the fast EMA and the slow EMA. Whenever these EMAs cross, a trend is considered to revert to the other side.
Buy Position and Sell Position.
- The slower EMA in the MACD indicator crossed above the faster EMA in the chart below, indicating a trend direction; a verification of this is evident whenever the slower TRIMA line passes above the faster TRIMA line on the graph. When these two confirmations are obtained, a buy entering position may be taken because the trend will undoubtedly proceed upward.
- for sell position The faster EMA in the MACD indicator has crossed above the slower EMA, indicating a trend direction; this is confirmed when the faster TRIMA line passes just above the slower TRIMA line on the chart. When these two confirmations are obtained, a sell entry approach may be taken since this trend will undoubtedly go higher.
7. Place a Demo and Real trade using the TRIMA reversal trading strategy (combine RSI). Ideally, bullish and bearish reversals. Utilize lower time frames with proper risk management. (Screenshots required).
On the tradingview platform, I will conduct the analysis for both the demo trade and the real transaction. The demo transaction will be executed on my tradingview paper trading account, while the real deal will be executed on my Binance exchange site.
Demo Trade.
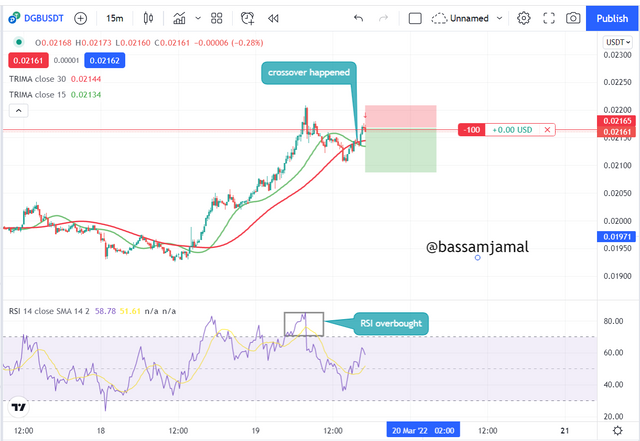
A pair of DGBUSDT was traded in a 15-minute timeframe in the chart above. According to the chart, the asset has reached its overbought zone, and a likely trend reversal is a forecast; also, the faster TRIMA line is shown above the slower one, indicating a negative trend. Before entering my sell trade, I waited for a bearish candle to emerge. Refer to the image above.
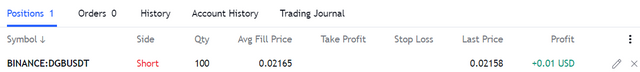
After a few minutes, I reviewed my trade and noticed that it is trending downhill as planned. When I examined the deal, I was able to see confirmation of the profit.
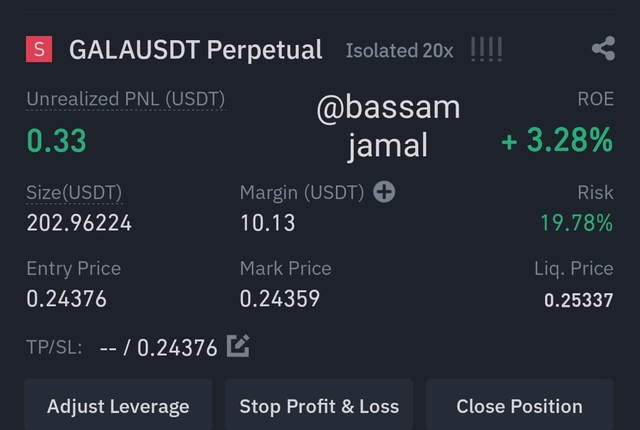
Real Trade.
A pair of GALAUSDT was traded on a 3-minute timeframe, according to the data above. According to the chart, the asset has reached its overbought zone, and a likely trend reversal is a forecast; also, the slower TRIMA line is shown below the faster one, indicating a negative trend.
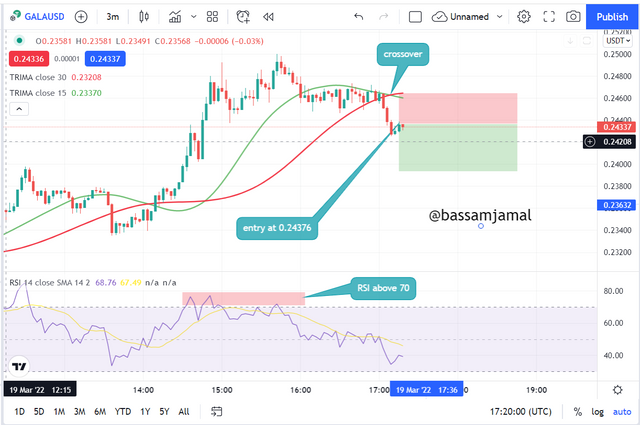
After a few minutes, I reviewed my trade and noticed that it is trending downhill as planned.
8. What are the advantages and disadvantages of TRIMA Indicator?
TRIMA Indicator advantages
The following are the benefits of using the TRIMA indicator:
The indicator smoothes price fluctuations in the market by reducing noise or erroneous signals.
When contrasted to other moving averages such as the SMA, the TRIMA indicator produces a clearer indication.
Knowing how the moving average works allows the TRIMA indicator to be used to spot market trends just by glancing at its location on the chart.
When there is a cross between the two TRIMA lines, positions are placed on a trade. This is helpful since the reasoning is simple enough for anybody to comprehend, including newcomers to the crypto realm.
TRIMA indication disadvantages
The following are the drawbacks of using the TRIMA indicator:
- The indicator is a lagging indicator, which implies that a trend may have occurred long before it indicates it, causing traders to lose critical market positions.
- TRIMA, like any other indicator, cannot be utilized as a standalone tool to make trading decisions since it has the potential to provide misleading signals. As a result, the indication must be coupled with another indicator.
Conclusion.
As previously said, the TRIMA indicator is a trend-based indicator that is a more advanced version of the SMA. The indicator was created to address the SMA's failings in terms of lagging and rough signals. The TRIMA indicator is the double-smoothed indication that shows a comprehensive and more trustworthy signal about the marketplace by reducing noise caused by tiny fluctuations in the asset's price. As we've seen, the indicator is used to identify areas of support and resistance in both trend and ranging markets.
Unfortunately @bassamjamal, your article contains Spun/plagiarized content.
The Steemit Crypto Academy community does not allow these practices. On the contrary, our goal is to encourage you to publish writing based on your own experience (or as per the mission requirements). Any spam/plagiarism/spun action reduces PoB's idea of rewarding good content.
Note: Any other try will mute you in the academy.