Crypto Trading Strategy with Median Indicator - Steemit Crypto Academy - S6W4 - Homework Post for Professor @abdu.navi03
Hello wonderful people, how are you today? I hope you're having a fantastic week. I'm ecstatic to be a part of this unforgettable lecture. In this article, I'll share my experience with Crypto Trading Strategy with Median Indicator.


1-Explain your understanding of the median indicator.
Investors in the cryptocurrencies industry nowadays strive to determine the path of the changing market before taking any position in the market, whether it is a buy entrance strategy or a sell entrance strategy. The median indication is a trend-based indicator, which means it displays the direction of a certain market trend. With it in place, the investor considers it significantly simpler to invest by using indicators because it provides knowledge regarding the current overall market at any moment in time.
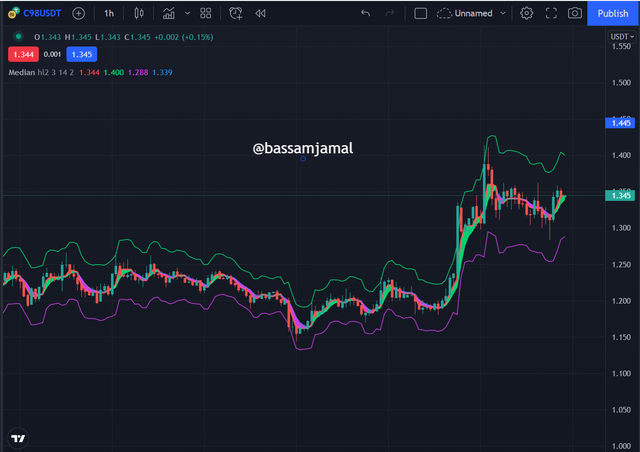
There is something resembling an oscillator line that moves with the price and is coloured green and purple. The green colour signifies the buy point, while the purple colour denotes the sale point.
Whenever the current valuation continues above the median Indicator, it indicates an upswing and a suitable time to begin a buy trade.
Whenever the current price continues below the median Indicator, we have a decline and can begin a sell option at a suitable time.
Here is how Indicator looks.
2-Parameters and Calculations of Median Indicators. (Screenshot required)
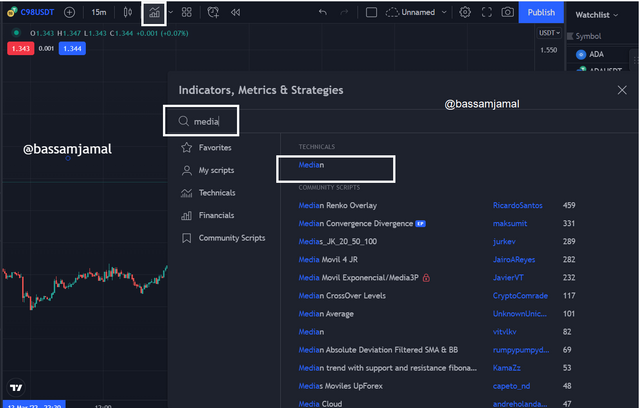
To view the median indicator's parameters, go to the tradingview.com website to add and show the indicator's settings. To begin, follow the steps outlined here.
- Go to the indicator panel and tap on it; a dialogue box will emerge; in the search bar, enter the median as seen in the picture beneath.
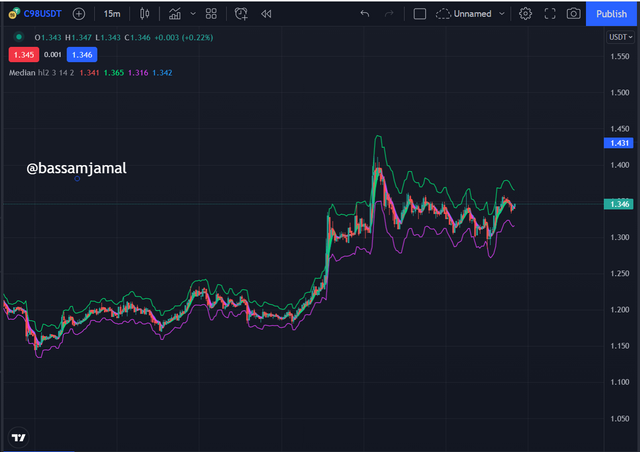
- When you tap on the indicator, it will be displayed to your chart, as shown below.
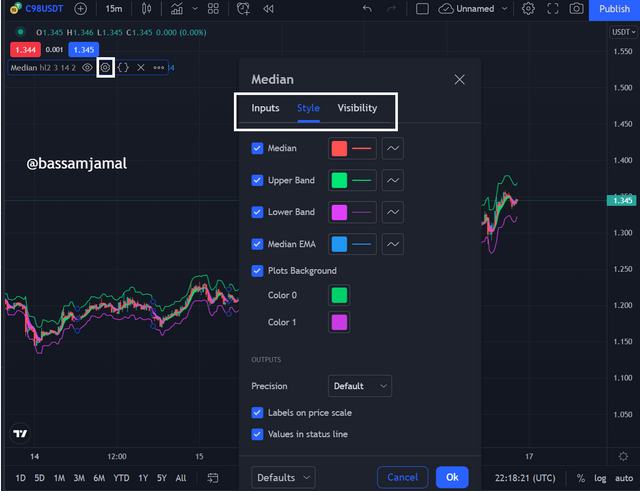
- To customize the indicator to your trading plan after successfully inserting it, however over the label of the indicator on the chart, select the gear icon, and then click on it. A pop-up menu appears, and you may then alter the input, style, or visibility based on your investment strategy. Please see the screenshot beneath.
For Calculation
Because the median indicator calculations involve the median value and the EMA value, we will examine how to compute both the median value and the EMA value and combine them to create the median indicator.
Highest price + Lowest price / 2 Equals Median Value
EMA Value = Closing Price * Multiplier + EMA (Previous Day) * (1x Multiplier)
Here;
ATR percent change multiplied by the median indicator ( Median Value, EMA Value)
If the EMA percent change is more than the median value, the colour purple is used.
If the EMA percent change is more than the EMA value, the colour is green.
Upper band = median length multiplied by (2ATR)
Lower band = Median length minus (2ATR)
3-Uptrend from Median indicator (screenshot required)
As previously said, the median indicator is a trend-based indicator, which means it tracks the market trend. When we notice the median just above the EMA value, we deduce that the pattern is an upswing, and verification of this is commonly visible by the green cloud that will emerge as a consequence of that. Whenever the green cloud appears, it indicates that the trend is positive, and a purchase trade may be made. Let's have a look at the chart beneath for further details.
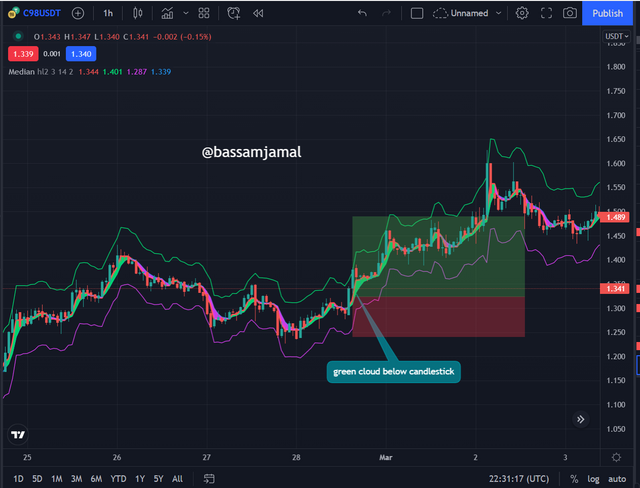
Checking at the image above, you'll note that the green cloud signals an upswing. In other words, the trend is trending higher. At this time, buyers join the market and take positions. The existence of a green cloud indicates that the trend has shifted from a bearish to a positive trend.
4-Downtrend from Median Indicator (screenshot required)
Signals can be found based on the colour of this strip. When the oscillator line goes green, it represents a purchase position, and when it turns purple, it suggests a selling point. As a result, we must wait until the precise moment when the band becomes purple.
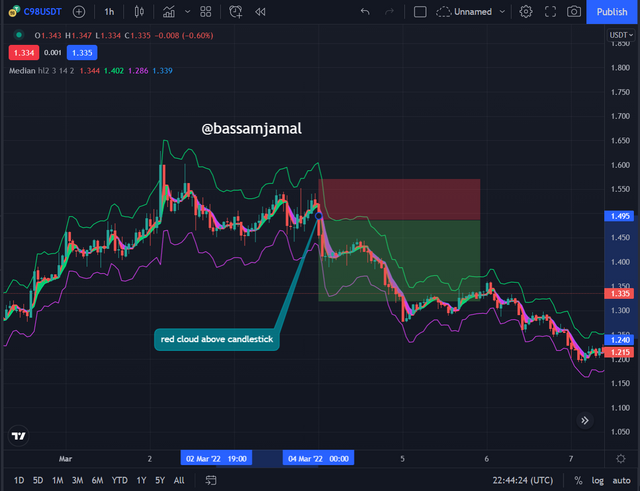
As you can notice in the above picture, I have placed my entry point in which the Purple band is developing on the chart, indicating that the price will move lower. We may set our take profit level till the purple band disappears, and our stop loss level can be set slightly above the resistance level.
5-Identifying fake Signals with Median indicator(screenshot required)
We understand there is no evidence that it detects or forecasts 100 per cent information with no false signals. Because of the market's tremendous volatility and changes, any indicator generates misleading indications. We add more indications in order to detect and filter out these erroneous signals. To identify and filter wrong signals on crypto charts, I would use the RSI indicator in conjunction with the Median Indicator.
As we discussed in earlier courses, the RSI indicator is a form of volume-based indicator that aids in recognising the state of the marketplace of commodities that are either overbought or oversold.
Basically what is RSI?
When the price of an asset falls below the RSI 30 level, it indicates an oversold state and a likely positive turnaround in the asset's value. Likewise, whenever the price of an asset passes above the RSI 70 level, it indicates an overbought state and a likely negative turnaround in the asset's price.
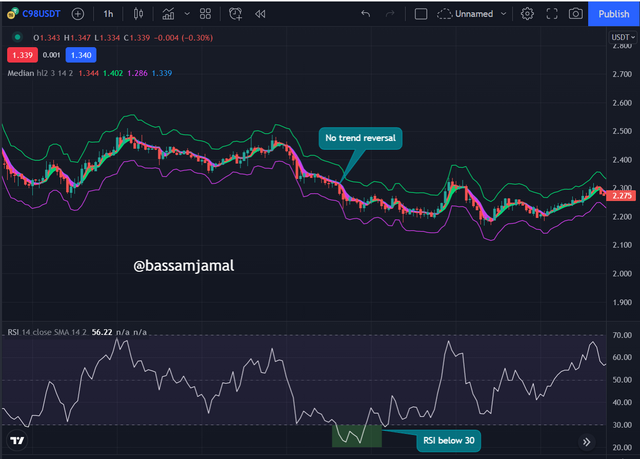
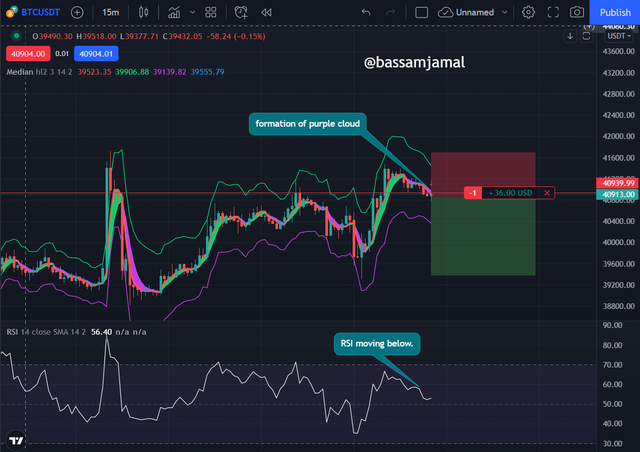
The chart above plainly shows that the RSI indicator is trading below the RSI 30 level, suggesting an oversold position and the possibility of a positive trend reversal. On the alternative, we can see from the Median Indicator that the purple colour pattern has persisted, indicating a persistent bearish trend in the asset's price action..
6. Open two demo trades, long and short, with the help of a median indicator or combination that includes a median indicator (screenshot required)
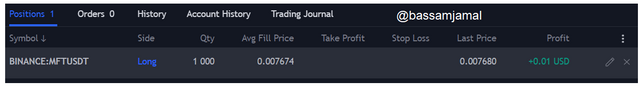
Buy Trade.
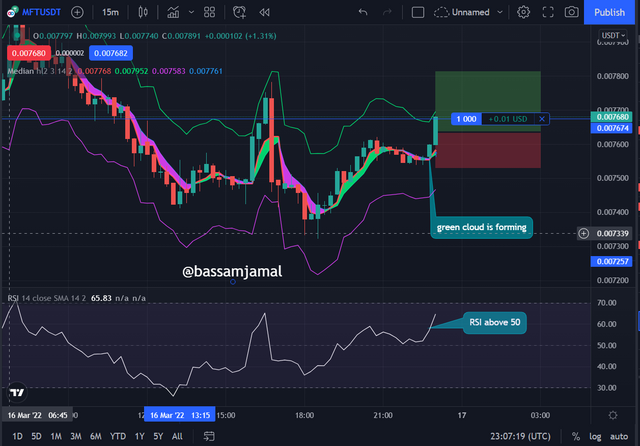
When I looked at the MFTUSDT chart, I noted that the price was in a decline, as indicated by the median indicator with a purple cloud. After a time, the cloud became green, with a bullish engulfing candlestick pattern. This indicates a trend reversal and a chance to enter a purchase position.
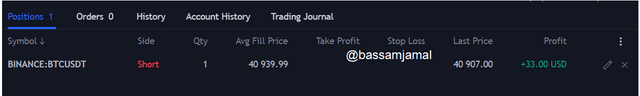
Sell Trade.
I detected a trend reversal on the BTCUSDT chart when the median cloud moved from green to purple. The shift indicates a trend reversal from bullish to bearish, as well as a chance to enter a sell position. As seen here, I started a sell option.
CONCLUSION.
In this research, we studied the median indicator and how we may utilise it to generate good trading signals. The indicator is a trend-based indicator that can identify a trend reversal from positive to negative when the median cloud moves from green to purple.
Indicators are not usually completely correct. To screen out erroneous signals, we must integrate indicators with other basic analysis techniques. To provide reliable market indications, we integrated the RSI with the median indicator.