Ultimate oscillator indicator- Steemit Crypto Academy- S5W8-Homework post for @utsavsaxena11
.png)
Hello everyone, here I am once again in another great week in the Steemit Crypto Academy.
Here we are once again in week 8 of the fifth season, it's been a lovely season thus far. on today's topic, I will be giving insight on one of the technical indicators known as "Ultimate Oscillator Indicator", the course was tutored by professor @utsavsaxena11, you can as well join me and study from the Page.
Below is my submission to the assignment, Stay on, and wish u happy reading!!
Question 1 - What do you understand by ultimate oscillator indicator. How to calculate the ultimate oscillator value for a particular candle or time frame. Give a real example using chart pattern, show complete calculation with accurate result.
The Ultimate Oscillator Indicator is a specialized indicator having a place with groups of oscillators indicator, the ultimate oscillator developed by Larry Williams, whereby Creating this indicator he was able to resolve the issue of bogus signal traders gets from oscillators indicator which is the main issue of numerous different oscillators.
The Ultimate Oscillator moves between the value 0 and - 100, giving knowledge into the shortcoming or strength of a market.
The Ultimate Oscillator indicator capture data based on the present moment, middle term, and long haul value activity into one oscillator and endeavors to give overbought and oversold readings, and as well gives possible trade signal, and gives affirmations of value activity just as divergences that would caution of future value inversions to traders.
In one word, the ultimate oscillator indicator is utilized to signal overbought/oversold levels, market divergence, and giving trade signals.
Adding Ultimate Oscillator to a Chart
Launch the Platform tradingView, select the market pair of your choice, then on the chart you select Indicator, then search the tab Ultimate Oscillator afterward, select the suggestion, and double click to have the indicator displayed on the chart.
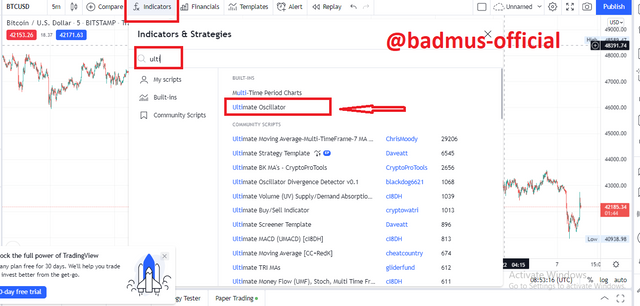
- The Indicator Displays on the chart.
From the image above we could see the indicator already displayed on the chart as it displays the current value at 52.3, which I will ve showing later on how the indicator value is been calculated and as well how we could read the market mood with the indicator values.
The Calculation for the Oscillator is quite tricky, but can be followed in the simple format as follows;
First thing first, we find the Buying Pressure and True Range.
Buying Pressure(BP) = Current Close – Minimum (Current Low or Previous Close).
Then the True Range goes as
True Range (TR) = Maximum (Current High or Previous Close) – Minimum (Current Low or Previous Close)
After getting the BP and True range, we tend to use the Result in determining our Average(7,14 and 28) as follows;
Average7 = Sum of BP for the past 7 days/Sum of TR for the past7 days
Average14 = Sum of BP for the past 14 days/Sum of TR for the past 14 days
Average28 = Sum of BP for the past 28 days/Sum of TR for the past 28 days.
After these formulas are then derived, we input the value to determine the current value of the Oscillator
Ultimate Oscillator = 100 x [(4 x Average7) + (2 x Average14) + (1 x Average28) / ( 4 + 2 + 1)]
There goes our Formular for determining the value of the Oscillator, but when trading, traders don't need to carry out the calculations as the Software embedded in it does the calculation in a true value.
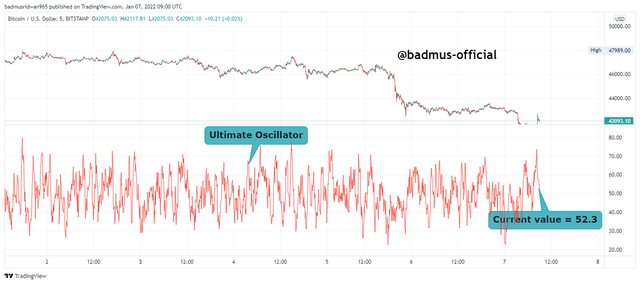
For this task, I will be showing a real example with the BTCUSDT chart showing how the calculation is made using the A7, A14, and A28.
The first thing first is to determine the periods,
Now, we find the BP and TR for the past 28 periods, we recall the formula for calculating BP and TR as ;
Buying Pressure(BP) = Current Close – Minimum (Current Low or Previous Close).
True Range (TR) = Maximum (Current High or Previous Close) – Minimum (Current Low or Previous Close)
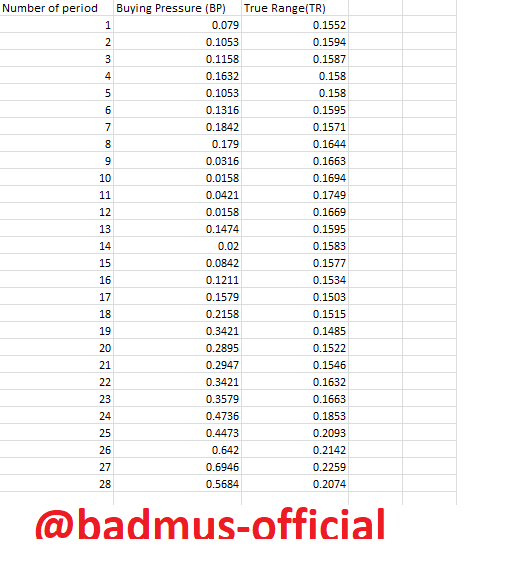
The Table shows the Correspondence value of BP and TR in the past 28 days.
Now, that we have the BP and TR, we can determine the A7, A14, and A28.
Average7 = Sum of BP for the past 7 days/Sum of TR for the past 7 days
Average 7 = 0.884 / 1.1059 = 0.7992.
Average 14 = Sum of BP for the past 14 days/Sum of TR for the past 14 days
Average 14 = 1.2261 / 2.2656 = 0.5897.
Average 28 = Sum of BP for the past 28 days/Sum of TR for the past 28 days
Average 28 = 6.3673 / 4.7054 = 1.3532
Now that we have gotten the necessary details, let's proceed to calculate the Ultimate Oscillator Value.
Ultimate Oscillator = 100 x [(4 x Average7) + (2 x Average14) + (1 x Average28) / ( 4 + 2 + 1)]
Ultimate Oscillator = 100 x [(4 x 0.7992) + (2 x 0.5897) + (1 x 1.3532) / ( 4 + 2 + 1)]
Ultimate Oscillator = 100 x [(3.1968) + (1.1794) + (1.3532) / ( 4 + 2 + 1)]
Ultimate Oscillator = 100 x [(5.7294) / ( 7)]
Ultimate Oscillator = 100 x 0.4092
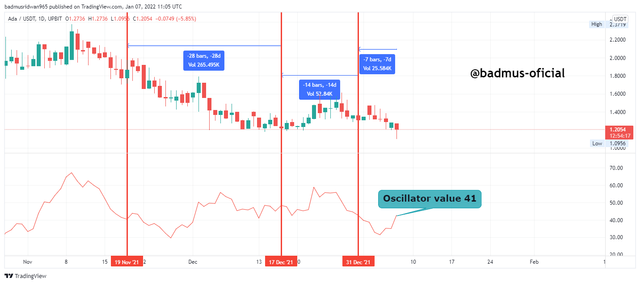
Ultimate Oscillator = 40.92 approximately to 41
Question 2 - How to identify trends in the market using an ultimate oscillator. What is the difference between an ultimate oscillator and a slow stochastic oscillator.
Just like I mentioned earlier, that the Ultimate oscillator is quite helpful when identifying a market trend in a scenario of Bullish Or Bearish trends.
Now, I will be showing how to confirm a trend using the Ultimate Oscillator.
Bullish Trend
The Ultimate Oscillator will have a value range somewhere in the range of 30 and 100 before a market could be considered to be bullish. as the basic qualities are frequently 30 for over-sold and 70 for over-bought. Notwithstanding, we get to witness the true affirmation of a bullish trend when we get to see the Oscillator moving in an upward direction as it crosses the value of 30 upward, wherein in this case others are expected to fall in causing the market to continue moving high.
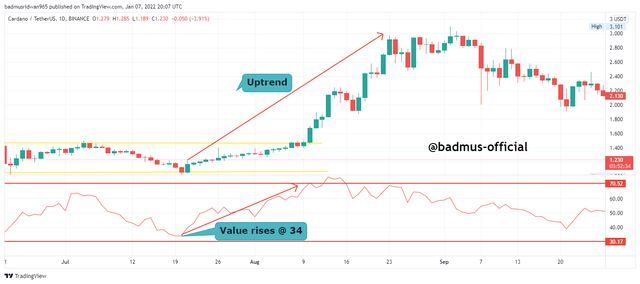
From the image above, we get to truly confirm that the market is in bullish as we saw the Ultimate Oscillator trending above the 30 UO, and as well we get to see that the market just shows a recovery from bearish where in this case, there is a high probability that more buyers will move in causing the market to move higher high.
Bearish Trend
For a Bearish Trend, The Ultimate Oscillator will have a value range somewhere in the range of 0 and 40 before a market could be considered to be bearish. we get to witness the true affirmation of a bearish trend when we get to see the Oscillator moving in a downward direction as it crosses the value of 70 downward, wherein in this case, others are expected to fall out of the market, causing the market to continue moving low.
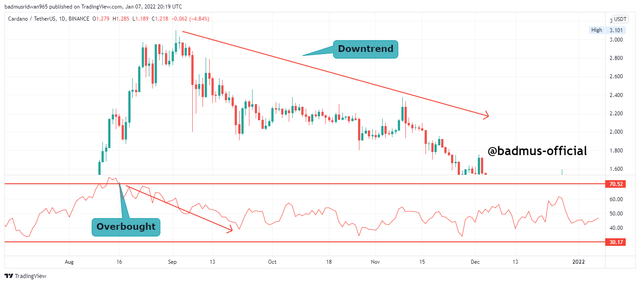
From the image above, we get to truly confirm that the market is bearish as we saw the Ultimate Oscillator trending above the 70 UO, and as well we get to see that the market just shows a recovery from bullish as the indicator breaks below the 70 value, wherein this case, there is a high probability that more sellers will move in causing the market to move Lower next.
The Difference between the Slow Stochastic oscillator and the Ultimate Oscillator is quite insignificant but still needed be pointed out thou, as we know that the Ultimate Oscillator depicted signal using one line only, and the level at which the Ultimate Oscillator work is at 70 for overbought signal and as well 30 for Oversold signal, but this is not the case in the Slow Stochastic as the Slow Stachistic depicts using two periods which are Smooth K and SmoothD, the indicator as well uses two-line to depicts its signal instead.
The Slow Stochastic depicts overbought when the oscillator is at 80 value, wherein that case we get to witness the smoothK plot moving ahead of the SmoothD plot and as well it depicts oversold when the market crosses downward to 20 wherein thus case, we get to see the SmoothD moving ahead the SmoothK period.
Image Illustration Below:
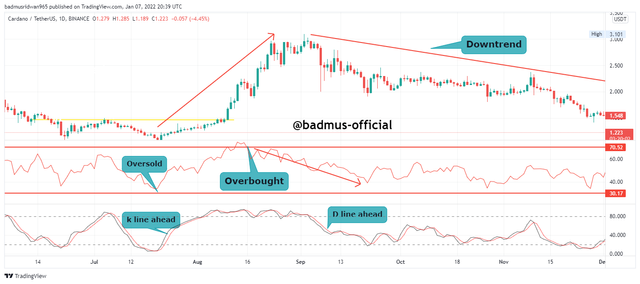
The chart analysis above shows a clear illustration of the differences between the slow Stochastic indicator and the Ultimate Oscillator.
Question 3 - How to identify divergence in the market using an ultimate oscillator, if we are unable to identify divergence easily then which indicator will help us to identify divergence in the market.
Firstly, let me run you briefly on what a divergence is, Divergence is a scenario whereby the price activity of an asset moves in an opposite direction with the indicator, in this case, a reversal is expected to occur next or might as well depict that the current trend is now consolidating and probably not in phase.
Bullish Divergence:
Now, let me show you how you could identify a bullish divergence using the Ultimate Oscillator,
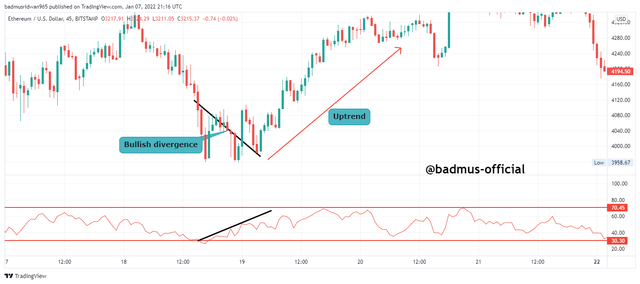
From the image above, we could identify a bullish divergence in a scenario whereby the market is consolidating whereas the Ultimate Oscillator is already trending bullish, so in this case, the divergence can be used to anticipate that the market will pick a bullish direction next.
Bearish Divergence
A bearish divergence is found in the market in a situation whereby the market is trending bullish or rather consolidating, but the technical indicator is already signaling a bullish trend instead.
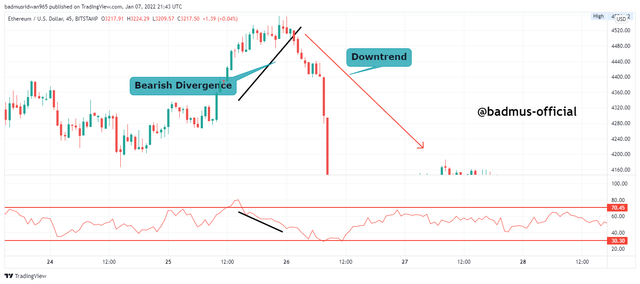
As seen from the image above, we could identify a bearish divergence in a scenario whereby the market is moving in an uptrend, whereas the Ultimate Oscillator is already trending bearish, so in this case, the bearish divergence can be used to anticipate that the market will pick a bearish direction next.
if we are unable to identify divergence easily then which indicator will help us to identify divergence in the market
To identify the divergence, we could as well use other indicators such as the Stochastic indicator to easily anticipate the direction in which the market is moving to give an advantage to traders.
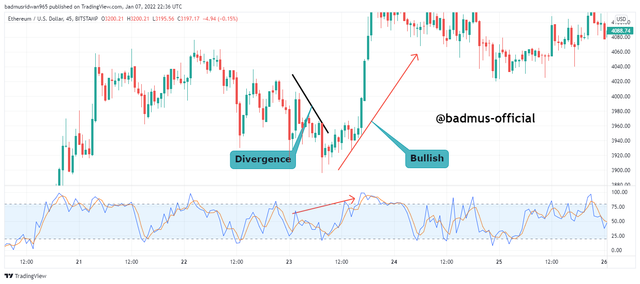
we could see the divergence from the chart above with the stochastic oscillator as the market activity is depicting a downtrend, whereas the Stochastic oscillator is already picking the uptrend race, which after all, the market picks the same direction as the indicator.
Question 4 - what is the 3 step- approach method through which one can make entry and exit from the market. Show real examples of entry and exit from the market.
One of the major use of the ultimate oscillator is to know which level to sell and buy whereby, we could take these precautions using the following criterion.
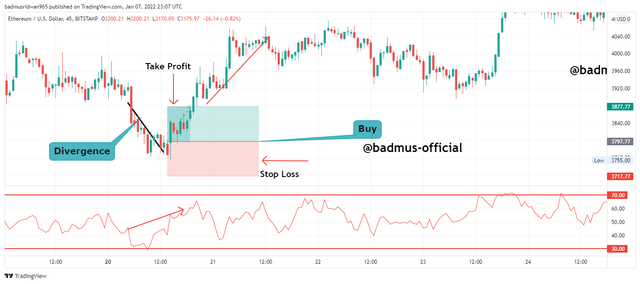
Buy trade - entry
Criterion 1 - identify the bullish divergence, in a sense whereby we witness the market activity in bearish and the Ultimate Oscillator indicator as already picked the bullish trend, at that point is our entry.
Criterion 2 - The last divergence of the indicator must fall below the 30 value whereby we get to be sure that buyers are now ready to take charge of the market.
- Criterion 3 - the last criterion is to make sure that you make an entry when the ultimate oscillator has risen above the divergence.
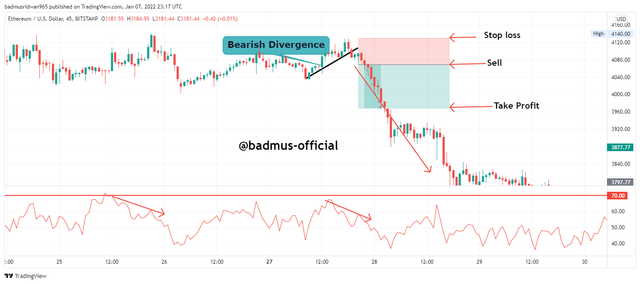
Sell trade - entry
Criterion 1 - identify the bearish divergence, in a sense whereby we witness the market activity is bullish and the Ultimate Oscillator indicator has already picked the bearish trend, at that point is our Sell entry.
Criterion 2 - The last divergence of the indicator must fall below the 70 value whereby we get to be sure that sellers are now ready to take charge of the market.
- Criterion 3 - the last criterion is to make sure that you make an entry when the ultimate oscillator has risen below the divergence.
Question 5 - What is your opinion about the ultimate oscillator indicator. Which time frame will you prefer how to use the ultimate oscillator and why?
In my own opinion, I had better prefer to add other oscillator indicators to the Ultimate Oscillator simply because the indicator sometimes might depict signal late, apart from these critics, I found the indicator to be spectacular.
As the indicator gives a signal based on the Average calculation of the previous 28 days makes it more trustworthy in a scenario that the indicator gives signal value out based on the Buying pressure and true range, whereby with this, traders can easily know the amount of the value and as well predicts the movement sooner.
The Time frame I had to prefer the Oscillator on is the daily Time Frame, whereby with that I get to know the true range easily by myself especially someone like me who trade daily, with the timeframe, I get to know the exact mood the market is currently with the help of Ultimate Oscillator.
Here comes the submission to my assignment on the topic Ultimate Oscillator which I couldn't agree less that I have learned a great deal of trading strategy and as well perfect indicators to include on a chart from the professor this season, It is a privilege to participate in your courses.
The Ultimate Oscillator is a technical indicator created by one of the legends of oscillator known as Larry Williams, he created the oscillator to filter out bad signals which most oscillator has, unlike other oscillators, these particular one uses calculation range to depict the oscillator movement which traders then use this to take their positioning in the market.
The Oscillator depicts overbought when the value is around 70 above and as well depicts oversold when the value is below or equals to 30, with the oscillator we can as well use the divergence to predict the next market movement.
Special regards to professor @utsavsaxena11
Steemit Cryptography Student: