Leverage with Derivatives Trading Using 5 Mins Chart - Steemit Crypto Academy S6W1 - Homework Post for Professor @reddileep
.png)
Hello everyone, I welcome you all once again from the academy season break, its been a while since we all participate in the crypto academy courses. Season 6 comes with a new idea where we get to learn more about cryptocurrency trading this time, which is great as it tends to teach us more about how we get to be better crypto traders.
On today's task, I will be giving insight on the course tutored by professor @reddileep regarding "Leverage Trading Using 5 min chart", here on, I will be explaining what leverage trading is, and as well the benefits that come with it and we also got to know the perfect analysis to make before carrying a leverage trading..HAPPY READING!!

Leveraged trading is one part of cryptocurrency trading strategies as we know there are multiple ways of trading cryptocurrency where we have spot trading as the case whereby we trade based on market decision nothing more, nothing less, But today's focus will be on Leverage Trading.
Just as the Term "Leverage" Implies using your position or influence for the advantage of something you plan on gaining from, now in this case, traders are leveraging their position on an exchange with the idea of getting 2x,3x benefits in returns.
Leverage trading involves using some additional assets from an exchange to be included in your trade, at this point, traders borrow some funds with the idea of making additional investment in return, when you leverage 2x, you are using twice of your capital(your initial investment) and so goes on determining the (number of investment you plan on leveraging - nx).
Let me make a practical example of leverage trading, for instance, I want to execute a trade of $300, then I decided to leverage 4x, which means my trade investment will be $1200 at the moment of carrying my trade, I get to borrow this asset from an exchange with the involvement of little fee, You should know leveraging doesn't come free, you pay some additional fund known as interest, just as seen with banks when you request for a loan, regardless, there is an interest that comes with it.
Leverage comes with high risk but as well the higher the risk, the higher the returns are, traders got to be careful when making this decision of leverage not to leverage more than you can avoid losing, as this might cause a great effect on traders accounts.
Here, I will be explaining some benefits that come with Leverage Trading.
- Additional Profits - When Making use of leverage trading, traders get to earn additional profits when compared to trading with their initial investment.
Ability to borrow funds - This as said earlier, that in leverage trading, users get to use their influence to get to some assets by borrowing, as users with little capital such as $100 can leverage 10x and trade $1000 on a trade which would increase his profit level.
Low-Interest - Leverage trading includes borrowing, and these borrowed assets come with low interests in returns as this can enable users to trade without the fear of giving all the returns as interests.
Diversifying - Diversifying means the ability to run two or three things at a time without waiting for one to pass before you move to another, this comes as a benefit in leverage trading as traders can leverage multiple sources at a time in a sense that traders get to run multiple trades at once without just focusing on one which this can as well earn some additional profits to the trader.
Here I will be listing some disadvantages of Leverage trading
High Exposure to loss - When making leverage trading you tend to be exposed to lose all your assets within just some period as the loss weight depends on the amount you leverage as well, for instance, if you are to make 2x profit on 2x leverage, you are also exposed to make 2x loss on the 2x leverage,i.e the greater the chance of reward, the greater the chance of loss.
High Risk - There is a high level of risk that comes with leverage trading that if one is not careful enough, one will eventually run ruined without proper analysis or precautions.
Not for beginners - Leverage trading is a no-go area for beginners with little knowledge of crypto trading understanding.
Requires High Technical Analysis- You cant jump into leverage trading without some proper analysis on the market you plan on trading on, as there gets to be volatility in the crypto market, so without proper analysis one can make a wrong decision at the wrong time of execution.
Before we consider making leverage trading there are some indicators we get to consider before execution of the trades, below, I will be analyzing some basic indicators we get to include before carrying a leverage trading.
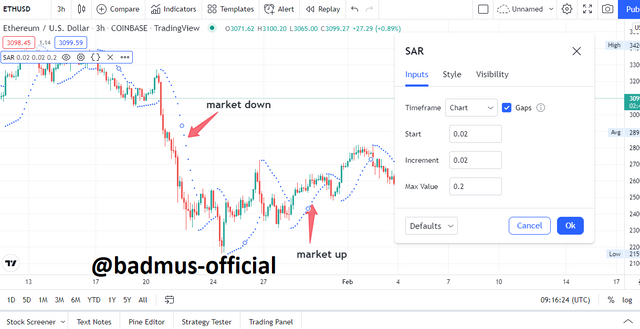
1- Parabolic SAR:
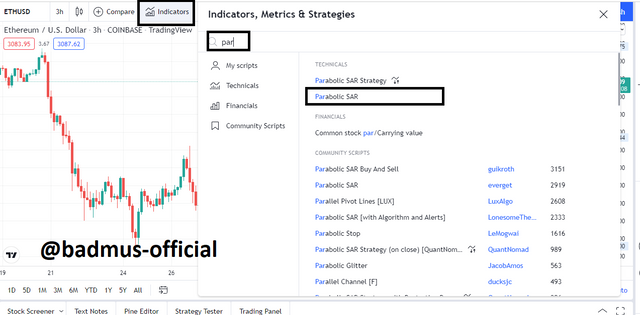
The Parabolic Sar is one of the common indicators used to analyze a trend and market activity as the indicator displays signals using dots, the SAR confirms the market is Up when the dots are moving below the market price and as well confirm a downtrend market when the dots are traveling above the market price. The image below is the default of the Parabolic Sar on the market of ETHUSDT.
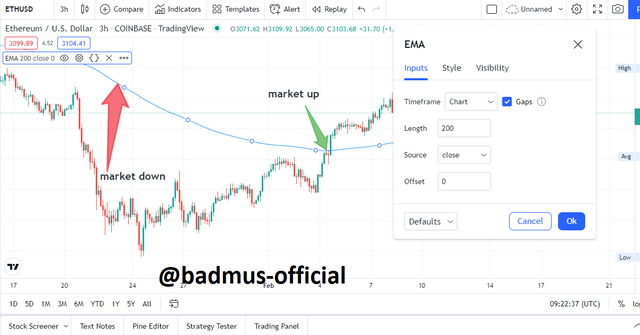
2 - Moving Average Exponential:
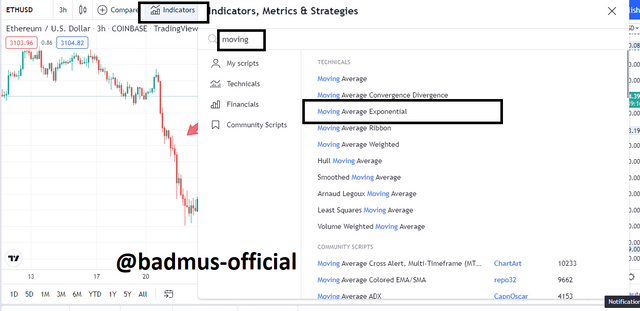
The Moving Average Exponential is well used as a basic indicator that is easy to understand as it indicates signal within the prescribed length of time, when the EMA 200 is moving above the market price, the market is considered to be a bearish market and as well when the EMA200 is moving below the market price, the market is considered a bullish market. The indicator depicts the average price of buyers and sellers in the market.
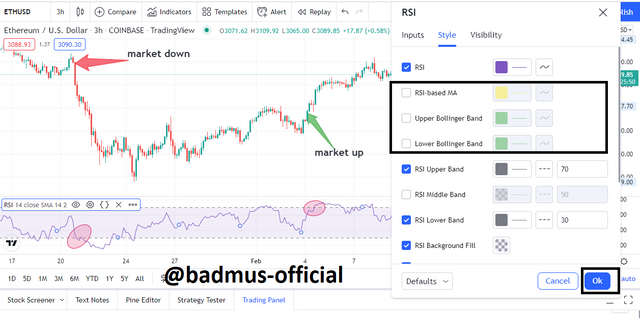
3 - Relative Strength Index(RSI):
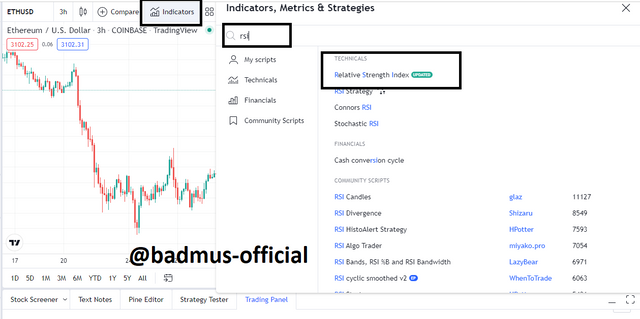
The Relative Strength Index is also known as RSI can be used to know the position of the market, the indicator depicts a signal in a sinusoidal wave, it compromises three bands which are Upper, middle, and lower band, these bands are within the range of 70,50 and 30 respectively. when the market crosses the middle band to the top band at range 60 the market is considered bullish, but when the indicator crosses down below 30(lower band), the market is considered to be bearish.
Now that we have a clear understanding of basic indicators to include when making leverage trading, let me show how we can make a perfect entry for buy and sell using the special strategy.
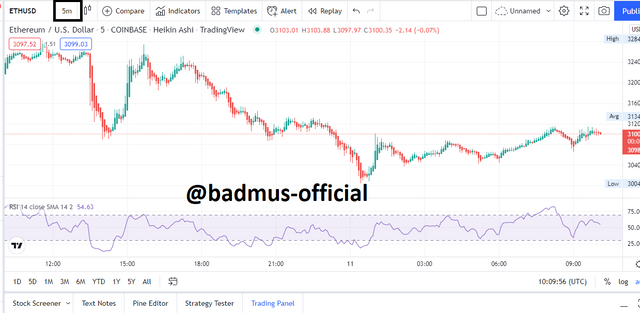
The first thing to do is to have our chart displayed with Heikin Ashi instead of the default candlestick.
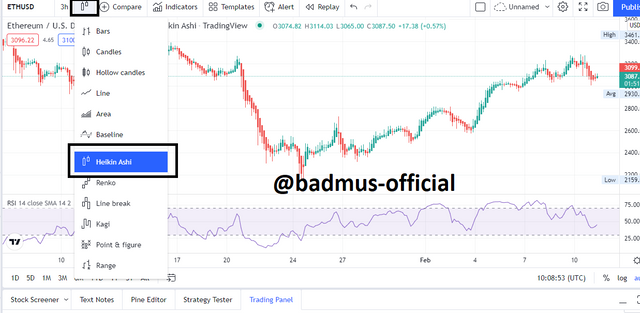
then, the timeframe we will be executing our trade on is 5 minutes, which can be changed as shown in the image below;
Buy Position: - The First thing to consider when executing a buy position is to ensure that the indicators are confluence, that is at that point we choose to make entry, all the indicators must be pointing in the same direction. Just as seen from the image below, I executed a buy position when the 200 EMA is moving below the market price which signifies bullish and as well the SAR dots are moving below the price and at the same time, we get to witness the Relative Strength Index wave crossing to the top band to the top, if all these are considered and witnessed from a trend, that is the best position to buy as it implies that more people are buying the particular assets at the time which we also execute to make profits altogether.
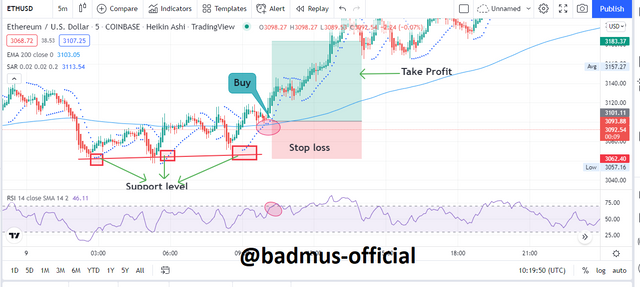
After the execution of our trade, we get to place the stop loss order right before the support level i.e the previous low the market got to before it start rising, we place the profit at the top closer to the previous market high peaks or higher, depending on the level we are willing to risk.
Sell Position: - The First thing to consider when executing a sell position is to ensure that the indicators are in confluence, that is at that point we choose to make a sell entry, all the indicators must be pointing in the same direction. Just as seen from the image below, I executed a sell position when the 200 EMA is moving above the market price which signifies bearish and as well the SAR dots are moving above the market price and at the same time, we get to witness the Relative Strength Index line crossing the middle band to the bottom, if all these are considered and witnessed from a trend, that is the best position to Sell as it implies that more people are selling the particular assets at the time which we also execute to make profits altogether.
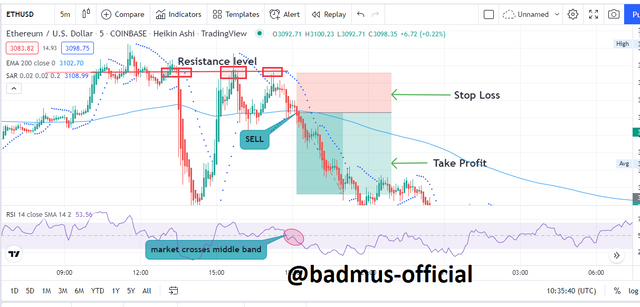
After the execution of our trade, we get to place the stop loss order right at the resistance level i.e the previous high the market got to before it starts falling, we place the profit at the bottom closer to the previous market low peaks or lower, depending on the level at which we are willing to risk.
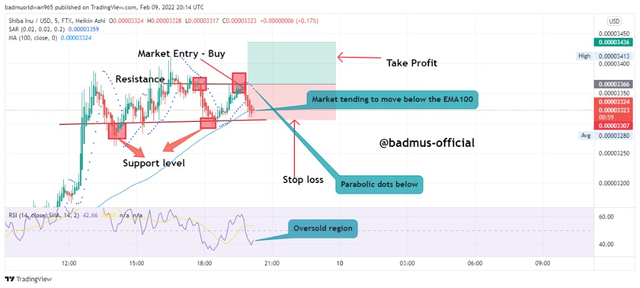
I will be performing a real trade of SHIBAUSDT, using the TradingView platform as my technical analysis.
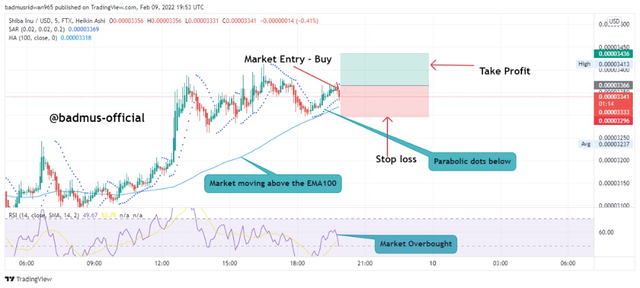
From the strategy taught in class using the 100EMA along with parabolic SAR and RSI, I was able to signal a buy trend from the market of SHIBAUSDT as the three indicators are pointing in the same direction of bullish, the Sar indicator dots are currently below the market price activity, as well the 100 EMA is traveling below the market price, afterward, the RSI indicator wave is moving to the top, with this, I was able to find a proper buy order and executed it on my binance application app.
Then I Launch my binance mobile application, then go to leverage trading to select the 8x leverage, I executed the buy order of the SHIBA INUS / USDT at the entry price of $ 0.00003367, then with the stop loss at $0.00003288 and a take profit level at $0.00003427.
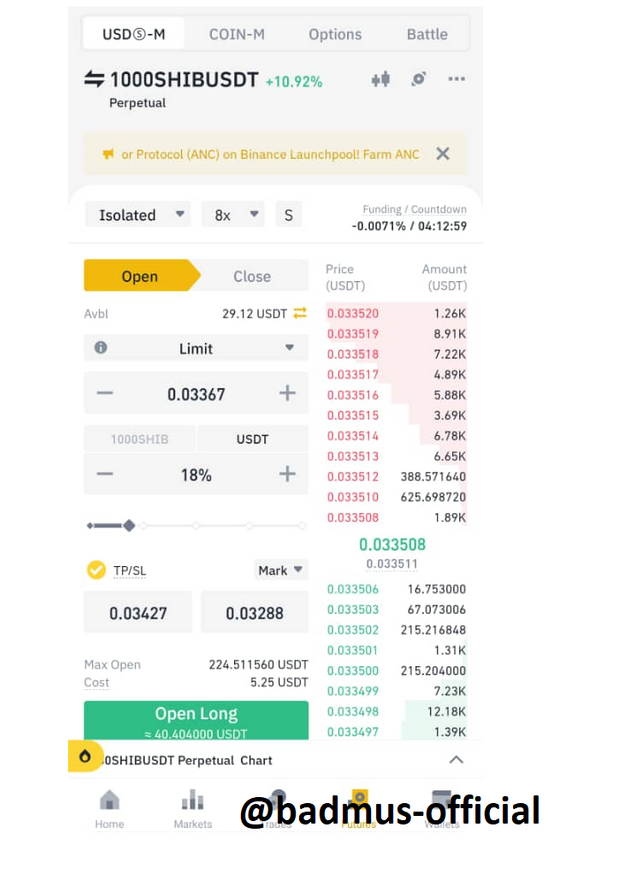
The image below displays the running of my order.
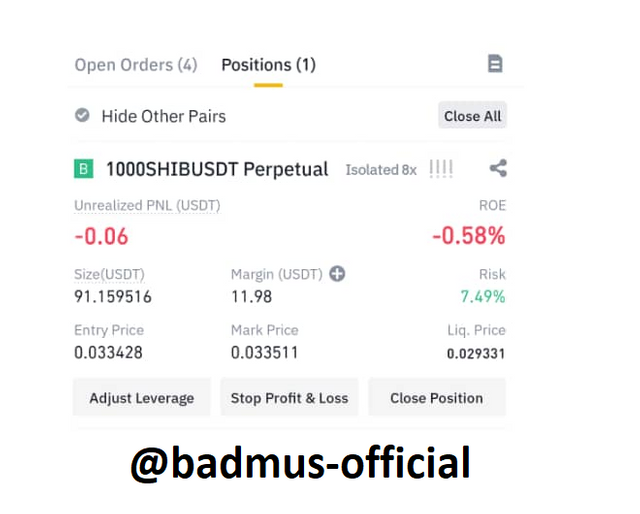
After some little while, the market started showing reversal just as seen from the image below, the Sar dots are now moving above the market, and as well, the 100EMA is about to move ahead the market price and the RSI index is as well moving to the lower band region.
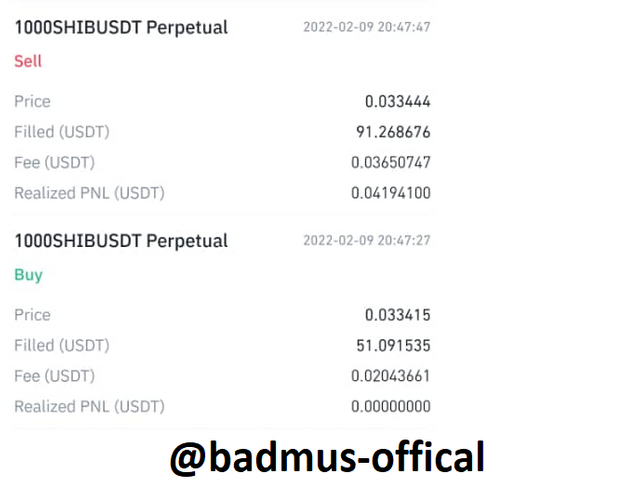
Then at that point, I place to close the order as the market tends to be moving in reverse.
Leveraged trading is one of the common trading strategies traders can use to their advantage by borrowing more capital from the exchange to increase their chance of profits. Leverage trading comes with a high reward which also comes with high risk, as trading with leverage is delicate and if not careful enough, one can end up losing all of his assets during the trade.
For a better visual of leverage trading, we combined additional indicators to boost the entry and exit of our trades, as in the case where we utilized confluence trading by adding several basic indicators such as EMA, SAR, and RSI all these are included to strengthen the trend and make confirmation of our trade entry as we are good to go at the point we notice the three indicators to be pointing in the same direction.
Special mention to professor @reddileep, it's a well-detailed course and I'm obliged I was able to participate in your studies.
Steemit Cryptography Student: