[Crypto Trading with Price Action] - Crypto Academy / S6W2- Homework Post for @reminiscence01

Hello everyone, how are you all doing? I welcome you all to the Crypto Academy S6W2 course, This week as well, we will be focusing our studies on Crypto trading where I get to explain to you how to trade with Price Action.
On today's, I will be submitting my task to professor @reminiscence01, after I have studied and understood the Topic "Crypto Trading with Price Action", where I will explain how to identify entry and exit points with it and as well give explanations to the basics regarding the understanding of the usefulness of the Price Action inn our day-to-day trading. You can as well join me to study the course from the Professor's Page.WISH YOU A HAPPY READING!!!

For traders to make any market prediction, they either make use of the technical analysis, sentimental analysis, or the fundamental analysis, most of the investing traders prefer to use the fundamental analysis because it makes its prediction with the help of the past and the present data that were collected, while the technical analysis was mostly used by the brokers because with it they were able to predict the direction the market price is taking and by using the trading chart and with the help of other trading indicators. With that many traders decide to make use of the technical analysis because most brokers mainly focus on a short-time trade and the technical analysis helped them to make a better prediction than the fundamental analysis.
The different fluctuation in the market causes the market price to move either towards the uptrend or downtrend, which also shows why we have price action in trading. With the help of price action, traders can learn and understand the situation of the market much better, also they can make a better prediction about the direction of the market price in the future with the help of past market price data.
With the help of technical analysis, the price action traders were able to make a better and more accurate prediction of the market price future direction while depending on the chart and graph presentation of technical analysis using the price bands, high and low swings, market structures, technical indicators, candlestick, etc, to predict the future direction of the price chart. The traders mostly believed that the market pattern repeated after a while, so the technical traders take time to study the market pattern so that they will be able to predict when the market pattern repeats itself and also for them to be able to make a perfect prediction on the pattern the market price will take either the market pattern will fluctuate towards the bull signal or the bear signal.
The price action is mostly comprehended as a data source on which most of the trading tools are built. Traders like the trend traders and the swing traders mostly work with price action, like the fundamental analysis traders who mostly focus on the support and resistance level to predict the market breakout, also have to look out for other factors that are beyond the current market price. Like the market structure where the market trend can be easily illustrated, which shows when the market price fluctuates and move either towards the downtrend or the uptrend, which is shown on the chart below, which indicates the ups and downs of the price.
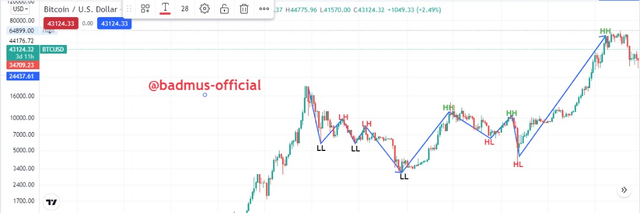
From the above chart, we can see how the market price fluctuates, moving ups and down and not having a stationary position in the market. When the price action traders noticed that the market price is going downward towards the bear, while the traders are panning on trading when the market is in favor of the bull, the trader has to wait till when the price is at the lowest low, the price shows that it's pulling back up before making his/her entry, after that the trader study the price movement which helped him/her to make a better prediction of when the market price will rise to its peak before taking his/her profit, then the trader study the market much closer to enter his/her stop-loss at a favorable angle when the market price starts to drop so that the trader will not make too much loss.
One of the importance of price action is that it helped the traders to have a better prediction of the market price direction which also helps the trader to know which of the market position he will be taking for his trade entry.
Another point is that the price action helps the trader to know the speed and angle of the market candlestick pattern, also to determine if the direction that the market price is taking is moving faster in that direction or slower, also it helps to determine the time it will take for the market price to rise to the higher highs or the lower lows.
Another important of price action is that it helps the traders to determine the amount of volume the price pattern is moving with, for example, the speed movement of the price when it is moving towards the upward direction in such a situation the market might be moving up but with a very low volume which means when the trader makes his entry he might end up not making any profit from such trade because the market at that moment lacks the necessary volume to support the trade, with the help of the price action, a trader was able to determine the amount of volume a trade has in any direction the price pattern takes.
Another importance of price action is that it helps the traders to know the position the market is in terms of day, week, month and year position, because to technical traders it is very important to know the past, present, and the future position the market price is or will be to have a better prediction of the price and also before making any entry in the market, with that, traders will be able to avoid making a loss when trading.
Will you choose other forms of technical analysis apart from price action? Give reasons for your answer
Yes, I will because experience has thought us that trading with only one side view is wrong in a way that when you make a right or wrong prediction, you will have no way to verify your prediction because you use a one side view but if you have another technical analysis to check your former prediction with, then you will be able to have a better prediction which will be way better than the one you first did because with another technical analysis you will be more sure of your prediction and know the exact direction the market price is going and correct position you should be taking in the market for your entry.
The Japanese candlestick is a chart pattern which is consists of reds and greens, where the reds indicate the market price is at the bearish side while the greens show that the market price is at the bullish side. Each of these candles provides more detailed information to the traders on the market price movement and direction for any specific period.
The Japanese candlestick are the best way to check and know the ups and downs of the market price, which helps the traders to determine when they will be a potential buy or sell in the market.
In Japanese candlestick, each of the candles has a body with tails which is also called the shadows. The candle body is what indicates the length between the open and close of the price will be for any time frame, while the tails stand for the highest and lowest price level for a given time frame.
The Japanese candlestick is easier to read compared to the likes of Heikin-Ashi, Bar chart, Hollow chart, etc, where the Japanese candle is displayed as red and green as explained earlier where the red indicates a bear price pattern while the green indicates the bull price pattern, for example, given a 15M chart, each of the candles that we have in such chart represents a 15m time interval to the next one, if we have a situation where the open price is lower than the close price then such situation shows that we have a bull signal in the market and when the close price is lower than the open price, then it shows that the market pattern is a bear signal.
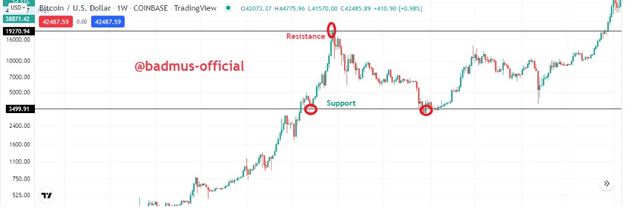
The chart above shows the movement of the candle pattern which causes the price pattern to either be within the support level or the resistance level, such situation causes a reversal in price, which indicates the market price changing from an uptrend to a downtrend or a downtrend to an uptrend, as such the traders will be able to easily perceive either to buy or sell.
Would you prefer any other technical chart apart from the candlestick chart?
For me no, because the candlestick chart is easier to understand than other chart patterns, I enjoyed using the candlestick chart while trading because with it I was able to identify when the market is trending towards the downtrend or the uptrend easily, I was able to find a better market position when making my entry either when I am buying or selling.
The multiple time-frame analysis is a situation whereby a trader makes use of different time-frame to analyze a specific market pattern to have a better understanding of that market pattern before taking a position in the market. With the help of multi-time-frame analysis, traders can identify the overall direction the market will be taking which also gave the trader a better prediction when making an entry.
When choosing a time frame it's better not to choose a time frame that is too close because you might not get a helpful result using a close time frame, so when choosing a time frame, it's better to at least start from 1H time interval.
For example, if you are using an upper time-frame of at least 1H, then when you are setting the lower time-frame, it has to be at 15m so that you will be able to have better information on the pattern, the same thing when using the 30m time-frame, the lower time-frame has to be set at the interval of 5m for you not to have a wrong prediction when making an entry and with that, you can avoid making a loss when trading.
State the importance of multi-timeframe analysis
The multi-time-frame analysis is important because it helps traders to measure the long market trend, also for traders to be able to predict where they can make a better entry on a smaller time-frame chart pattern.
With the help of a multi-time-frame, traders can filter out the noises which help them to be able to predict the right direction the market price is taking.
It also helps in reducing the risk that traders take while making predictions of the direction the price will take in the market, when using the multi time-frame, the traders will be able to have a better understanding of different approaches when executing trading of any time frame.
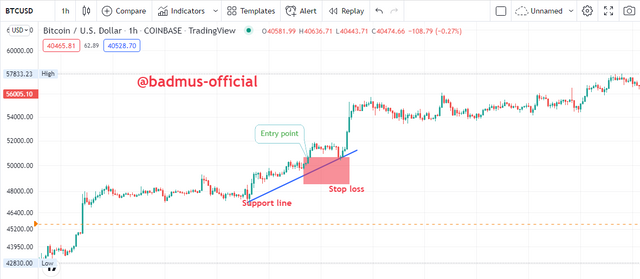
On this task, I will be making use of the trading view site to execute the task. And from the earlier explanation of the multi time frame, I will be making use of the BTCUSD trading chart for my analysis, I will also be using a longer time frame for my chart reading, after which I will now go for the short time frame.
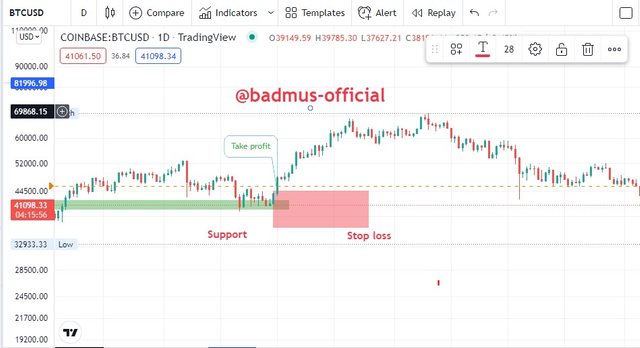
From the chart seen above, we can see the BTCUSD chart which was made using the 1D time interval, it also meets the longer time frame requirement, from the chart, we can see our support level which was taken below the chart pattern, also after the support level we can see the breakout where the price pattern is rising towards the bull signal then I retested the price, which makes me to marked my entry point at that moment, after that, I set up my stop loss below the support level which indicates that when the price drop, I won't be meeting too much loss.
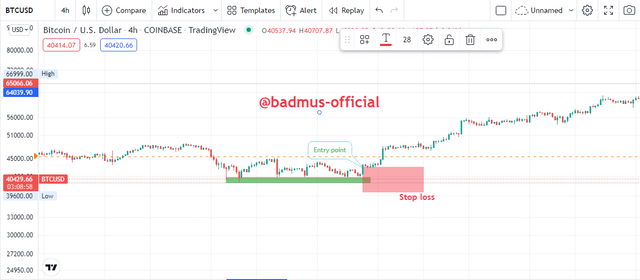
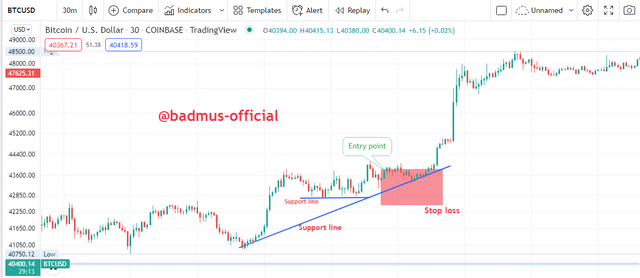
And the above chart shows the 4H time frame, after taking my chart analysis for the 1D time frame, then I analyze my price pattern on which I recognize where to set my support level then I retested the price, after which I confirmed my entry point which is now taking at a given time frame which is lower than the former time frame, this shows that I am making use of the multi-time-frame to make my market predictions.
And after taking my 4H chart analysis, I decided to take the analysis for the 1H time frame where I took my support line when the market price faced a sudden reversal after which I had to retest the price, then I make my entry point slightly above the support line to be safe then I decide to have my stop loss slightly below the support level.
Then after having my 1H analysis, I decided to take one for 30m time frame which also help in having a better understanding of how to make a better prediction when making my entry, so I decide to have my support level when I noticed a price reversal which happens many times, then I decide to take another support line which also provides additional support the price pattern from falling towards the bear signal, then I make my entry point above the support level while having my stop loss below the support level.
With all the analysis, I was able to see how important the multi-time-frame is to all technical analysis traders, with the different time frames, traders will be able to have a better prediction and also don't have to take too much risk while making the predictions.
In this section, I will be making my sell order analysis using the multi-time frame.
I will also be using the LUNAUSDT chart to make my analysis, the first order I will be making is for the longer time frame, from there I will take the shorter ones.
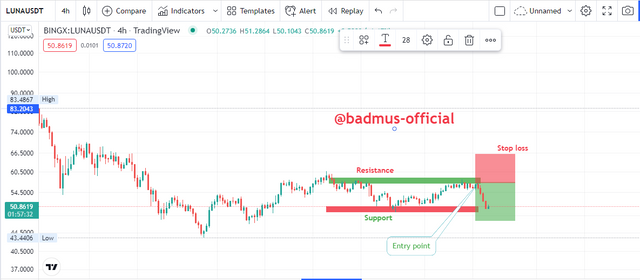
From the chart above, we can see that the time frame for the execution is 4Hrs, after that I decided to set up my resistance level which gave me a better understanding of the price pattern direction for that period, after which I made sure the price is retested at that level, then after I notice a price breakout at the resistance, I decided to take my support line, before taking entry point after confirming that the price pattern is leading towards the bear signal shows the perfect time for selling.
Then I took my stop loss at the support level when the market shows a strong breakout.
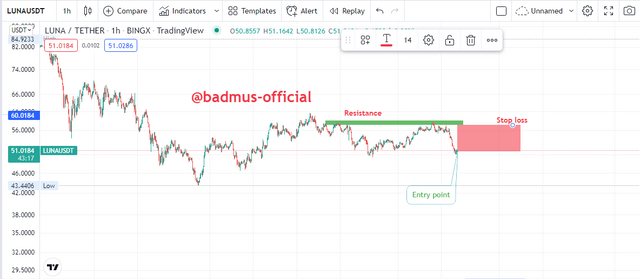
The above chart shows the shorter time frame, which is shown using the 1H time interval, after that, I took my resistance level which help me confirm when to set my entry point and also where to set my stop loss as shown in the chart above.
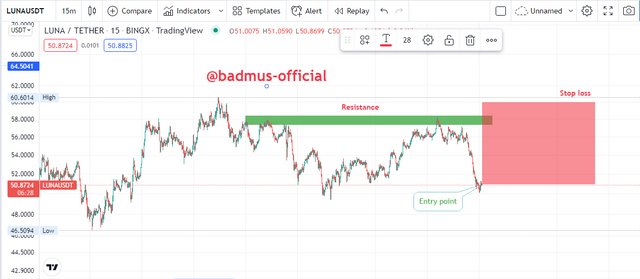
The chart above also shows a shorter time frame of about 15m time frame, after setting my resistance level, I noticed the price fluctuating, which also help me in knowing the right position to set my stop loss which was taken above the resistance level.
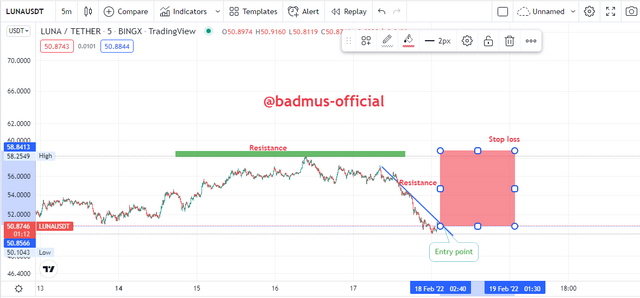
The chart above shows another shorter time frame, which is at 5m time frame, in this time frame I noticed that it became a little bit hard to make a perfect prediction of the future market price situation, which is the reason why I took to different resistance level on the chart which is displayed in the above image, after which my sell position in all time frame is stable, then I decided to place my stop loss to be above the resistance level.
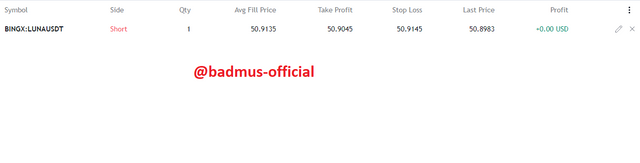
The image above shows the demo trading that was done while using the multi-time frame.
From all the explanations we've had, we have been able to explain what price action is and also how important the price action is to technical traders, at the same time we were able to learn more about the Japanese candlestick pattern and also how useful and handful it can be to traders while making their market prediction.
Special mention to professor @reminiscence01 for his wonderful lecture on this topic which also helps me in having a deeper understanding of the crypto trading with price action, its a well-detailed course in which I was glad to partake.
Steemit Cryptography Student: