Steemit Crypto Academy Season 5 Week 4 [Beginner's Course] - Trading Using Rectangle Pattern


1. Explain Rectangle Pattern in your own word.
2. How to identify Rectangles. Explain with Screenshots.
3. Can we use indicators with this pattern to get accurate results? Explain with Screenshots.
4. Explain Rectangle Tops and Rectangle Bottoms in your own words with Screenshots of both patterns.
5. Show full trade setup using this pattern for both trends. ( Entry Point, Take Profit, Stop Loss, Breakout)
6. Conclusion
1. Explain Rectangle Pattern in your own word.
ANSWER :-
I understand that a rectangle pattern is a typical chart pattern formed as a result of the market price being enclosed in a particular area, bounded by evident support and resistance.
When the market is range- bound or choppy, it has no clear direction and it ricochets off a clear high and a clear low (resistance and support). The Rectangle pattern is simple a shape that is formed in the chart of an asset understudy that shows the current market state of the asset. Normally, the asset are supposed to be trending in either uptrend or downtrend but in the case of the rectangle pattern, it can only be formed when the market is not trending.
This is said to signify a period of indecision between buyers and sellers or the “bulls” and the “bears”.This week there has been an introduction of the Rectangle Pattern and this new pattern/ observation is important to many investors in the market.
2. How to identify Rectangles. Explain with Screenshots.
ANSWER :-
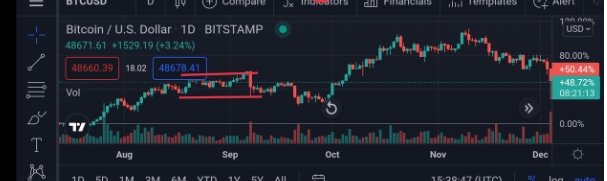
The formation of this pattern can be done by drawing your support and resistance lines to clearly indicate the rectangle. To do that, you have to make sure the market prices bounces of and falls back to a particular level of resistance and support.The first thing that should be observed is whether the market is ranging, if the movement is ranging then you can go on to identify the rectangle pattern.The next thing to consider is the horizontal lines. The rectangle is made up of 2 lines that are resistance line and support line. The price keeps ranging between these 2 lines and it has to test each line for 2 times. There are some things that are explained by the professor in the course which can make it easy for you to identify them without wasting too much time exploring the charts.Identify the former trend before the ranging period of the market and make sure that there is no other long play before the price action starts moving horizontally. when it doesn't happen we can say that the rectangle pattern hasn't been formed yet. After the trend and the rectangle pattern have been identified, then we will wait for the price chart to break out in the rectangle pattern. When the price chart breakout indicates a buy or sell entry, and also we take profit and stop loss.
3. Can we use indicators with this pattern to get accurate results? Explain with Screenshots.
ANSWER :-
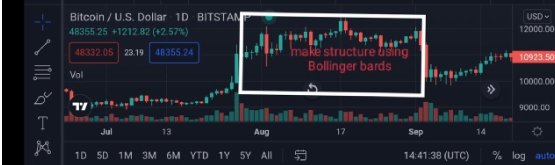
Although how to use it is easy, we must also strengthen the signal given by the rectangle pattern so that we do not experience losses in trading. To strengthen a signal when trading, you can use indicators. Indicators are the right choice to strengthen the signals given when we do technical analysis. A break of the resistance point in a rectangle pattern, can be shown as a continuation of the uptrend pattern, which can also be confirmed by the Bollinger bands indicator, when when the price is above the middle band and definitely breaks through the upper band, a clear signal like this can be seen for continuation and also has the strength of the diuptrend and also has a buying opportunity at this point. The rectangle pattern in the picture shows that the price will be overbought or oversold. And thus if later the price is in one of these characteristics, it can be expected that later it will have a momentum on the Bollinge Band indicator which will show that the volatility is the same as well .
4. Explain Rectangle Tops and Rectangle Bottoms in your own words with Screenshots of both patterns.
Rectangle Tops
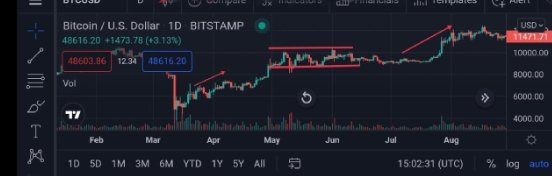
For the formation to occur, the price makes a movement called lateral, and also stops in the trend. This type of pattern is what is referred to as an attempt by a seller to later regain control of the market. This type of rectangle is formed at the top of a trend. That’s, the rectangle follows an uptrend. In the case of a bullish trending market, the rectangle top serves as the reaccumulation point where the price pulse accumulates and continues the trend.The price is rising upward. Then from moving below to top, when the rectangle pattern occur, this rectangle pattern then known as the rectangle top. It is not necessary that after the rectangle top, the price must breakout in upward direction.
Rectangle Bottom
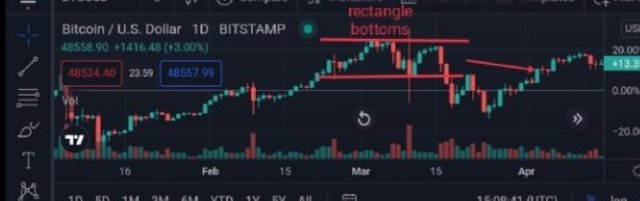
The price is falling downward. Then from moving top to bottom, when the rectangle pattern occur, this rectangle pattern then known as the rectangle bottom. It is not necessary that after the rectangle bottom, the price must breakout in downward direction.There is an downtrend. The price is moving from top to bottom. Then the rectangle pattern was formed and price enter in this pattern from top. Thus this is rectangle bottom. where Rectangle Bottom can be found at the bottom of the chart, usually before the Rectangle Buttom pattern occurs, there is a bearish trend on the chart first, Rectangle Bottom will tell us that the market will then experience a Bullish trend.If the sellers are strengthened, the breakout may be to the downside and in this case, the bearish momentum will continue. However, if the buyers are strengthened, that means the price will break above the resistance.
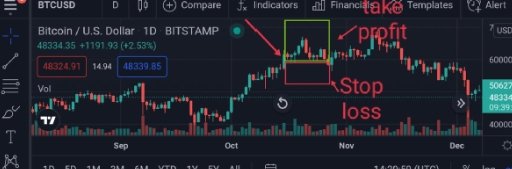
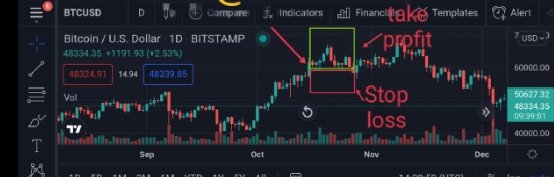
5. Show full trade setup using this pattern for both trends. ( Entry Point, Take Profit, Stop Loss, Breakout)
BUY TRADE SETUP
Tether pair taking from tradingview, a buy trade setup was executed immediately after the occurrence of the breakout point which is also my Entry point at exactly 0.26063USDT.Then during the consolidation period, there is a shortfall to the support line, halfway there, the candlestick bounces back to the resistance line and crosses it, causing a breakout at the top.As such, the best indicator I apply to this pattern is the Volume and Price Volume Trend Indicators .The stop loss was set across the resistance level and the take profit was set below the support level.
Trade Setup For Sell order
To place the sell order, the first thing which should make sure that the trend much be bearish. The market must be trending downward. The price should be falling down. Then the next thing is looking at the rectangle pattern. The rectangle pattern must be rectangle bottom. Then drawn the support and resistance level by combing the high and low points.As you can see once the price passed through the trend breakout occurred at resistance level indicating an uptrend where I placed my market buy entry now for trade setup I placed my stop loss value slightly below the last support level and marked my take profit above the last resistance level.
conclusion
These patterns are commonly known as trend continuation patterns, however, can also be seen being used to identify market reversal. Using technical indicators along with this pattern can help traders to get more accurate results.One such pattern that we discussed today is Rectangle pattern or consolidating market. The rectangle in itself is technically known to form a no trading zone but its breakout in either direction marks the beginning of new trend that can be materialised to accrue benefit out of it.