Crypto Academy Week 14: Homework Task for @fendit | Elliott Wave Theory
'We are in a bear market.' Those words convey similar feelings as though someone you love says 'I can't do this anymore, let's end this relationship.' Both expressions imply we've lost something/someone; leaving us distraught and heartbroken.

Although I'm not a relationship expert, I know from experience that no matter how heartbroken we may feel when someone we love breaks up with us, we will most likely recover and find someone else that will make us happy again.
Same can be said of the crypto market. No matter how sad we may feel when the market enters a downtrend, there will most likely be some ups during the down period.
So, instead of crying about what we have lost, let us focus on making the best of what we have. This raises the question:
How do we make the best out of a bear market? A short and simple answer is Elliott Wave Theory.
What is Elliott Wave Theory (EWT)? How do we apply EWT? What are impulse and corrective waves? How can we identify these waves in a chart?
Keep on reading to find out!

Elliott Wave Theory (EWT)
Books
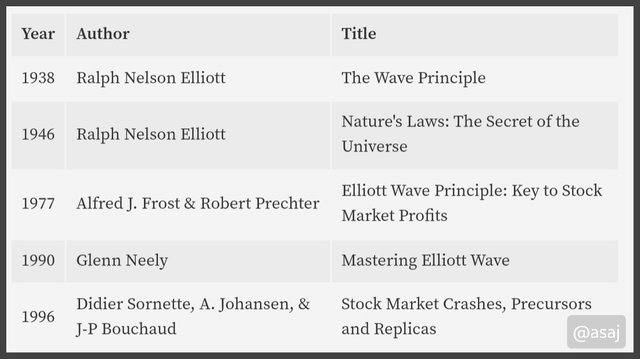 Some books for further reading | Photo Credit: @asaj
Background
Over 80 years ago, an accountant published a book that contained a theory that would later be used by many technical analysts and traders. The name of that accountant was Ralph Nelson Elliott.
And his theory is known as the Elliott Wave Theory (EWT). Eight years after releasing the first book, Elliot published another book to explain the details of his theory in 1946.
However, this theory didn't receive the attention it deserved during the early years of its discovery. We can therefore say, it was way ahead of its time. To make matters worse, the accountant who invented this theory died just two years after publishing the second book that explained EWT. The cause of death was heart disease, in case you were wondering.
His death complicated everything because how would people know of this theory since the inventor didn't live long enough to publicise it?
Thankfully, Alfred John Frost and Robert Prechter came to the rescue as they made the EWT popular by publishing a book of their own on the 30th of December, 1977.
Prechter was a very famous analyst in the bull run of 1980s, so his use of EWT made the theory popular.
Application of Elliott Wave Theory
Bear Market Application
We mentioned earlier that traders can benefit from the use of Elliott Wave Theory in a bear market. I know this sounds counterintuitive because in a bear market the values of crypto assets are generally declining.
Even so, here are some ways it can be applied;
1. Taking Profits at Retracements
While the prices are decreasing in a bear market, there are moments of temporary increase in price. This temporary movements of price against the market trend is known as retracements. You can take profit at these points of temporary price bounce.
2. Forcasting a Correction
Another way Elliott Wave Theory can be applied is in the aspect of predicting future prices. With the help EWT, we assured that no matter how bad a bear market is, there will certainly be a correction at the end of the trend, like a light at the end of a very dark tunnel.
However, one has to be very skillful in applying EWT to be able to identify the end of a downtrend.
Bull Market Application
Naturally, we all enjoy the aggregate rise in the value of cryptos during a bull run. Even so, EWT can serve as an vital instrument in maximising profit and minimising loss.
This leads us to the third application of EWT.
3. Maximising Gains in a Bull Run
To maximise gains in a bull run, you can take advantage of periodic deeps or downward retracements by entering a position at a temporary low and exiting the position at a new high.
4. Preparing for Bear
Despite the relative increase in profits during a bull run, 'the higher the gains, the closer we are to corrective wave.' Elliott Wave Theory proves this. Since EWT has warned us that this will occur, we can prepare for a bear market by setting a stop loss a little above the previous swing high.
Types of EWT Waves
There are three broad categories of EWT Waves, they are;
- Motive Waves
- Impulse Waves
- Corrective Waves
Since we are currently in a bearish market, it makes sense to explain these waves using bearish examples.
EWT Waves in a Bear Market
According to the Elliott Wave Theory, there are two phases in a bear market and each phase has its peculiar waves. Sometimes we may see a combination of phases which may complicate things a little, but generally there are two phases.
The illustration below depicts the two major phases. Bear in mind that, the combination of phases are also known as Motive Waves.
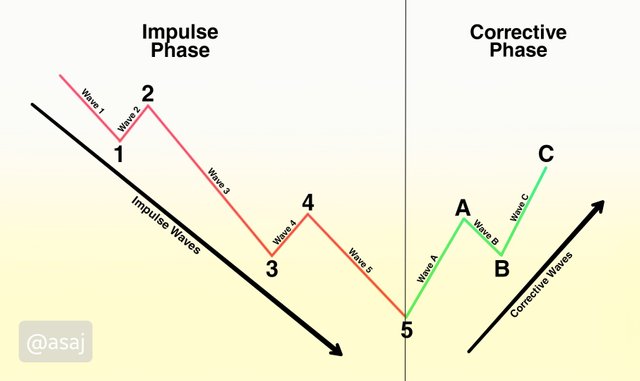 EWT waves in a bear market | Credit: @asaj
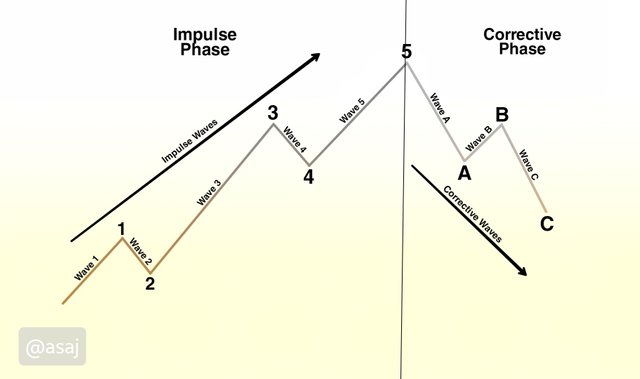
Impulse Waves
The impulse phase of a bear market can be divided into 5 waves. Wave 1 starts the bearish trend and it is the most difficult wave to identify.
Wave 2 is the retracement (temporary movement of price against the market trend). When this retracements occurs, it never goes beyond the price territory of Wave 1. This means that the length of Wave 2 can never be greater than Wave 1.
On the other hand, Wave 3 is usually the longest wave. In fact, in some cases, Wave 3 is three times longer than Wave 1.
Wave 4 follows the counter movement of Wave 2. They move in the same direction, going against the trend.
Conclusively, Wave 5 must end the trend. It is usually longer than Wave 1 but shorter than Wave 3.
Corrective Waves
After a longer bearish trend, the market begins to experience a price bounce and traders begin to buy more and more units of a crypto asset which leads to an uptrend. This is often termed market correction.
The corrective phase of a market trend can be divided into 3 waves;
Wave A starts the uptrend. The market then experience a retracement in Wave B as investors are taking profits and exiting their positions. Wave B is often the shortest wave among the three corrective waves.
Finally, other traders buy the deep and cause the price to rise again as seen in Wave C.
Combinative Corrective Waves
Furthermore, corrective waves can become complex when it combines with other waves. This combination creates a motive wave, and the motive of this wave is a correction. The combination include;
Zigzag Pattern (5-3-5): A Zigzag pattern is observed when 5 impulse waves, 3 corrective waves, and 5 impulse waves form a corrective phase. See the illustration below.
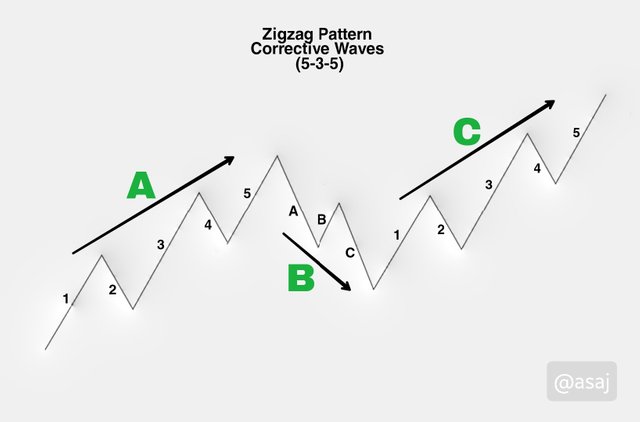 Zigzag pattern corrective waves in a bear market | Credit: @asaj
Flat Pattern (3-3-5): A flat pattern is observed when 3 uptrend corrective waves, 3 downtrend corrective waves, and 5 impulse waves form a corrective phase. The high points of Wave A and C are in the same price territory creating a flat top, hence the name flat pattern.
 Flat pattern corrective waves in a bear market | Credit: @asaj
Trangle Pattern (3-3-3-3-3): A triangle pattern appears when there is a repetitive combination of 3 uptrend corrective waves and 3 downtrend corrective waves which forms a corrective phase. This usually occurs in a ranging market. When a market is ranging, price could go anyway. Hence, it is best to avoid trading when you see the triangle pattern.
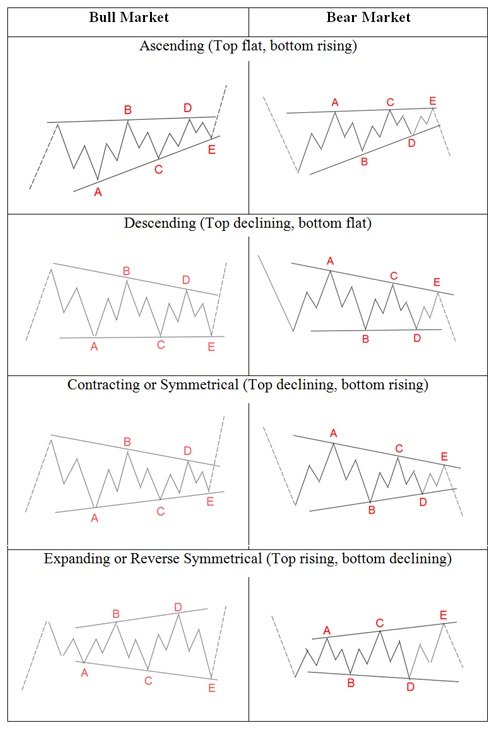 Triangle pattern corrective waves | Credit: Elliott Wave Forcast
For a bullish market, the principle remains but is applicable in reverse.
 EWT waves in a bull market | Credit: @asaj
My Thoughts on EWT Waves
The Elliott Wave Theory was invented to solve the misery in the stocks and crypto market. In the toolkit of a skilled technical analyst, the EWT can be used to perform wonders. In fact, Robert Prechter used this theory in combination with other indicators to make millions in the bull run of the 1980s.
Nevertheless, we can identify somes advantages and disadvantages from my above statements.
In my opinion, the disadvantages include:
- It is too complex for new traders.
- It is difficult to identify the waves, especially when the market is in Wave 1. You will need to see Wave 2 and 3 before you recognise the pattern.
- Most times, impulse waves do get to the number 5 as suggested by the theory.
- EWT is incompetent on it owns, you need to combine it with other indicators, such as Fibonacci Retracements, Accumulation Distribution Indicator and Commodity Channel Index.
Identifying Impulse and Corrective Waves in a Chart (LTC/USDT Pair)
Again, I will choose to do an analysis of the bearish trend. This time I will be using a coin chart. I have loaded the Litecoin to USDT pair in the chart below.
Impulse Waves of LTC/USDT Pair
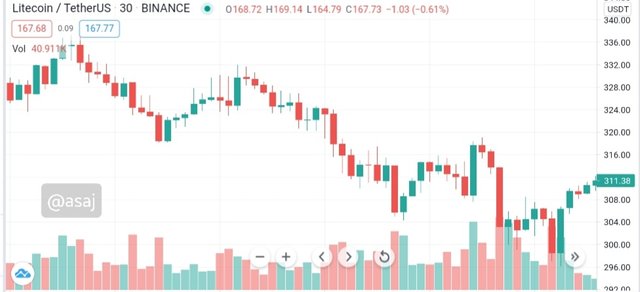 Screenshot of LTC/USDT pair on tradingview.com
At first glance, it may be difficult to identify the pattern. Upon taking a closer look at it, you will notice the Waves of EWT.
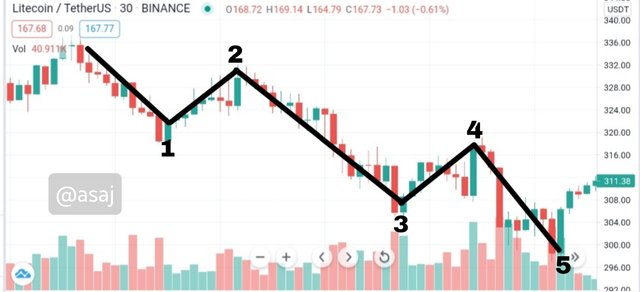 Screenshot of bearish impulse waves on LTC/USDT chart
Wow! Yeah, wow. Now, the pattern is clearly visible. What do you notice? Well, let's talk about our observations.
Observations
Waves 1 is the beginning of the downtrend. The low point of Wave 1 (also called the head of Wave 1) is a good point to enter a position.
Waves 2 is a retracement (a counter trend to Wave 1). However, Wave 2 did not reach the price territory of Wave 1's tail. Therefore, Wave 2 is shorter than Wave 1. The high point of Wave 2 is the right time to exit your position.
Wave 3 is the longest wave in the trend. The bottom of Wave 3 is another good point to enter a position.
Wave 4 is way shorter than Wave 3. In fact, Wave 4 is almost equal to Wave 2. Wave 4 is also a counter trend (retracement) like Wave 2. The high point of Wave 4 is a good place to exit your position.
Wave 5 is shorter than Wave 3. Again, you can enter a position at the low point of Wave 5.
My Verdict
Despite the bearish trend observed in the above chart, we were still able to make some profit. Isn’t that amazing? Of course it is.
Although the EWT looks easy when you see the examples, you shouldn't gamble with you funds. You have to understand this theory exceptionally well before you apply it in a bear market. Read and do your research. After understanding the concept, use a virtual account to practice and get the needed experience.
With that in mind, let's move to the next concept.
Corrective Waves of LTC/USDT Pair
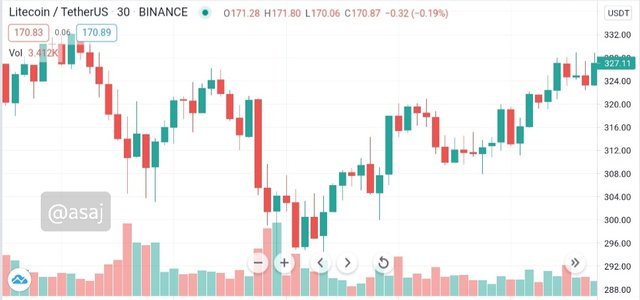 Screenshot of LTC/USDT pair on tradingview.com
It is quit easy to spot corrective waves in a bearish market. As such, we can see the correction taking place at the right side of the chart above. Can you identify the three major corrective waves?
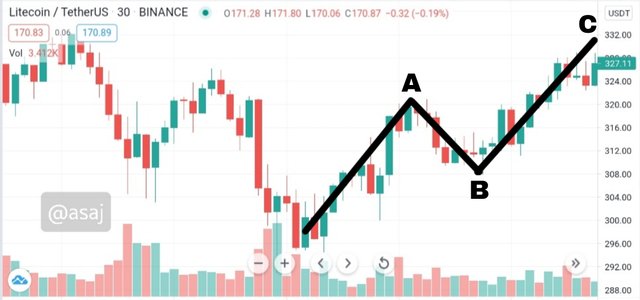 Screenshot of corrective waves on bearish LTC/USDT market
How about now, can you spot the corrective waves? It is always fun to see corrective waves in a bear market. It represents a symbol of hope to all traders.
What are your observations? Well, here are mine;
Observations
Wave A starts the uptrend. It is not advisable enter a position at the high point of Wave A. I know it can be overwhelming when we see an uptrend, the temptation to enter a position will most likely surface. Please be patient.
Wave B is a retracement or a price movement that goes against the trend. In addition, Wave B is shorter than Wave A. This means that the price of the crypto asset in this wave will not fall to the price territory of Wave A's tail. Now your patience will pay off as price has dropped to good levels where you can enter a position.
Wave C is longer than Wave B. We see a price recovery in Wave C as more traders enter the market. The high point of Wave C is where you exit your position before the price pulls back.
My Verdict
After a long bear market, there is always a beacon hope at the end of the tunnel: The Corrective Phase. Even as we are in a bear market right now, don't let it make you sad.
Keep working hard, and improving yourself. Learn more about various theories in the crypto world. Adding Elliott Wave Theory to your trading arsenal can make a lot of difference.
Final Words
Ralph Nelson Elliott may not be among us right now, but his theory lives on. A theory that can be used to make profit even in a bear market. If only he could see just how important and famous his theory has become.
I have a confession to make, the fact is, I have never really given the Elliott Wave Theory much attention before. I really appreciate the fact that the crypto teacher @fendit has chosen to give an assignment on EWT. It made me conduct rigorous research to fully understand the theory.
During my research, I noticed most publications online where using bullish examples to explain the principles of EWT. So I decided to explain the concepts using a bearish market. This is especially helpful since we are currently in a bear market.
We have learnt that the waves of can be divided into three categories; motive waves, impulse waves, and corrective waves. The motive waves is an aggregate or combination of the other waves.
While impulse waves are subdivided to 5 waves. As for corrective waves, they can be subdivided into 3 waves. Conclusively, a combination of corrective waves can form zigzag, flat and triangle patterns.
Hope you had a good read. Please leave your thoughts in the comment section below.
Thank you for being part of my lecture and completing the task!
My comments:
Man, you did it again... Another great homework that you submitted!
Thank you so much for being this constant and commited to cryptoacademy, it's a pleasure to read your work!
Overall score:
10/10
The pleasure is mine. I'm glad you like it.