Steemit Crypto Academy Contest / SLC S22W3 : Dynamic Risk Management In Crypto Trading
Hello everyone! I hope you are all doing well and enjoying life with the blessings of Allah Almighty. I am happy to take part in the exciting challenge hosted by SteemitCryptoAcademy community . So, without any further delay, let's dive right in! Shall we ? ........, Okay , Okay😊! .
Question 1: Foundations of Risk Management |
|---|
Risk management in cryptocurrency trading is a helmet when you are riding your bike. It will not prevent you from falling, but it will save your head! That is to say, it's a protection of the portfolio against unexpected market swings and keeping the long game going. Without a plan, even the best strategies go down the drain.
At its core, it's just understanding how much you can afford to lose without breaking a sweat. It includes using tools such as stop-loss orders and position sizing to limit losses. In other words, it's just a matter of boundaries-not so tight that you are going to miss opportunities but not loose enough that your portfolio runs wild.
Discipline is your best friend in volatile markets. The allure of quick gains can lead you astray, so balancing potential gains against acceptable losses prevents you from being left with empty pockets. You have to survive the bad days to be able to seize the good ones.
The second golden rule is diversification. Never put all your crypto eggs in one basket. Diversity makes it possible to reduce risks of total wipeout. Let's be honest, nobody wants to cry over a single bad trade.
Lastly, make technology your ally. Use volatility indicators such as Bollinger Bands or ATR to understand market trends and refine your strategies. Just imagine the crypto GPS that guides you through bumpy roads, making you make more effective decisions with confidence.
That the thing is , making smart trades inside the Steem/USDT market can differ between thriving in the market as well as a mere survival to get by there. Let us explore these key essentials with good examples and, of course with a touch of humor!.
Position Sizing: Do not bet the farm.
Position Sizing is exactly about how to invest in single trade. Imagine you are playing poker – you would not throw all your chips on one hand, would you? The same goes for trading. For example, if you have $1,000 in your portfolio, risk no more than 2% ($20), per trade. This way, even if the market takes a nosedive, you're still in the game. A well-sized position acts as a safety net, helping you avoid the dreaded “"all-in regret.”
Stop-Loss Placement: Your Safety Brake
A stop-loss order is an alarm set to wake you up before your dreams (or trades) turn into nightmares. Imagine you have bought Steem at $0.20, hoping it goes to $0.30. Setting a stop-loss at $0.18 means that if the market falls dramatically, your loss will be capped. It's like a speed limit for your portfolio: you can't drive so fast you crash into financial ruin in your pursuit of gain.
Diversification: Don't Put All Your Eggs in One Crypto
Variety is not the spice of life in trading but the secret to survival. Consider investing everything into Steem. A whale goes ahead and sells a massive portion, sending prices crashing. Ouch! That is why diversification will keep you spread between Steem, Bitcoin, Ethereum, or stablecoins. Chances are if one dips, the others may still hold or go up, helping your portfolio to stay afloat.
Example in Action: Steem/USDT Volatility Navigation
Imagine that you have $500 and have chosen to trade in Steem/USDT. You then risk 2% of your capital, say, $10 for one single trade. Set the stop-loss to 5% below the entry price in order to reduce possible losses. On the other hand, you still invest in BTC/USDT or ETH/USDT, balancing out your portfolio. Then, when the price of Steem shakes up, you're not worried as your risk is well-contained.
Why It All Matters
Risk management is not about avoiding losses altogether – that's impossible. It's about keeping losses small enough to fight another day. By mastering position sizing, stop-losses, and diversification, you can tackle the wild world of Steem/USDT with confidence & maybe even a grin. After all, trading should be exciting, not nerve-wracking!
Question 2: Calculating Risk-Reward Ratios |
|---|
Risk-Reward Ratios: The Secret Sauce of Trading
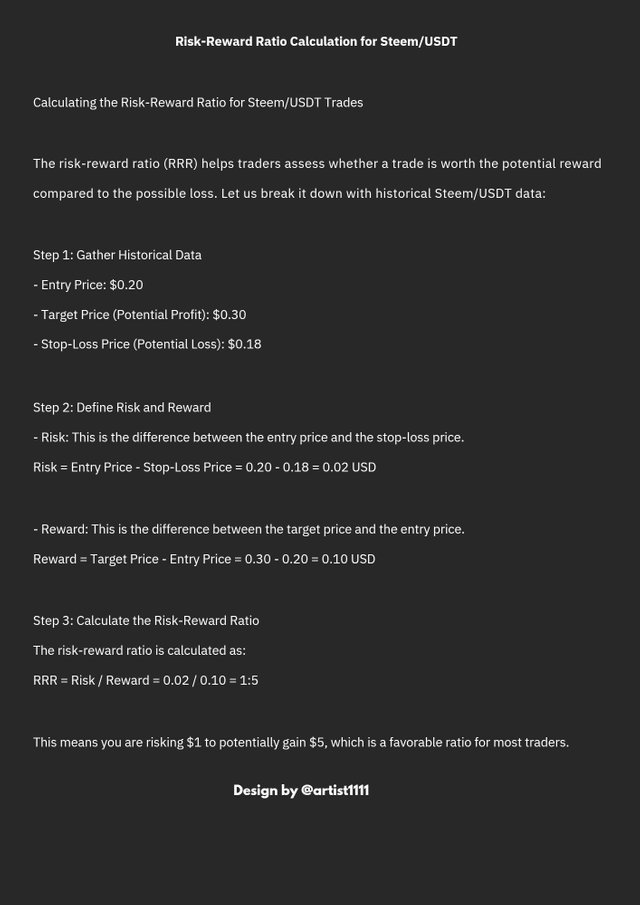
Trading without risk-reward ratio is like driving in the dark; you might find it exciting, but it would end up being pretty disastrous. A risk-reward ratio helps steer your decisions right in the volatile world of cryptocurrencies,,, where price movements go from predictable to impossible.
Imagine this: you're looking at Steem/USDT, attracted by its recent run-up. Wait a minute, though: are you risking $1 to make $5, or risking $5 to make $1? That's the difference between trading smart and gambling. A good risk-reward ratio keeps you down to earth, balancing potential losses against expected gains.
It's a cheat sheet to maintaining sanity in crazy crypto markets, for both turtle cautiousness and bold harelike confidence. With full knowledge and quantification of that risk-reward ratio, wild guesswork becomes strategic moves. Here's to dive into the matter!
 RRR calculation for Steem/USDT RRR calculation for Steem/USDT |
|---|
Provide a practical example, including entry and exit points, to highlight how this metric guides decision-making.
For an example, I have taken Steem/USDT pair for analysis and mapped out two trades based only on technical analysis. Whichever, a long or short I am, it is significant for me during the time of decision -making process. It is time to delve into the details of how this leads to smart risk management and hopefully keeps some hair on the head!
 RRR for long position RRR for long position |
|---|
For a Long Position
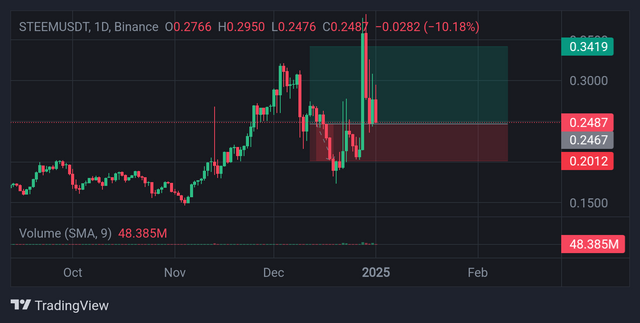
Looking at the charts, I decide to go long with an entry price at $0.2487, targeting a potential upside to $0.3419. This is my take-profit level, where I expect the price to hit resistance based on historical highs. To protect myself from losses, I set a stop-loss at $0.2012, just below a recent support level.
Now, let’s calculate:
- Risk: $0.2487 (entry) - $0.2012 (stop-loss) = $0.0475
- Reward: $0.3419 (target) - $0.2487 (entry) = $0.0932
- Risk-Reward Ratio: $0.0475 ÷ $0.0932 = approximately 1:2
This means I’m risking $1 to potentially gain $2. With a favorable RRR like this, I know the trade is worth taking. Plus, the stop-loss ensures I don’t lose too much if the market moves against me.
Short Position on Steem/USDT
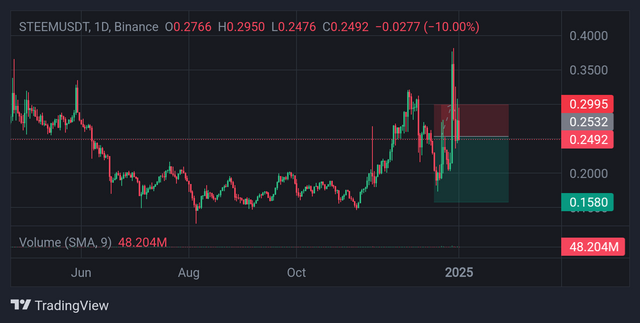
Looking at the Steem/USDT chart, I identified a bearish scenario to short. I noticed that this market has possible resistance near $0.2995 as the price is likely to break up past it. Given this, I would enter a short position at $0.2995 and anticipate it to reach a low of $0.1580. As part of managing my risk, I set my stop-loss at $0.3532, right above the last high.
 RRR for short position RRR for short position |
|---|
Let’s break it down:
- Entry Price: $0.2995
- Stop-Loss: $0.3532 (risk level)
- Take-Profit: $0.1580 (reward level)
Now, the calculations:
- Risk: $0.3532 - $0.2995 = $0.0537
- Reward: $0.2995 - $0.1580 = $0.1415
- Risk-Reward Ratio: $0.0537 ÷ $0.1415 = approximately 1:2.6
Why the Risk-Reward Ratio is Essential
In each scenario, the RRR was what kept me grounded as I determined if the trade was worth taking. Without such a metric, I would be flinging darts in the dark, hoping for a hit. Instead, through the risk-to-reward, I navigate this wild Steem/USDT market with confidence and sleepless nights at bay.
Likewise, in 2nd short position, I risk $1 for the possibility of gaining $1.86. It's quite balanced as far as the setup of a short position goes. The stop-loss makes sure I do not lose more than $0.0495 per token in case it turns against me, while the take-profit will lock the gain in case the price reaches $0.1580.
This approach demonstrates how to manage trades using the risk-reward ratio in a volatile market like crypto. It keeps emotions in check, focuses on calculated moves, and ensures every trade has a clear exit plan. It's not just about winning but winning smart!
So, the next time you open a trade remember: don't just plan for profits; think about your limits and exits, too. As the saying goes, in trading, it is not just to make money; it is about not losing the whole thing
Question 3: Leveraging Volatility Indicators |
|---|
Volatility indicators such as Bollinger Bands and Average True Range (ATR) are a must-have for risk management in highly volatile markets like cryptocurrency. When trading the ETH/USDT pair, these tools provide actionable insights for stop-loss adjustments, position sizing, and overall risk management. Let's explore their application in detail using ETH/USDT on different time frames.
Bollinger Bands: Identifying Entry and Exit Points
There are upper band, a lower band, and a simple moving average (SMA) in the middle. They look to adapt to market volatility, reaching higher levels of activity and then contracting when the place is quieter. For ETH/USDT:
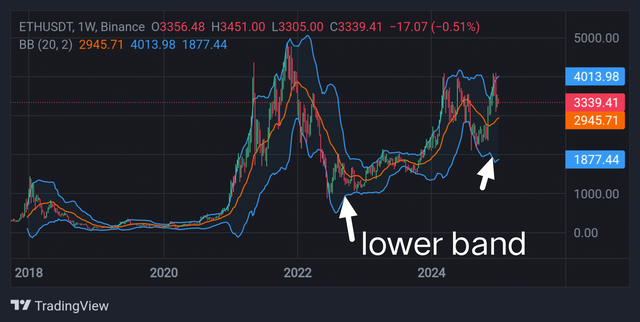 Lower band identification Lower band identification |
|---|
- Long Position Setup: Assume that ETH is trading at $2945.71 near the lower Bollinger Band. This indicates an oversold condition, which is a good entry point.
- Stop-Loss Placement: To minimize risk, a stop-loss can be set slightly below $2858.81, the level just outside the lower band, accounting for possible false breakdowns.
- Profit Target: The mid-band around $3458.49 can be the initial target, with the upper band acting as the extended profit zone.
This setup gives a risk-reward ratio of 1:2, meaning for every $1 at risk, there's a potential $2 reward. Bollinger Bands, in this case, not only inform entry points but also ensure that the stop-loss is dynamic and relevant to the current market conditions.
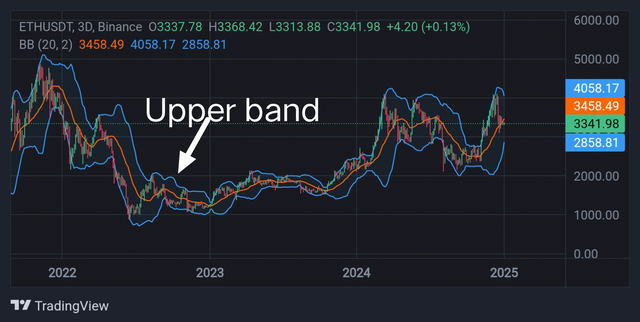 Upper Band Upper Band |
|---|
ATR: Measuring Market Volatility for Stop-Loss Adjustments
The Average True Range (ATR) measures market volatility by calculating the average range of price movements over a specified period. A higher ATR value indicates increased volatility, suggesting the need for wider stop-loss levels to avoid being prematurely stopped out.
For example, if ETH/USDT is trading at $3339.41 and the ATR value is 120 points:
- Stop-Loss Calculation: Subtract the ATR value (120) from the entry price, setting the stop-loss at $3219.41.
- Position Sizing: If a trader were willing to tolerate a $100 risk, using the ATR-adjusted stop range of $120, his position size becomes the risk divided by the number ($120); this will naturally align the trade with his entire risk tolerance level.
ATR is especially handy during sharp markets because it wouldn't allow trades to get stopped out due to short-term spiky price jumps.
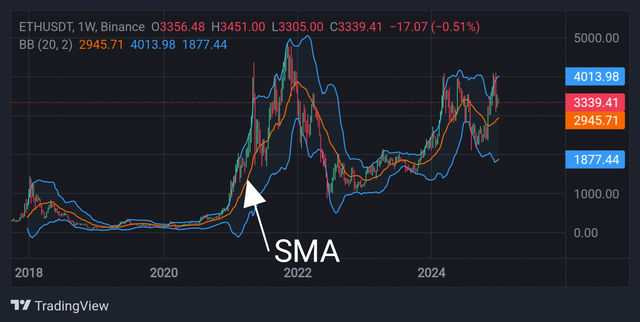 SMA SMA |
|---|
Combining Bollinger Bands and ATR for Precision
When used together, Bollinger Bands and ATR offer a holistic approach to managing risk. For example:
- This might signal an overextended rally if ETH/USDT breaks out the upper Bollinger Band and ATR signals high volatility. Traders may tighten the stop-loss or book partial profits to lock the gains while letting further upside take care of itself.
- Conversely, at low volatility periods, narrow Bollinger Bands and a dropping ATR depict reduced market action. In those conditions, more restricted stop loss levels can be employed, smaller position sizes for reducing risk exposure.
Applying the Concepts Across Time Frames
In higher time frames, such as the daily or weekly charts, Bollinger Bands and ATR would indicate broader market trends, suitable for swing traders. For instance, if ETH/USDT shows significant, consistent movement inside the Bollinger Bands, traders can hold positions longer, depending on ATR to modify stop-loss levels from time to time.
These indicators help day traders quickly adapt to price fluctuations on shorter time frames like the hourly chart. For example, a sudden spike in ATR during a Bollinger Band breakout signals potential price acceleration, and traders can dynamically adjust their stop-loss or increase their position size.
Conclusion
Volatility indicators such as Bollinger Bands and ATR are essential in managing risks while ensuring disciplined trading. For the ETH/USDT pair, these indicators provide traders with opportunities to adapt according to market conditions, set suitable stop-loss levels, and compute position sizes to suit their risk appetite. Combining these tools together gives traders confidence to navigate through volatile markets precisely and strategically.
Question 4: Developing a Risk-Adjusted Strategy |
|---|
A Risk-Adjusted Trading Strategy for STEEM/USDT
When volatile pairs like STEEM/USDT, adjusting strategy according to the market, either in the case of price movements or consolidations, will lead to constant results. Here's a holistic trading strategy with adjustments to the dynamic market that optimize risk and reward.
1. Identifying Market Conditions
Before entering any trade, it's essential to identify the current market phase:
- Sharp Price Swings (High Volatility): Characterized by wide price movements and large candlesticks. Indicators like ATR and Bollinger Bands will expand.
- Periods of Consolidation (Low Volatility): Price moves within a narrow range, forming tight Bollinger Bands with reduced ATR values.
Adaptation:
- During high volatility, widen stop-loss levels & reduce position size to accommodate larger price movements.
- During low volatility, use tighter stop-loss levels & slightly larger position sizes to exploit small price ranges.
2. Risk-Reward Principles
Maintain a minimum risk-reward ratio of 1:2, ensuring that potential gains outweigh risks. For instance:
- If risking $10, aim for a minimum profit of $20.
- Use dynamic position sizing to ensure that the total risk per trade remains a fixed percentage (e.g., 1–2%) of your trading capital.
3. Entry and Exit Strategies
Sharp Price Swings
Long Entry: When the price closes above the upper Bollinger Band, wait for a pullback to the mid-band (SMA). Enter long if the price finds support near the SMA.
Short Entry: If the price closes below the lower Bollinger Band, wait for a pullback to the mid-band. Enter short if resistance forms near the SMA.
Stop-Loss Placement:
Use ATR to determine stop-loss levels. For example, if ATR is 0.02 and the entry price is $0.25, set the stop-loss at $0.23 for a long position or $0.27 for a short position.Take-Profit Levels:
Use Fibonacci extensions or Bollinger Band extremes as targets. For a 1:2 risk-reward ratio, take profit at $0.29 for a long position or $0.21 for a short position.
Periods of Consolidation
Long Entry: Enter when the price bounces off the lower Bollinger Band or a key support level.
Short Entry: Enter when the price rejects the upper Bollinger Band or a key resistance level.
Stop-Loss Placement:
Use tight stop-loss levels just outside the consolidation range (e.g., $0.03 below support for a long or above resistance for a short).Take-Profit Levels:
Target the opposite boundary of the consolidation range. For instance, if the range is $0.22–$0.26, go long at $0.22 and take profit near $0.26.
4. Incorporating Indicators
Moving Averages (MAs):
- Use the 50 EMA for trend identification. If the price is above the EMA, prioritize long trades; if below, focus on short trades.
RSI (Relative Strength Index):
- In sharp price swings, avoid overbought (>70) or oversold (<30) levels.
- During consolidation, watch for RSI divergences to anticipate breakouts.
5. Example Trade Scenarios
Scenario 1: Sharp Price Swing
- STEEM/USDT trades at $0.25 with an ATR of 0.03.
- Entry: Long at $0.25 after a pullback to the mid-Bollinger Band.
- Stop-Loss: $0.22 (0.03 below entry).
- Take-Profit: $0.31 (1:2 risk-reward ratio).
Scenario 2: Consolidation Phase
- STEEM/USDT trades in a range of $0.22–$0.26.
- Entry: Long at $0.22 near the lower boundary of the range.
- Stop-Loss: $0.21 (just below support).
- Take-Profit: $0.26.
6. Adapting to Changing Market Conditions
- Use ATR to dynamically adjust stop-loss levels as volatility shifts.
- Monitor Bollinger Band width to detect transitions from consolidation to high volatility.
- Review market sentiment and news to prepare for sudden spikes or drops in price.
Conclusion
This risk-adjusted approach will have consistent performance under various conditions for STEEM/USDT. With Bollinger Bands, ATR, and other solid risk-reward principles, you can trade with discipline and flexibility, protecting capital in uncertain phases of the market and grabbing as much as possible when volatility appears.
Question 5: Lessons from Real-Life Scenarios |
|---|
A Hypothetical Scenario: The "Steem Plunge" and the Price of Poor Risk Management
Imagine a trader, Alex, enters the STEEM/USDT market with the expectation of a bullish breakout. Excited by recent upward momentum, Alex decides to go all-in with their $10,000 trading capital, buying STEEM at $0.30 without any predefined stop-loss or risk management strategy. Here’s how the story unfolds:
What Went Wrong?
No Risk Assessment:
Alex failed to calculate how much they could afford to lose. When STEEM's price unexpectedly dropped to $0.20 due to a sudden market-wide sell-off, Alex lost $10,000 x (0.30 - 0.20) / 0.30 = 33% of their capital, equating to a loss of $3,333.No Stop-Loss in Place:
Instead of limiting the loss, Alex hoped for a recovery, ignoring the golden rule of cutting losses early. The price continued to plummet, eventually hitting $0.15.Overleveraging:
Alex's decision to allocate all capital to one trade magnified the impact of the loss. A diversified portfolio or reduced position size could have lessened the blow.
What Could Have Been Done Differently?
Set a Stop-Loss:
If Alex had placed a stop-loss at $0.27 (a reasonable 10% below entry), they would have capped their loss at $1,000 instead of losing $3,333.Position Sizing Based on Risk Tolerance:
Alex could have risked only 2% of their capital ($200) per trade. Using this risk amount, their position size would have been smaller, ensuring limited exposure to adverse price movement.Analyze Volatility:
Indicators like ATR or Bollinger Bands could have helped Alex anticipate potential price swings. For example, if ATR showed a high volatility range of $0.05, Alex would have known to widen the stop-loss & adjust position size accordingly.Diversify Investments:
By spreading their capital across multiple assets or trades, Alex would have minimized the risk of one poor decision wiping out a large portion of their account.Maintain Emotional Discipline:
FOMO (Fear of Missing Out) drove Alex into a high-risk trade. A disciplined approach, with a clear plan and objective, would have prevented impulsive decisions.
Key Takeaways for Improving Future Strategies
Always Define Risk Before Entry:
Decide how much you’re willing to lose on a trade and set your stop-loss accordingly.Implement Position Sizing Rules:
Only risk 1-2% of your capital per trade. Calculate position size based on this risk and the distance of your stop-loss.Use Volatility Indicators:
Tools like ATR help adjust your strategy for current market conditions, ensuring stop-loss levels are neither too tight nor too wide.Diversify Your Trades:
Spread risk across multiple positions to avoid catastrophic losses from a single trade.Stick to a Plan:
Develop a trading plan and follow it with discipline, resisting the urge to act on emotion or market hype.
Conclusion
Alex's losses are an instructive story. Poor risk management not only can magnify those losses but actually undermine confidence as well as subsequent performance. Including proper risk management in your toolkit will help you conserve capital, be a better trader, and hopefully survive long enough to be amongst the best trades in the marketplace. Remember: **Trading isn't about right all the time, it is about managing to lose when wrong.
kind Regards
@artist1111

Adieu, folks!
May the winds of fortune
carry you to greatness!
May the winds of fortune
carry you to greatness!
Yeah! For real, Trading is not always been right..... It's about been able to manage risks