Introduction to the Principles of Crypto Analysis - Crypto Academy S4W7 - Homework Post for @imagen

Question 1
Answer 1
In simple words Fundamental analysis is a method used to identify the market behaviour which is studied by reading relative economy and financial crises of Market .
Fundamental analysis generally complete from macro perspectives to micro perspectives to identify the security prices which are not correct priced by the market.
It uses public database to find out the values of crypto assist , stocks or any other type of securities .
Let's understand it by an understanding example Suppose fundamental analysis can be done by an investor on bond value looking at economical factors like interest rate and state of overall economy then study information on bond issues .
On the opposite side of it technical analysis Can be defined as prediction of the future of the Market by analysing real world data .
It also involves the past statistic data of crypto assist or we can say it consists the history of price of Crypto assist like previous patterns , upward and downward trend , charts and many more .
Let's understand how technical analysis read the price pattern and predict the future price of Crypto Market .
- Distinguished pattern are formed by price movements and technical analysts on charts .
- The pattern is identified by a comman price line which will high or low during a certain time period .
- The cryptographers and technical analysts read these patterns and make their prediction about the future of the Market.
Some more basic differences are given below in tabular format
| Fundamental analysis. | Technical analysis |
|---|---|
| Method to analyse the market behaviour with the help of information of relative economical and financial crises | method to predict the market future with the help of charts and different types of patterns . |
| Identify the starting value of stock | predict the correct time to enter or exit in cryptomarket. |
| Used for investing | used for trading |
| Used in investments of longer term | used only in short term investments |
| Focus on both past and present data | focus on only past data |
| Decisions based on evaluated statistics | decisions based on Market trends. |
Fundamental analysis is used most often in long term investments while technical analysis used most in short duration investments.
Question 2
Choose one of the following crypto assets and perform a Fundamental Analysis indicating the objective of the Project, Financial Metrics and On-Chain Metrics.
- Cardano (ADA)
- Solana (SOL)
- Terra (MOON)
- Chiliz (CHZ)
- Polkadot (DOT)
Answer 2
Polkadot (DOT)
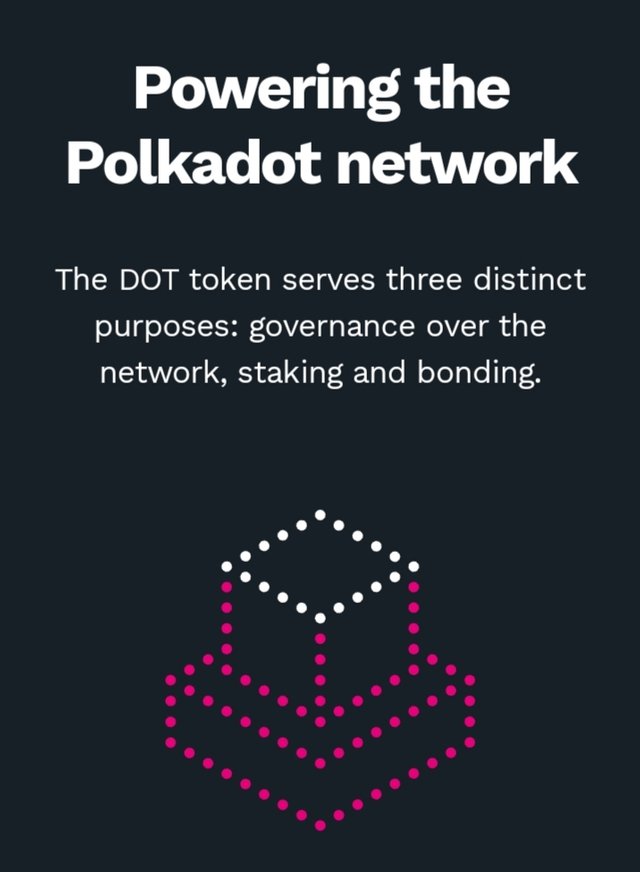
It is a cryptocurrency plateform which is developed by an foundation named as WEB3 foundation . It has many types of different cryptocurrency blockchain for communication and data exchange safely . It has unique database system where all the transaction are verified .
Means polkadot has multiple network connection system thus if one of the network get fail , it will not affect the whole blockchain operation. Transaction speed on polkadot is also very high and this efficiency is maintained by the means of sharding.
This platform uses proof of stake mechanism instead of proof of work on its plateform during their operations. This makes the polkadot environment friendly and there also less chance of government bans.
As all proof of stake mechanism polkadot also have their native tokens named as DOT coin to perform validation tasks.As DOT is Crypto token of polkadot.
During the initial time (2017) the team of polkadot was the ability of raise of one hundred forty million dollars approximately but some years ago they receive only one hundred million dollars as funds From their two private sectors.
These DOT coins have some functions in the working system of polkadot like purpose of governance, stalking for earning of more and more rewards , bonding etc. The coin can buyed by different exchanges .
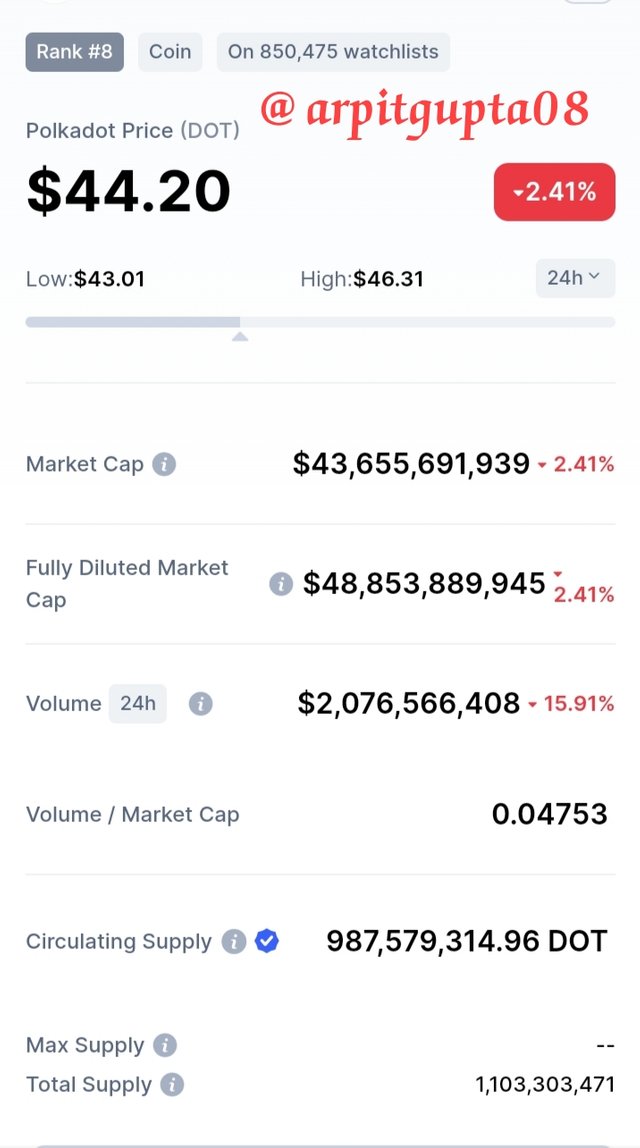
During the visiting time the coin is ranked 8th among all the Cryptocurrenies.It is selling worth $44.20 , with low of $43.01 and with high of $46.31 within 24 hours .Market capatalization is $43.6 billion and fully capatalization is $48.8 billion.
The volume of Polkadot coin is approx $2.07 Billion and MarketCap ratio 0.04753 during the 24 hours . Here about 1.12 Billion DOT coins
are supplied where 987 Million DOT coins are of circulation.
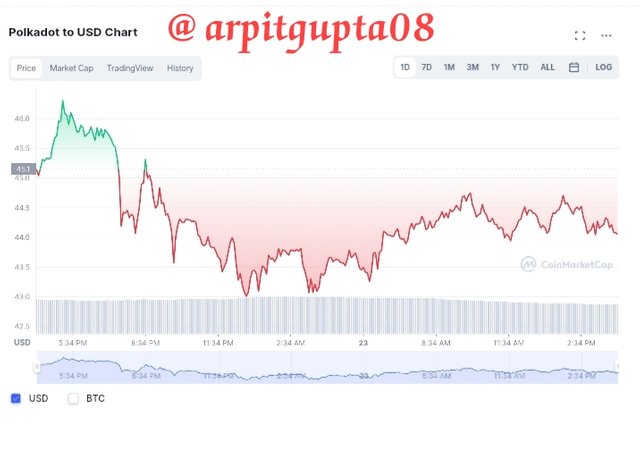
live Polkadot price 23 October 2021 is $44.11 USD with a 24-hour trading volume of $2,0 billion . Polkadot is down 2.10% in last 24 hours.
Now for the analysis of this question I am using polkadot explore whose screenshot is given below
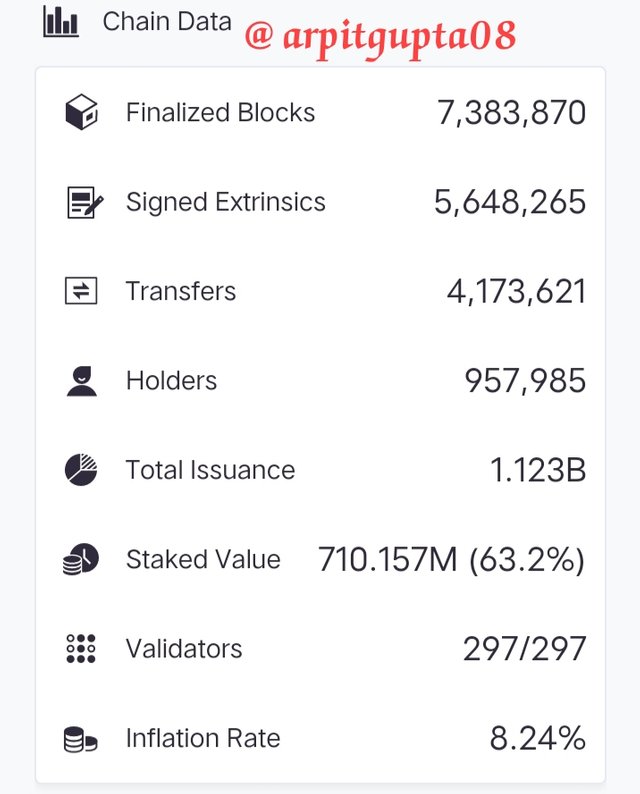
- At present total finanlized blocks are 7,383,870
- totall signed extrinsics are 56,48,265
- transfer rate is of 4,168,840.
- insurance of the total dot is 1.123B
- the staked value of 710.3M means 63.2% of total insurance.
- the total number of validators on Polkadot are 297.
- Total persons who holding the DOT are 957985
- inflation rate of DOT token is 8.24%.
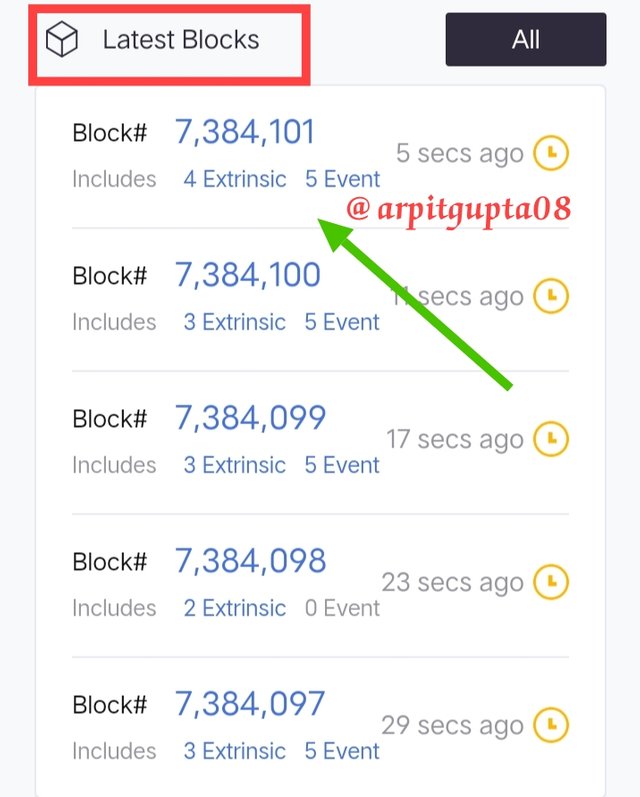
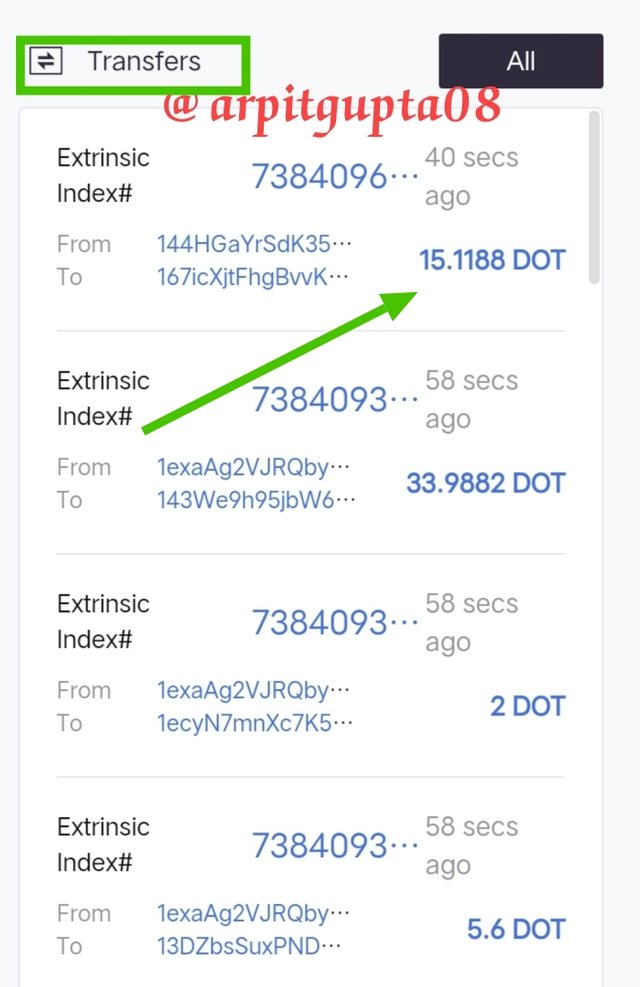
screenshots are showing total blocks formed 7,384101 and total transfers in the extrinsic index of the last transfer is 7384096.
Question 3
Make a purchase from your verified account of at least 10 USD of the currency selected in the previous point. Describe the process. (Show Screenshots).
Answer 3
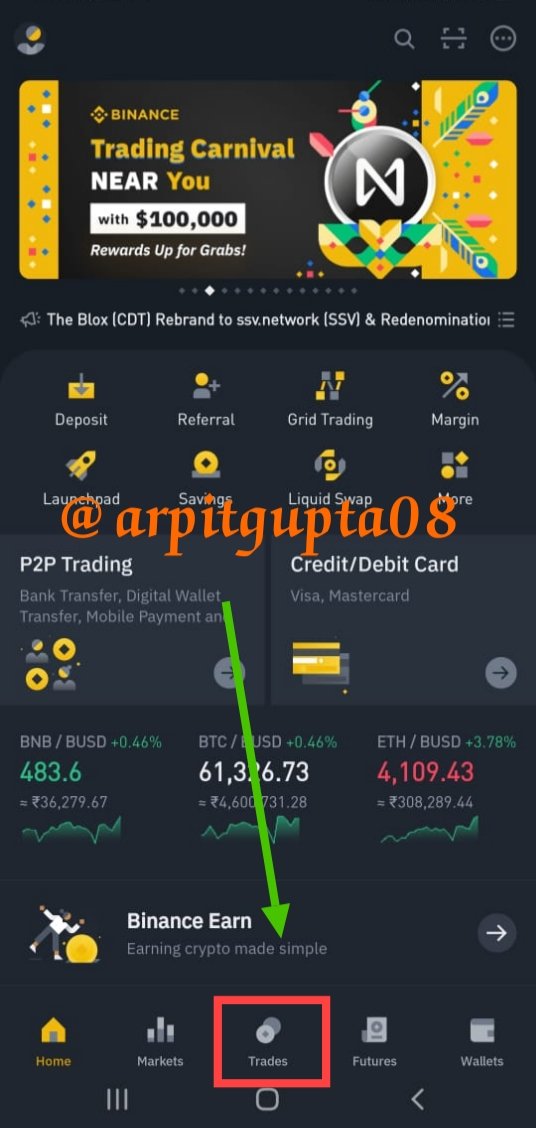
Now I am going to buy DOT/USDT with the help of binance application .
First of all open the application and login it , before trading one thing should remember that your account must be verified .
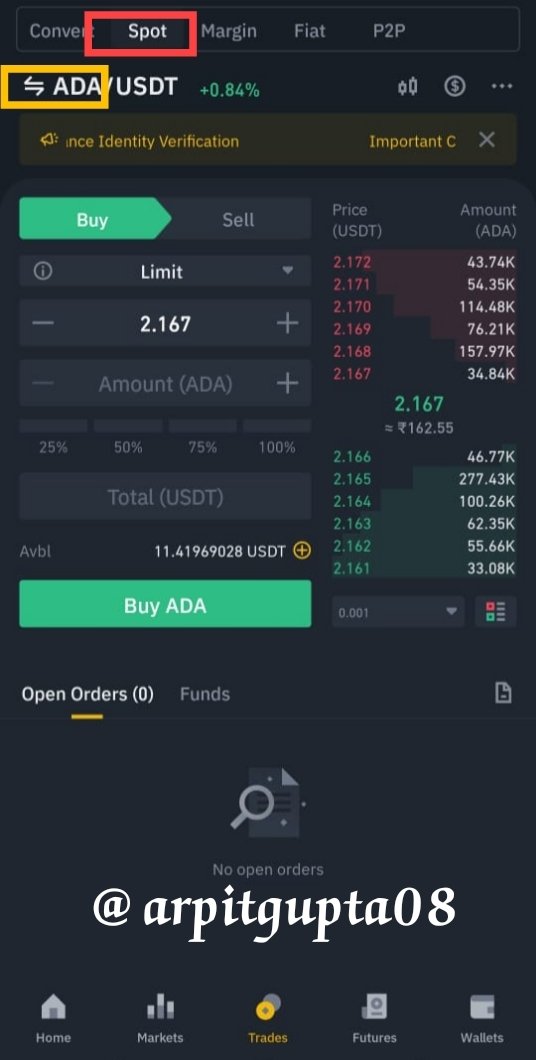
So let's start open the application and click on the trade option.
- In trades section, choose the trade type as Spot as viewed in screenshot then click the double arrow icon . ADA have been selected by me and I want to change it so i have clicked on it.
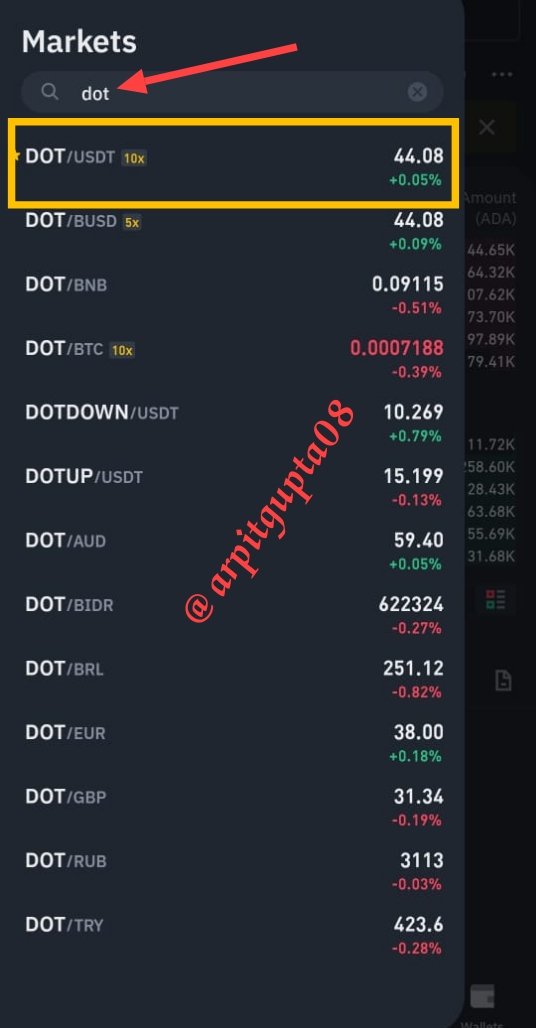
- In the appearing search bar I type DOT and many pairs of DOT have shown out of these pairs I have selected DOT/USDT .
• Now, the trading page opens where all the trading details are given in first column we have to enter at which price we are going to buy the coin , in middle the number of tokens get filled automatically and In last column enter the number of USDT and then click on buy .
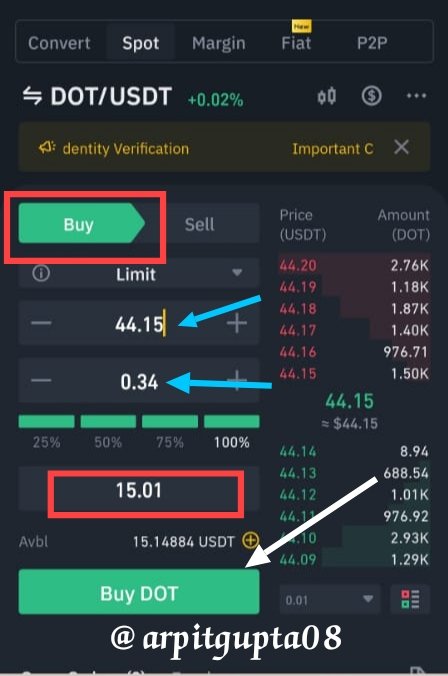
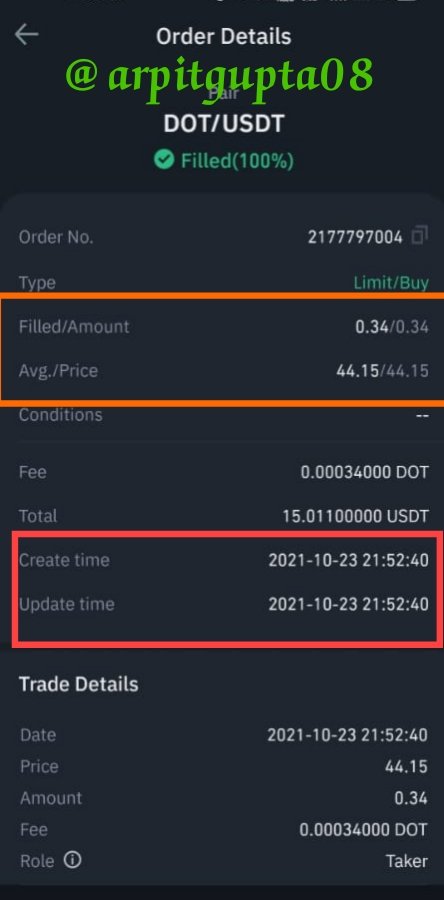
- At last transaction get completed
Question 4
Apply Fibonacci retracements to the previously selected asset with a 4 hour time frame on the platform of your choice. Observe the evolution of the price at 24 and 48 hours, did it go up or down in value? Look to identify resistance and support levels. (Show Screenshots at 0, 24 and 48 hours of purchase where the date and time are observed).
Answer 4
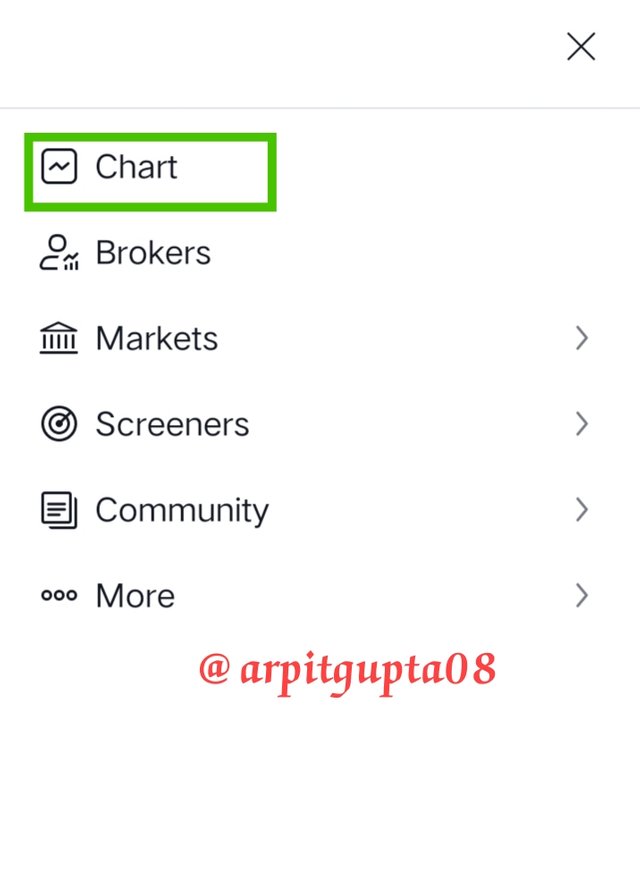
For the Fibonacci retracements I am using trading view site , go to the trading view website and click on the any of the chart at which you to apply Fibonacci retracements
After reaching on this , click the charts option given on the top as shown in screenshot.
4hr Chart of DOT
My all tasks regards with DOT so I show the DOTUSDT chart . I have entered DOT in search option and the chart get open then I have select the time 4hr as shown in given screenshot .
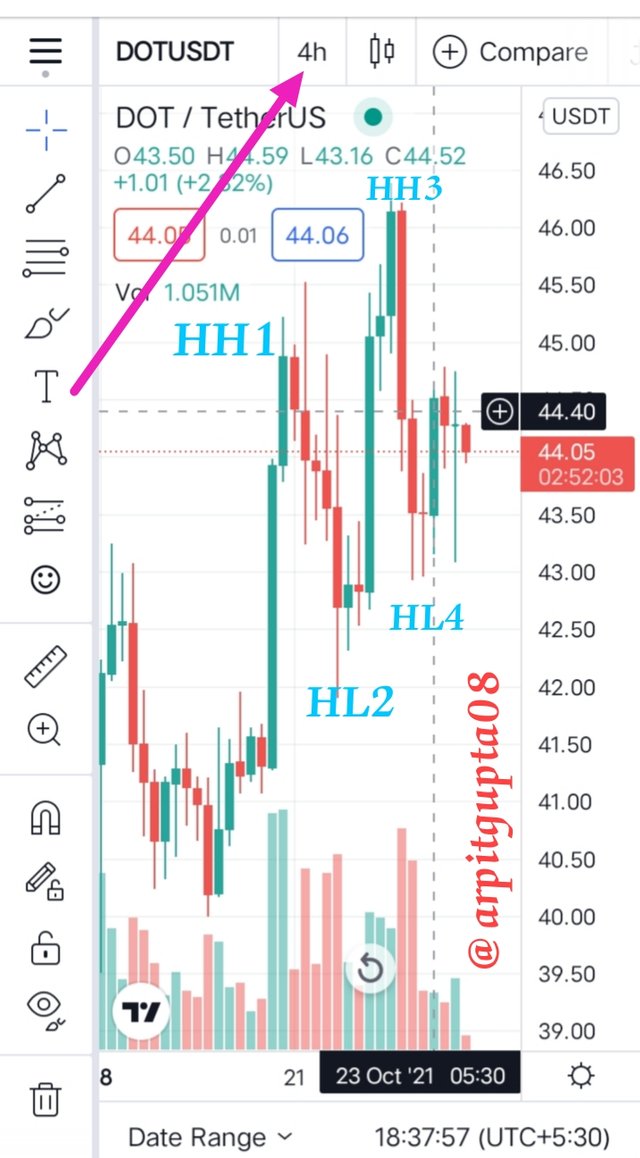
In this 4hr DOTUSDT chart , it is showing that market is shown Continues high and low bullish pattern as shown in screenshot. The coin made its first high low from HH1 to HL2 and similarly showing second high from HL2 to HH3 without breaking the previous pattern.
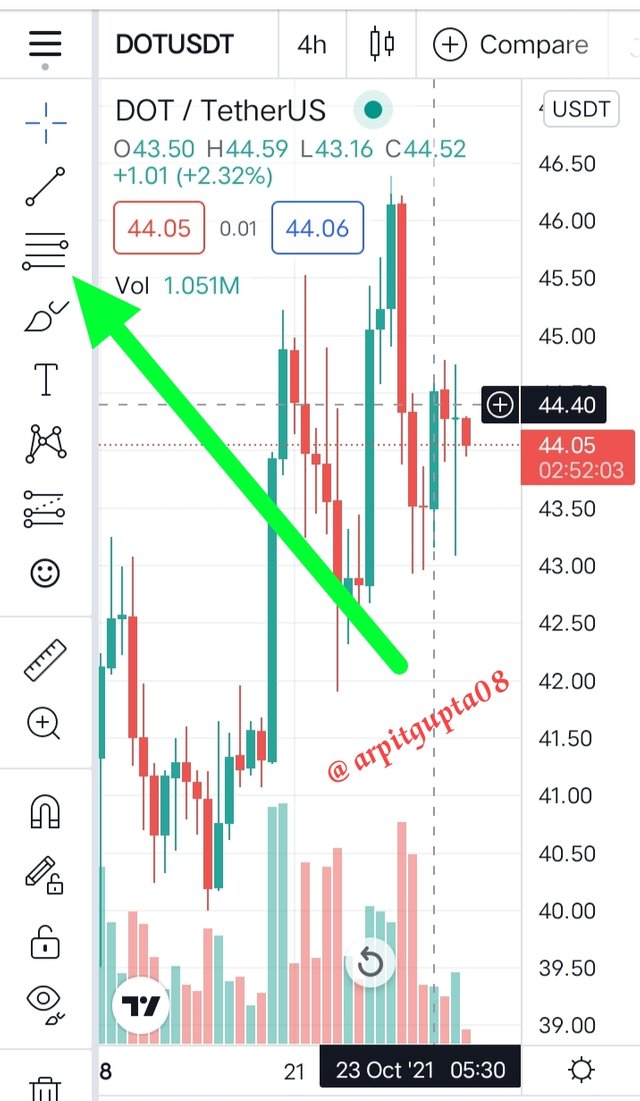
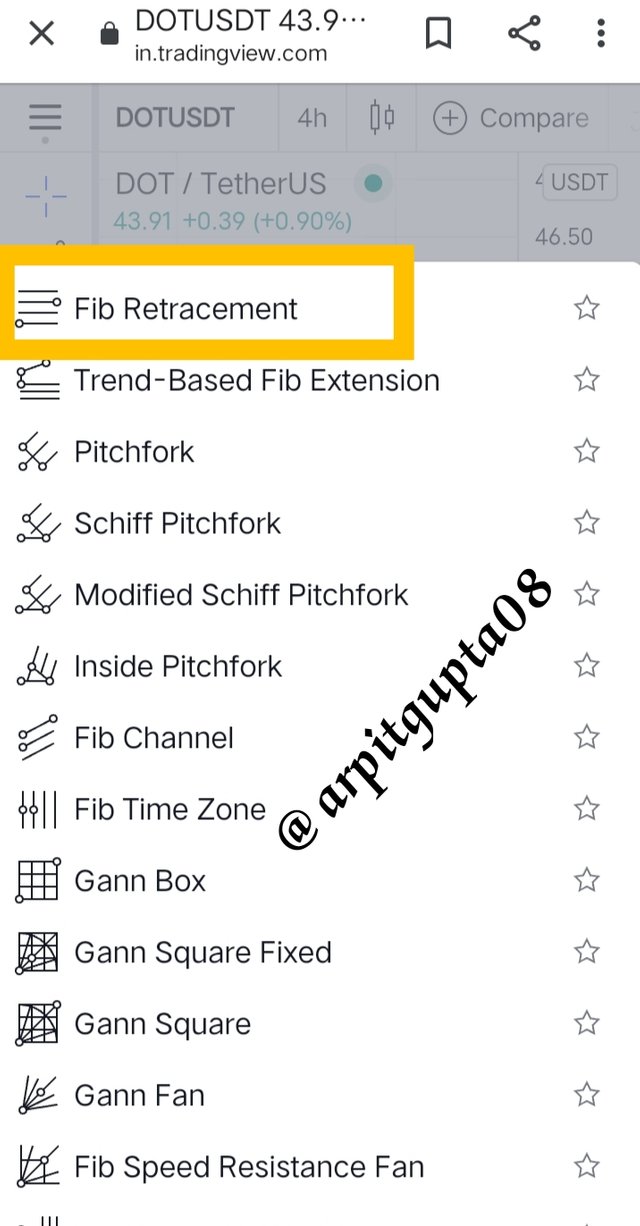
Apply Fibonacci retracements
Now, click on the Fib tool determined by 4 lines on the left side of the tools to apply Fibonacci retracements to the chart , select the Fibonacci Retracement and click it.
Now Fibonacci retracements get applied on the charts . Now draw febonacci retracement at which place you want to show it . I have draw it from previous HH to recent HL response .
Required screenshot is given below
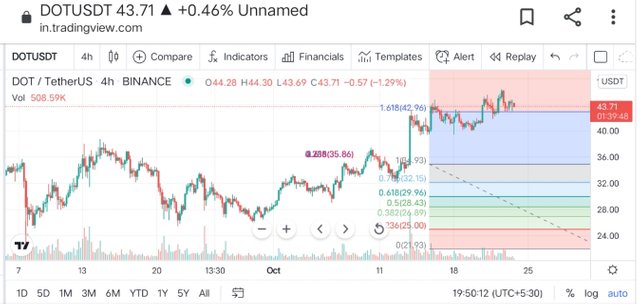
24 hr price
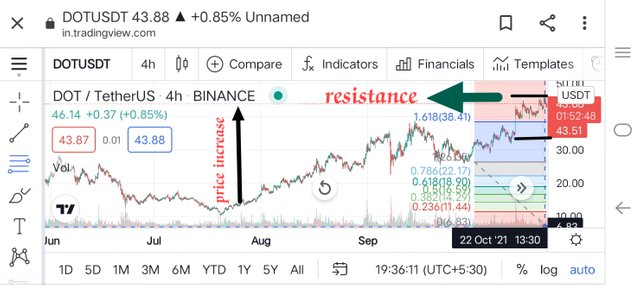
The price of DOT/USDT get higher in 24hr as it exceeds it's previous HH limit . It reaches its new HH price , the present price is $43.51 .the next price is calculated after 24 hr .
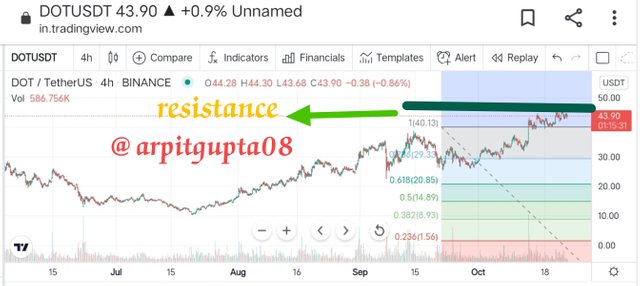
after 48 hours, DOT price touched resistance and the price get down approx $42.3 and again retraced it price approx $42.6
Question 5
What are Bollinger Bands? How do they apply to Crypto Technical Analysis? With which other tool or indicator do you combine Bollinger Bands to analyze a Crypto? Justify your answer.
Answer 5
Below or above the simple Moving average prices Bollinger brands are the kind of envelopes plotted at the point of standard deviation.
These brand tell whether the prices are higher or lower at standard level both of these brands (lower brand and higher brand) are used in pair.
**bollinger bands use two parameters
- Period
- Standard deviations
so for period default value = 20
For standard deviations = 2.
And the combinations are customized by the users.**
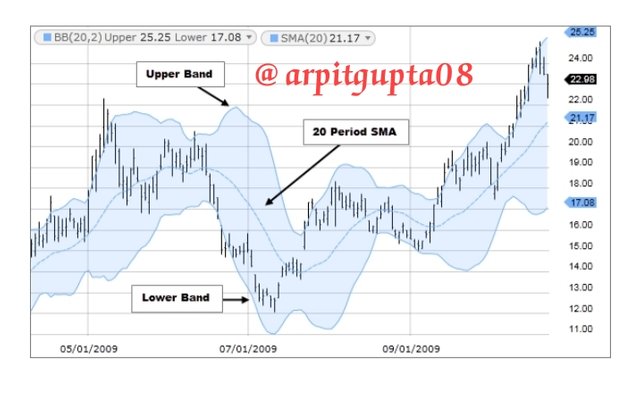
It consists a centre line and two price bands which are present upward and downward of the centred line. Bollinger Bands centered line is an exponential moving average. When we using the Bollinger brands the upper and downward acts as price target.
Implementation Crypto Technical Analysis of Bollinger bands
Bollinger bands shows loudness and quietness of the cryptocurrency.
The price deflects the lower band and goes upward the centre line then 20 day moving average.
The upper price target determined throug the upward band. During strong uptrend, the market price fluctuates between upward brand and the centreline.
When the same happens, crossing below the centreline or during the 20 day average warns downside then trend reverse that is why the traders use theese band for entry as well as exit of the market .
tool or indicator combine Bollinger Bands to analyze a Crypto
Stochastic oscillator used as indicator to analyse the crypto during during combination of Bollinger bands
The Stochastic oscillator is an indicator used by traders for the detection of the trend of asset and provide possible point of trend reversal.
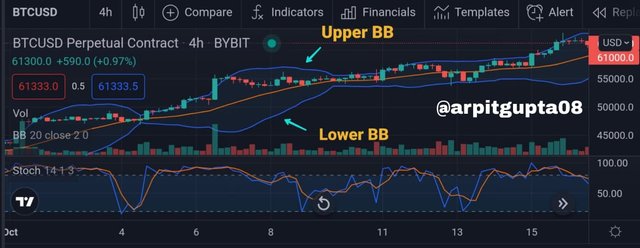
There are two line in stochastic oscillator
- first %K line
- second one is %D line
Already marked in screenshot .
When these lines are between 80 and 100, the assets is overbought and when lines are between 20 and 0, it called oversold. when the price bounces at upper Bollinger band then traders looked for the sell and at lower Bollinger band, traders looked for buy orders.

Fundamental analysis are the analysis which help to identify the market behaviour by reading relative economy and financial crises of Market where as technical analysis can be defined as prediction of the future of the Market.
Bollinger bands are the the kind of envelopes plotted at the point of standard deviation And also tell the loudness and quietness of the market .
The lecture is very wonderful and infomative and also written in very understandable language . Ihave learn a lot through this so I would like to thank professor @imagen for this knowledgeable lecture .
Gracias por participar en la Cuarta Temporada de la Steemit Crypto Academy.
Continua esforzandote, espero seguir corrigiendo tus asignaciones.
#club5050 😀