Crypto Academy Season 3 Week 4 | Candlestick Patterns | Homework post for @reminiscence01
Question 1 : In your own words, explain the psychology behind the formation of the following candlestick patterns.
- Bullish engulfing Candlestick pattern
- Doji Candlestick pattern
- The Hammer candlestick pattern
- The morning and evening Star candlestick pattern.
● BULLISH ENGULFING CANDLESTICK PATTERN
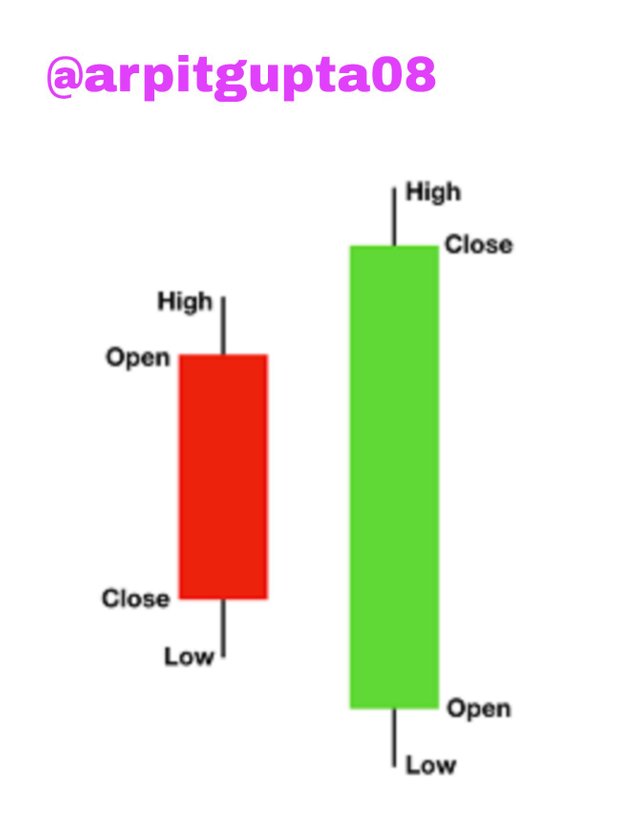
Basically, The bullish engulfing pattern shows when a strong green candle engulfs the prior red candle body in the chart and overshadows it. This pattern appears at the downward portion of a downtrend and in buying pressure, it indicates a surge. When at a time there are more buyers in the market, we see this type of pattern. It tells that selling pressure is losing its momentum.
bullish candlestick pattern
In the above chart, we can see that the price after the bullish engulfing pattern went in the opposite direction than before the pattern.
This pattern is another important candlestick pattern. The Doji pattern is a formed when the open price and close price of a market are almost exactly the same. This pattern can lead good profits.
There are three types of doji candlestick patterns that are discussed below:
Dragonfly Dogi :- This pattern shows the end of the downtrend there is Equilibrum at the supply and demand factors.
Long-Legged Dogi :- This is a Doji star with extended upper and lower wicks. It shows the indecisive sentiments.
Gravestone Dogi: This Dogi pattern appears on the other side of dragonfly doji. It shows the rejection in market for high price and shows reversal in price.
.png)
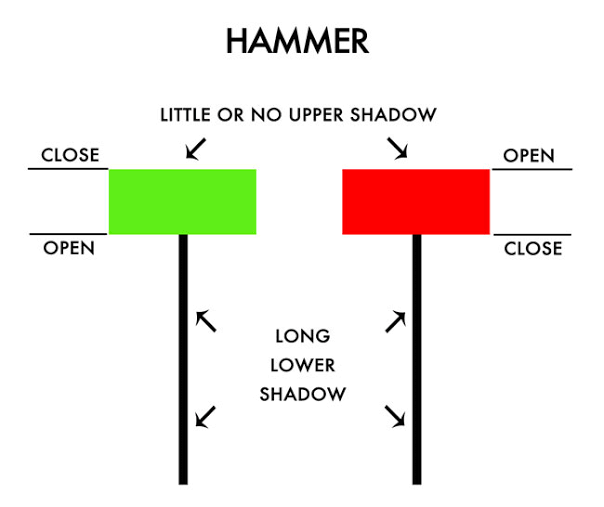
● THE HAMMER CANDLESTICK PATTERN
The Hammer Pattern, as the name suggests looks like a hammer. It shows that the sellers pushed into the market during the period but by the close, buyers had pushed the price back to near the open. It has a long tail and a shadow. The body of hammer is shorter than shadow by three times.
.png)
hammer candlestick pattern Source
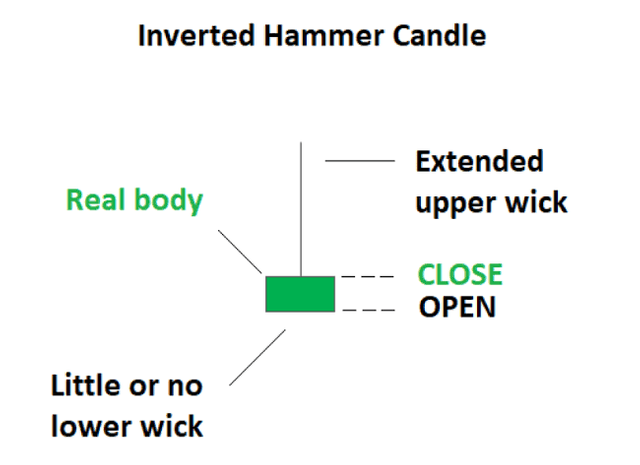
The reversal of the Hammer Pattern is The Inverted Hammer. This pattern is visible when there is a potentially bullish reversal. It is a warning that shows it can be a reverse in price.
.png)
reverse hammer pattern Source
(a). MORNING STAR :
The Morning Star candlestick is a pattern which has three candles. It signifies a reversal in the market and it can be used at the time of trading. The small candle which is in the middle sometimes can be a doji or hammer.
(b). EVENING STAR:
It is in the opposite direction of the morning star. Evening star pattern is the bearish version of the Morning Star and it signs that there is a potential turning point in a growing market.
Question 2: Identify these candlestick patterns listed in question one on any cryptocurrency pair chart and explain how price reacted after the formation. (Screenshot your own chart for this exercise).
Well, for this question I have listed the candlestick patterns that are discussed above in the pairs of different coins. They are given below:
● BULLISH ENGULFING CANDLESTICK:
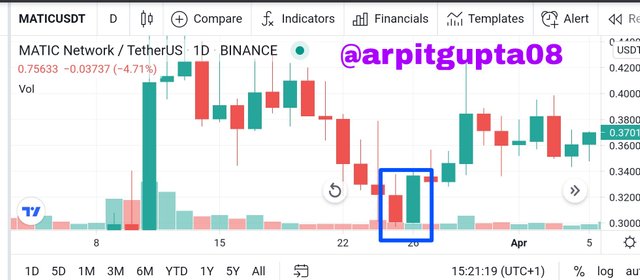
Bullish Engulfing on Pair of matic/usdt
As we can see in the above screenshot of Matic/usdt pair, The bullish engulfing pattern appears at in march and after the pattern, the price rised.
● DOJI ENGULFING CANDLESTICK PATTERN:
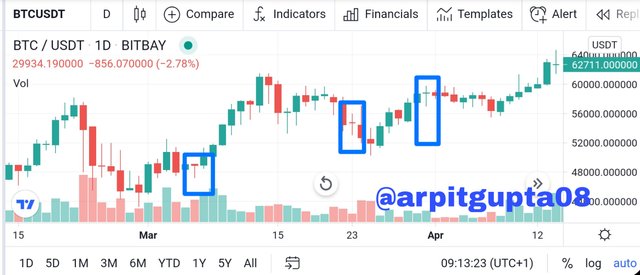
Dogi pattern on pair of BTC/USDT
In the above screenshot, as we can see that there is not much fluctuation (up or down) in price of BTC after the doji pattern.
● HAMMER CANDLESTICK PATTERN:
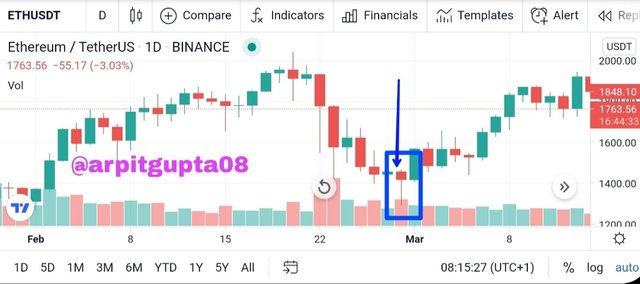
Hammer Pattern on pair of Eth/usdt
In the above screenshot, we can see that in the pair of eth/usdt, when the hammer candlestick pattern appears in the chart, the price went upward by a high rate.
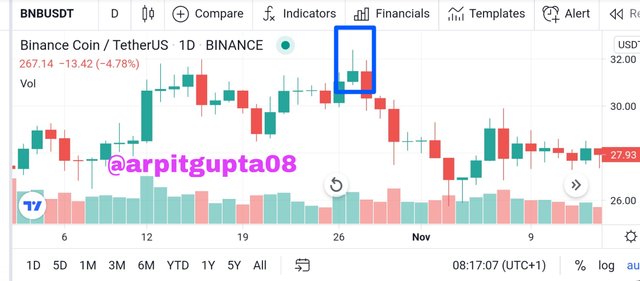
Inverted Hammer on pair of bnb/usdt
When the inverted hammer pattern appears, the price went down at a high rate, As this is the reversal of hammer pattern.
● THE MORNING AND EVENING STAR CANDLESTICK PATTERN:
- MORNING STAR:
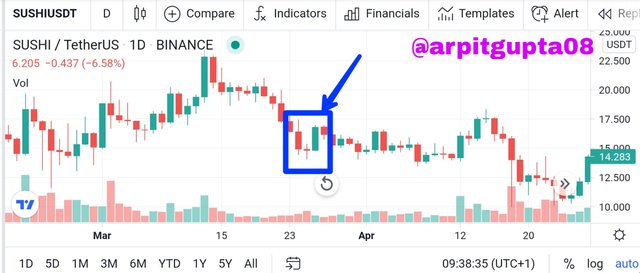
Morning star on pair of sushi/usdt
After the formation of morning candlestick pattern, there is a sign indicator of the price going in upward direction.
- EVENING STAR:
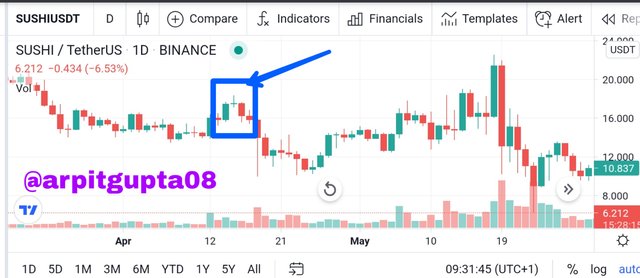
Evening star on pair of Sushi/usdt
When this evening star candlestick pattern appears, it shows that the price will result in downward movement of market.
Question 3: Using a demo account, open a trade using any of the Candlestick pattern on any cryptocurrency pair. You can use a lower timeframe for this exercise.(Screenshot your own chart for this exercise).
Actually, to answer this question, I opened a demo account on cmcmarkets For opening a demo account, it will ask you for email id and password.
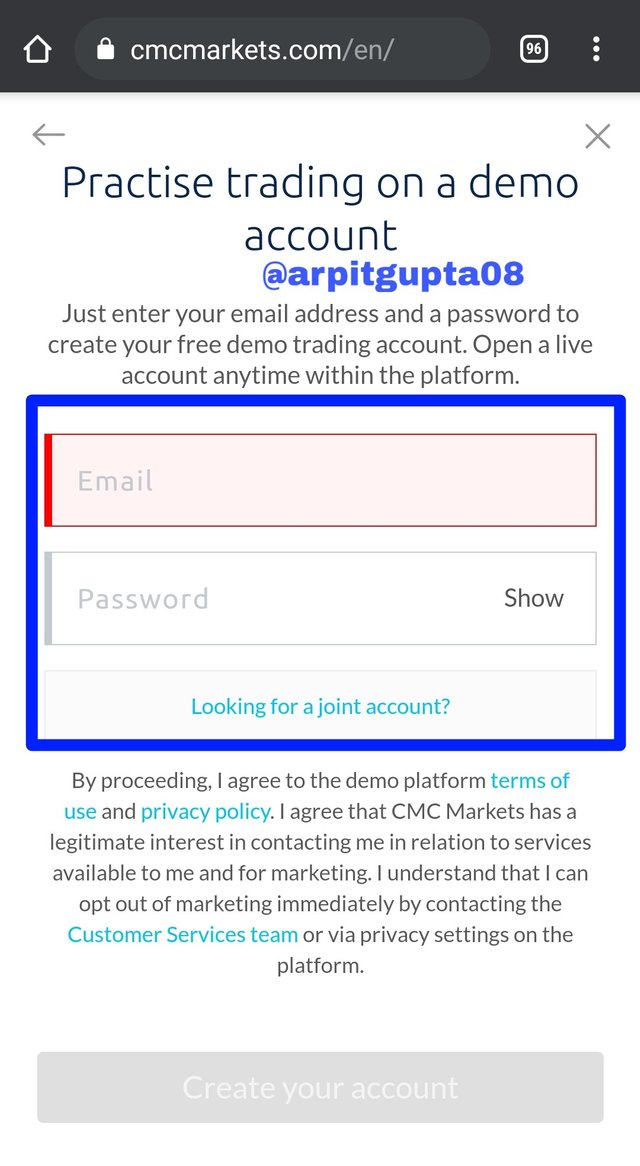
After providing email and password, will send a code on you email id. I Entered it and my demo account has opened.
I clicked on the cmc cnh index and the chart appears on that.
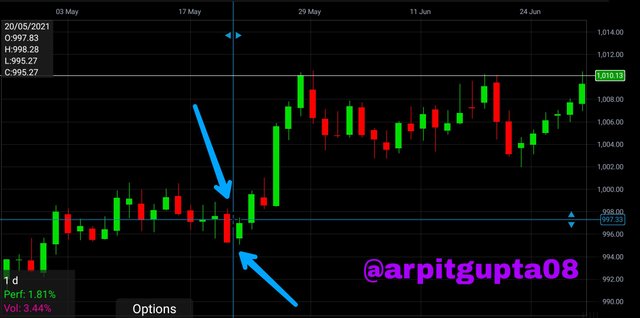
As when the Bullish Engulfing pattern appears on the chart when i market buy, the price gave me a confirmation that, the price began to rise in the market.
CONCLUSION
There are many types of Candlestick Patterns, that are very useful to know the position of market and when the price will go up and will go down. The topic of candlestick pattern is very well explained by professor @reminiscence01. I understood all the points and it gave me much interest. Thanks to the professor for this task.
Thank you.
Cc:-
@reminiscence01