TRENDING MARKET - CRYPTO ACADEMY SEASON 5 / WEEK 1 / HOMEWORK POST FOR PROFESSOR @reminiscence01
INTRODUCTION.
TRENDING MARKET.
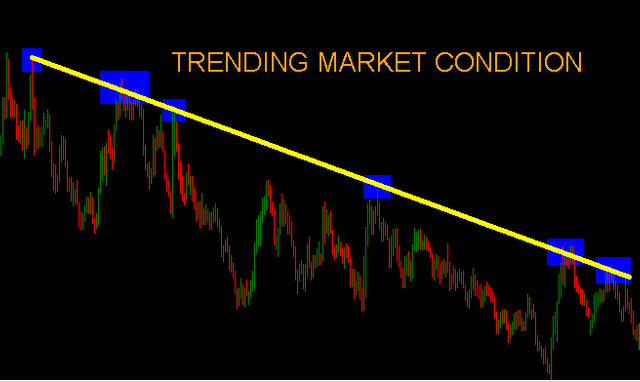
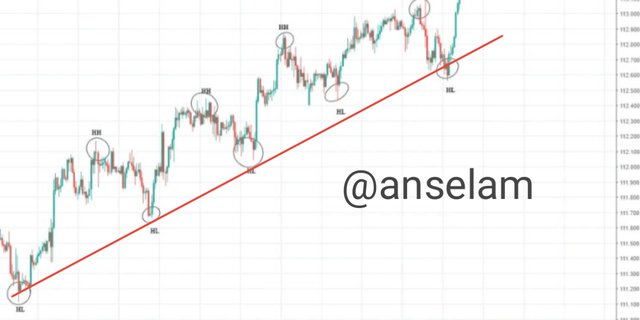
A trending market is the situation which the price of an asset is generally moving in one direction, it could be moving down or it could be moving up. Usually, the price may go against the trend in many trading sessions, but the chart of a longer time frames would show that those were just retracements.
These trends are always noted by the “higher highs” and the “higher lows” in the case of an uptrend and the “lower highs” and the “lower lows” in the case of a downtrend.
BULLISH AND BEARISH TRENDS
BULLISH TREND
A bullish trend, or bull run, is defined as a long period of time where the majority of the traders are buying, the demand outweighs the supply, the market confidence is high, therefore making price of such asset to rise over a period of time. During this period, the price keeps forming higher highs and higher lows.
BEARISH TREND
This is the reverse or opposite of the bullish trend. Here, the price action is rather going on a downtrend consecutively. This is the period of time where the price keeps forming lower highs and lower lows. It signifies the period where the supply is greater then demand. Even if the price might move up at some intervals, the overview of the price in a longer time frame will show that it was generally going on a downtrend.
TREND IDENTIFICATION.
Market structure.
The structure of the market can be used in identifying market trends, be it a bullish trend or a bearish trend.
Bullish trend
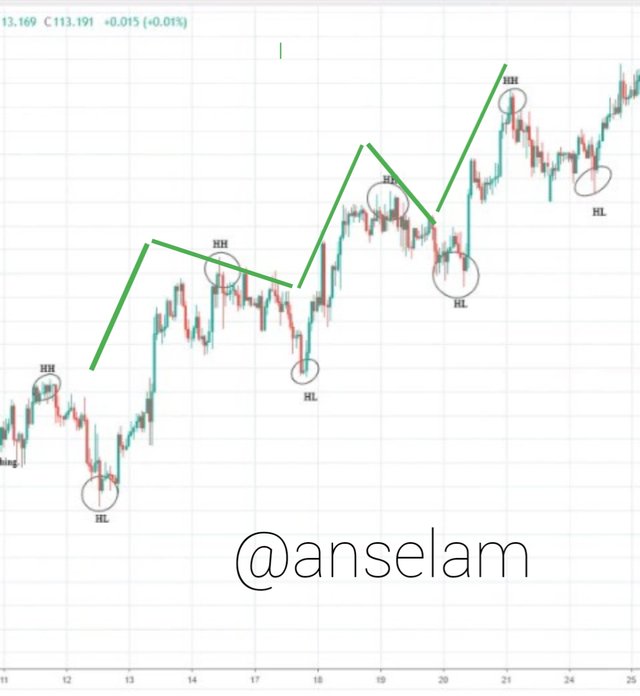
The bullish trend can be identified by it's market structure. Here, the next price movement is always forming a higher high and a higher low, thereby making the price to be on an upward movement generally.
This means that the highest price of a particular trading session I'd always higher than the highest price of the previous session. This is also the same case with the lowest price as that of the next session is always higher than that of the previous session.
Bearish trend
As we know already, this is always the opposite of the bullish trend. In this particular trend, the price action of the next trading session forms a lower low and a lower high, thus the bearish trend.
This implies that the lowest price of the next trading session is always lower than that of the last session and the highest price of the following session will also be lower than that of the previous session.
Trend lines.
Trend lines can also be used to spot trends on a chart. It can be used to identify a bearish trend and it can also be used to identify a bullish Trend.
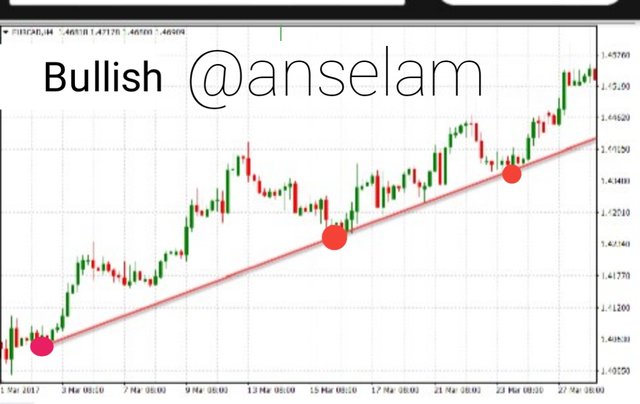
Bullish trend: A bullish trend can be spotted with the help of trend lines. To do this, you need to mark out the the lowest points in the price action of the chart. After doing this, you then join those points with a straight line. If the price is trading above the trend line, then it is a bullish trend.
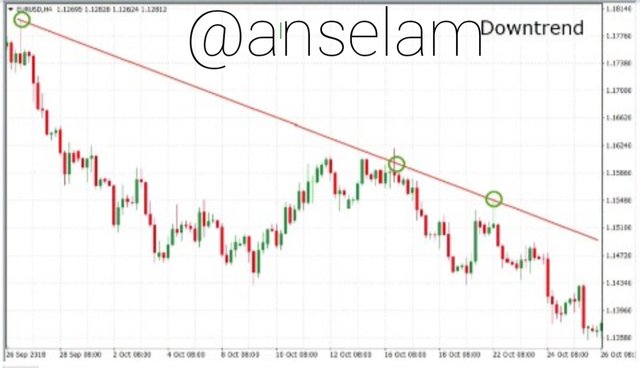
Bearish trend: To identify this particular trend with a trend line. You need to mark out high point of the price action and join them with a line. You will find out that the price is trading below the trend line if it is a bearish trend.
TREND CONTINUATION
Trend continuation in which the price chart of an asset moves up continually without any previous high being higher than the new high for a bullish trend or without any high point going below the previous low point in the case of a bearish trend.
HOW TO IDENTIFY TREND CONTINUATIONS WITH MARKET STRUCTURE.
For a bearish trend, you can identify it using market structure by checking the points in the price. If there is no high point that gets to the previous low potassium and all the low points are lower than their preceding low points, then there is a continuation of the bearish trend.
For the bullish trend, you also need to check for the low and high points. If there is no low point that is higher than the previous low and all the high points are higher than their preceding high points,then there is a continuation of the bullish trend.
IDENTIFYING TREND CONTINUATIONS USING TREND LINES.
It is quite easy to identify trend continuation with trend lines. If there is trend continuation in a chart, the price will not go below the trend line in the case of a bullish trend; the price does not break below the mark followed by the trend line. If it does, then it is a sign of trend reversal.
For the bearish trend, the price does not go above the trend line. The trend line is a dynamic resistance in that case and any deviation like the price breaking above the trend line signifies a trend reversal.
ANALYSIS OF A CRYPTOCURRENCY PAIR TO IDENTIFY THE TREND - THE ETH/BUSD PAIR.
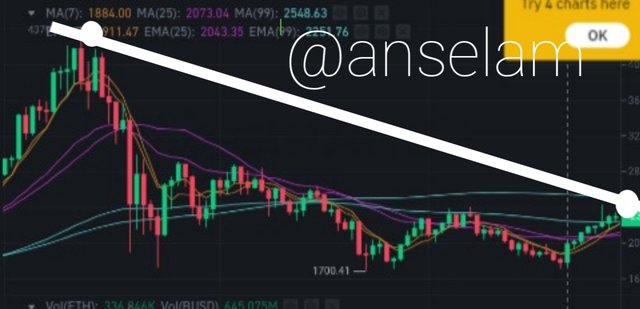
In analysing the chart of the ETH/BUSD pair above, it can be seen that;
I - The market is trending because it can be easily observed that it is generally moving in one direction. Some retracements can so be seen as the price keeps hitting resistance levels and then retracing to continue the trend.
II - The market is currently witnessing a bearish trend as the price action keeps forming lower highs and lower lows as it goes into the future. The trend line drawn on the chart shows that the price is trading below the trend line and that signifies a bearish trend.
The price is currently on a little bullish movement, but it is expected to retrace and continue the bearish trend by forming a lower low. A violation of that will mean a trend reversal and the trend will be invalidated.
CONCLUSION.
Trends are very essential aspect of technical analysis and it helps investors to make good trading decisions, but you need to Know how to identify these trends properly before you can take advantage of it.
Being able to identify it using the Market structure or the trend line will also help the investor to in choosing a good entry point, especially when retracements are spotted.
Thanks for your time. Special thanks to professor @reminiscence01 for the lesson, Cheers.
Hello @anselam , I’m glad you participated in the 1st week Season 5 of the Beginner’s class at the Steemit Crypto Academy.
Unfortunately, you have failed to adhere to the homework guidelines. You have copied charts from the the internet which are not cryptocurrency asset chart for your work. In this homework task, you are meant to use your own original screenshots to prove your understanding of the topic.
Also, you haven't powered up to 150 Steem in the last one month which disqualifies your submission for #club5050.
Thank you for your interest, we hope to see you in the next homework task.