Steemit Crypto Academy || Season 3 || Week 8 - Homework Post for Professor @cryptokraze. Trading Sharkfin Pattern
How are you my friends I hope you are all well and well. This week of season 3 is 08. I have come here to make my homework post for the cryptocurrencies so that I can learn from their good lectures.
1. How much do you understand about sharkfin patterns? Explain with examples (charts required)
Sharks describe the fin pattern as a sudden reversal of a trend. Which appears on a graphic shown in V shape.
The reverse is positive. This market can be negative from the moment, for example, if it is above the average line, then this negative market can be in the moment. And when it's below the average line. So it is in the form of V. And you can easily recognize that.
Here I can tell you clearly. That it can be as helpful as anyone else. And it works by looking at the situation in the market. And it stands out because of its shape. I have given the screenshot below so you can see.
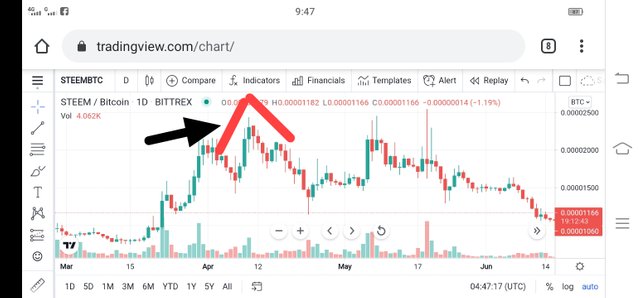
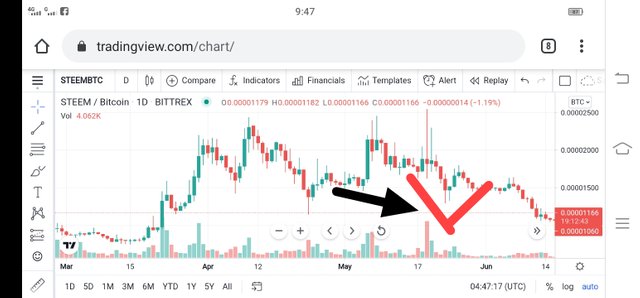
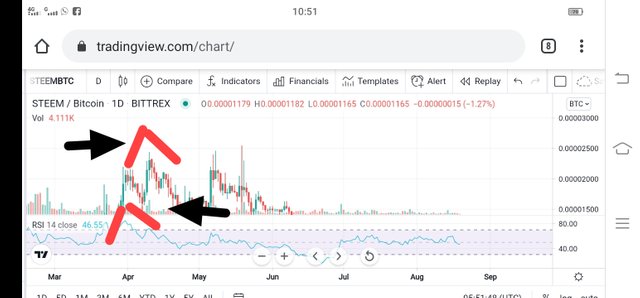
Take a look at the shorts above when the market is down and moving fast. Then it moves upwards. In this case it becomes a V shape. You can see it on the V shape chart. On the other hand, when the market goes up and then it goes down sharply, there is an inverted V on the chart. This is called a sharkfin pattern.
Here you can see that in the SteemBtc chart with a time frame of 15 minutes, it can be seen that the market was moving downwards. And all of a sudden it goes up fast and starts moving upwards. This creates a quick V shape at the top.
In this above chart of Steam BTC, the market movement was upwards and then quickly it came down. And it has made an inverted V shape on the chart.
Q No-2.Implement RSI indicator to spot sharkfin patterns. (Charts Needed)
One thing to keep in mind. That a trader cannot analyze the market on a chart without an indicator. There is always the possibility of fake signals and patterns on the chart. Similarly, the sharkfin pattern can sometimes be the wrong signal. And a trader can lose everything. It is recommended to add some indicators to the chart. And the trader must first look to confirm the pattern. Then you have to enter the market again. When we put the RSI indicator on this chart. So the trader should look for the sharkfin pattern on the chart. I will show examples of sharkfin pattern here with the help of RSI indicator.
Blush reversal sharkfin pattern.
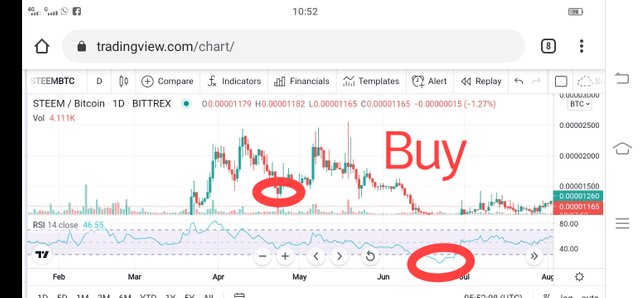
When the boom reverses, the sharkfin pattern is at the end of the down trend market. When the market is down. And suddenly it makes a reversal upwards. So the trader must see the RSI indicator. And it must be below 30. When reversed. So after that, RSI should also go up. And cross the 30 value line. In that case the blush reversal sharkfin pattern would be correct. And the trader should come to the market with a long position.
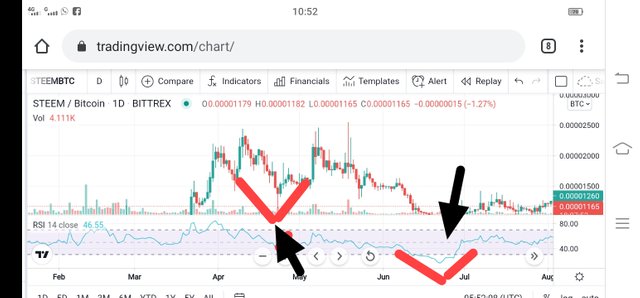
I have given the screenshot above. You can see that a V-shaped pattern has been formed and the RSI is below 40 at the same place. Then the market started moving upwards and RSI also moved upwards. When the RSI enters the area above 30, a trader can take a strong position in the market. Thus the Bullish Reversal Sharkfin pattern should be confirmed with the help of RSI.
Bearish reversal sharkfin pattern.
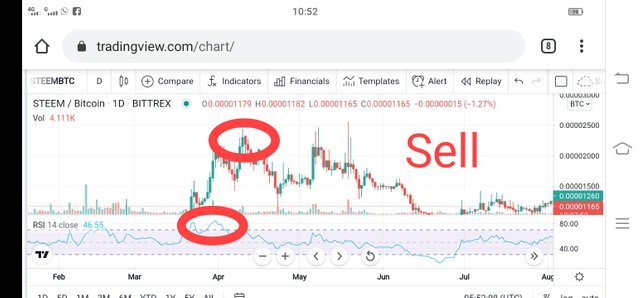
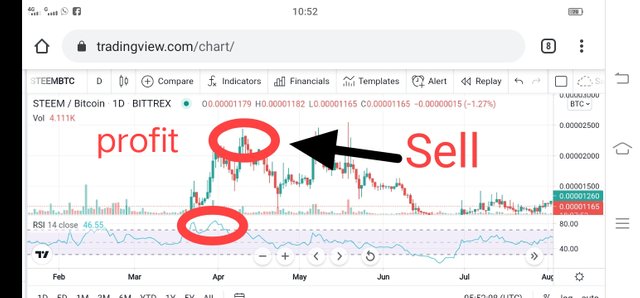
The bearish reversal sharkfin pattern is formed at the end of an up-trending market. When the market moves upwards, it suddenly moves downwards, and becomes an inverted V-shaped pattern, the trader should look at the RSI value and it must be above the 70 value line. If the RSI is not above 70, it could be a false signal and lead to losses.
When there is an inverted V pattern on the chart and the RSI is above 70, it is a bearish reversal sharkfin pattern. The trader should wait for the RSI to go below 70 and his market should continue its downward trend. When the RSI moves below the 70 line, a trader can take a position here.
Q No-3 Write trade entry and exit criteria to trade sharkfin patterns (charts required)
Here I will explain the criteria for entering into a trade, buy or sell. When you have to take a position in a market. It is very important to follow that first. On crypto exchanges, only the purchase option is available for trading corrupt assets. While on MetaTrader 4 and Margin Trading platforms, cell positions can also be taken. Which is good for the trader.
Admission criteria for position purchase.
RSI should be applied to the chart with its default setting. Lines between 30 and 70 should be available on the RSI indicator. And which shows the overbought or oversold position of the asset. The trader must wait for the market. So that it has the advantage of moving rapidly downwards and then making a quick reversal upwards to form a V pattern.
The trader should be aware of this. And must confirm. That the RSI has gone below 30. And the ones that are selling better. And then it should go above 30 and the V-shaped pattern should be on the RSI indicator.
When the RSI goes beyond the 30 line. So the trader should come to the market with a long position or come into the buying trade. This move of RSI above 30 line should be very clear. A sharkfin pattern was created on the charak. Yes, this must be confirmed.
Admission criteria for sale.
When you start selling, the RSI should be applied to the chart along with its default value. Lines for both 30 and 80 values should be on the RSI indicator to indicate the overbought or oversold position of the corrupt asset.
Here the trader has to wait for the fast moving upwards and quickly reverse downwards to form an inverted V-shaped pattern on the chart so that it is good for him.
Here, the trader should confirm the RSI line and it should be up to 80. In which more purchases are visible and then it should go below the 80 value line to form an inverted V shape.
The trader should take a position when the RSI is clearly below 80 and the market continues to move downwards. The move of RSI below 80 should be very clear.
Exit quality for sales position.
If the market moves in the opposite direction, you should set a stop-loss level to avoid major losses.
When selling, in the selling position, the stoploss should be above the swing high of the sharkfin pattern.
If the market moves in the opposite direction and the stop-loss level is affected, it means that the setup for trading is wrong and the trader should leave the market.
If the market moves forward, the level of tech profit should be set by the trader.
The takeprofit level should also be set at 1: 1 R: R (Risk: Reward) which means it should be equal to Stoploss.
If the market moves forward, the level of tech profit will be affected and buying and selling will automatically close with a profit. That way, the trader will book a profit and exit the market.
Q No- 4. Do 2 trades based on sharkfin pattern strategy
Here I will show the trade done in my own way based on the sharkfin pattern strategy.
Let me tell you about the trade with my friends here. I have taken a long position on LTCUSD in a time frame of 10 minutes. The RSI was below 40 when the Bullish Reversal Sharkfin pattern was formed. When the RSI entered the area above 40, I bought it. Takeprofit and Stoploss have a 1: 1 R: R (Risk: Reward) ratio.
Here I have taken a position on ETHUSD in a time frame of 20 minutes. The RSI was below 40 when it was made on the Blush Reversal Sharkfin pattern chart. Then when the RSI entered the area above 40, I bought on it. Takeprofit and Stoploss have a 1: 1 R: R (Risk: Reward) ratio.
Result
Friends, in this lesson I have learned a lot and learned about a new strategy and this is about trading the sharkfin pattern. We bought and sold. The two also discussed the quality of entry as well as the quality of exit. If a trader enters the market after confirming the quality of entry, it can give very good results. And the trader can also benefit from this strategy.
Thanks
Thanks all