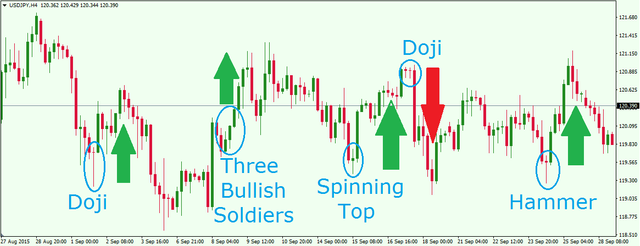
Japanese candle stick patterns - Steemit Crypto Academy Season 4 - Homework Post for Task 10
b) In your own words, explain why the Japanese Candlestick chart is the most used in the financial market.
c) Describe a bullish and a bearish candle. Also, explain its anatomy. (Original screenshot required)
Japanese candlestick
A candlestick chart is a charting technique used to describe the price movement of a security, derivative or currency. This technique was created by a Japanese mathematician and was used in rice trading and then later in the stock exchange after the candlestick evaluation technique became famous. Sadly, Western traders never got around to understanding it, but Eastern traders eventually used the technique to trade stocks. They are trading charts that are comprised of candles or sticks with a hollow or filled region representing movements up or down respectively. The high and low for each time frame are noted on the vertical ticker at the top, and prices are marked with thin lines on either side of these values. Understanding what kind of candle your instrument is drawing can be key in predicting its next movement. If you see a bearish candle, it means that the previous trend is likely to continue. Although they can be used as a stand-alone trading tool, candlestick charts are really most effective when used in conjunction with other analytical techniques and indicators.
Candles are either bullish or bearish because their composition represents the difference between current closing price and the opening price, which is always zero. A hollow candle implies that the market closed lower than its opening price for that time frame, while a filled candle indicates the opposite. Candles are also referred to as either “real bodies” or “wick bodies” based on how they are traditionally drawn by hand, but all of these terms refer to the same thing.
There are several different types of candlesticks, but the most commonly traded are the “hammer”, “signal” and the “combination”. The hammer is a bearish signal with a small body that is closing below its opening price while the combination is bullish with a medium-sized body that closes above its opening price. Other candlestick shapes include:

Candles also tell you which time frame your instrument is in. If the candle is bullish, it means it's moving higher while a bearish candle implies that it's moving lower. This can be used to differentiate between trends that are fixed and trendless, or one that may turn into another thanks to exhaustion. The combination candle is also helpful in determining what timeframe your instrument will retrace back to before continuing on its upward trend. The fourth type of candle is called an “outside down” because it forms opposite of other candles. It has two significant lower wicks (lower than opening price) and one higher inside wick (above opening price). It is considered to be a warning sign that the trend might be coming to an end.
Uses of candlestick in japanese market
These are the major uses of the candlestick chart in financial markets. However, many traders who find these uses too simple, or who want to apply the theory in a more sophisticated manner, also use it for following things:
Candlesticks are used for price action so they are basically used to identify market trends. The reason for this is that candlesticks contain more information compared with other technical indicators. For instance, they show us how far up or down prices have traveled during a certain period of time i.e. whether the trend is up or down.
Japanese candlesticks are different from standard candlesticks in that they are not based on price, but rather on time. Therefore, each candlestick represents the difference between the opening and closing prices for a specific time period. The color of the actual body of the candle is also based on time. For instance, if the closing price is higher than the opening price, then it will be green or white (depending on what color scheme you use). However, if the closing price is lower than the opening price, then it will be red.
Bearish candle
The chart below shows an example of Candle on USD/EURUSD Daily Chart.

Source

