Steemit Crypto Academy Season 4 - Homework Post for Task 10, Candlestick Patterns
a) Explain Japanese candlestick chart ? (Original screenshot required).
b) In your own words, explain why the Japanese candlestick chart is the most widely used in the financial market.
c) Describe a bullish and bearish candle. Also, explain their anatomy. (Original screenshot required)
The Japanese candlestick chart has its origin in Japan, it was used by rice traders and it turned out to be very effective, since then it has been one of the most successful in the stock markets, it is a chart that provides detailed information on the price, since either in its unit or in a collective with the formation of patterns and tendencies.
This chart can be configured for any time frame, these range from minutes to hours, days, weeks, even months, by adjusting this time frame, each candle on the chart will represent what happens with the price in this specific time. Most important platforms both free and paid, next I will show you a chart of Japanese candles of the ADA / USD pair in 5-minute timeframe, for this I will use my commonly used platform tradingview.com.
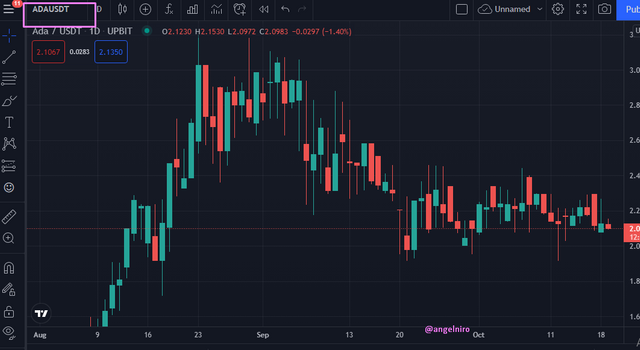
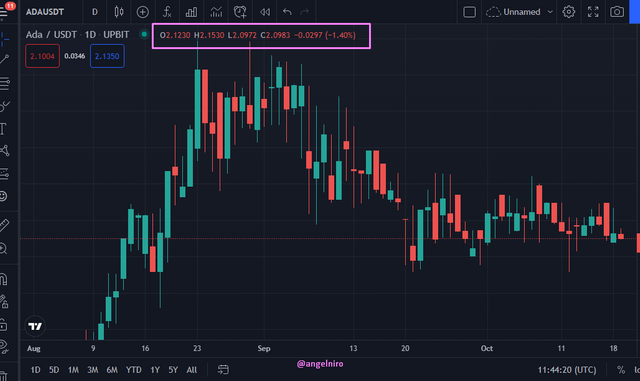
As we can see in the graph, each candle represents a defined time of 5 minutes, this candle presents us with detailed information of the price movement in these 5 minutes, it gives us the opening price, the minimum price, the maximum price and the price of closing, we can see these values in each candle when placing the pointer over them, here I show you how these values of a candle look.
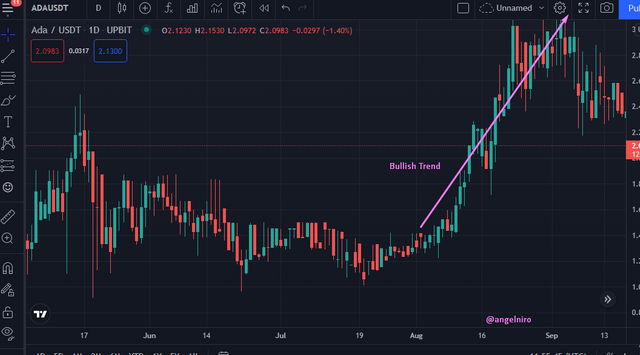
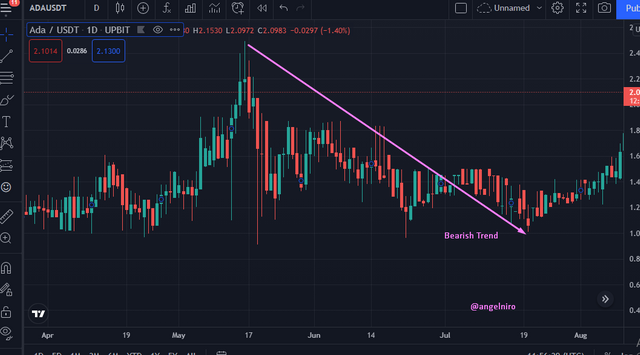
This type of graph allows us an easy interpretation of the price movements, in them we can see the formation of both upward and downward trends, for this we have tools to mark these trends, we can also point out supports and resistances and thus see if the market is in a trend or price range.
There are multiple functions that this type of chart presents, we can customize it and add indicators alone or together to carry out our technical analysis, it presents drawing tools and analysis tools, all this in order to provide the trader with the greatest amount of functionalities when determining what will happen to the price and thus knowing when is a good time to make a purchase or a sale.
With this type of graph we can study the movements in a large number of markets, for example the use that I know the most is with cryptocurrencies, with this type of graph we can have access to a large number of pairs for our analysis before making our investments .
I think that the great acceptance of this type of charts in the financial market is linked to the great ease of interpretation that it presents us, due to this a beginner trader can interpret good entry points in a position and an experienced trader can develop to the maximum your experience to make purchases and sales and thus obtain a return on your investment.
Also, the information provided both individually, 1 candle, as well as many of them together, can reflect the emotions of the market and give signals to traders after a correct identification of the different patterns that are formed in the market and that present us with signals. for our investments.
In the same way, these signals from the patterns can be complemented in a very effective way with technical indicators, with this, the confirmation and complementation of the patterns and the signals emitted by the indicators are sought to perform operations that generate profits, at the same time trying to Minimize the always present risk when operating, for all these aspects I think that the Japanese candlestick chart is the most used and personally it has given me very good results applying all the aspects that I mentioned above.
These indicators, such as the chart itself, can be personalized, this in order to create analysis strategies according to the experience of each person, the market can also be studied only with the movement of the price, this is more oriented to experienced and analytical traders than just by seeing the price movement you can make decisions to trade, this on other charts is practically impossible.
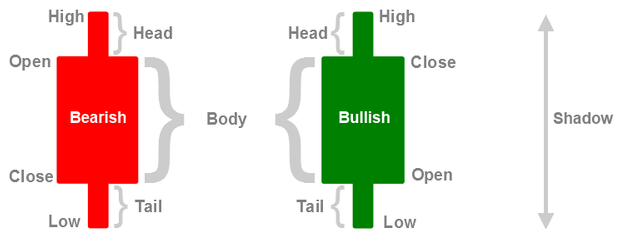
Japanese candles can be presented in a great variety, we can find bullish or bearish Japanese candles with or without upper shadow, with long or short body, we can find bullish or bearish dojis but below I will present two examples, one of a bullish candle and one Traditional bearish, which shows us information about the opening, closing, maximum and minimum price, this varies the order depending on whether it is bullish or bearish, the examples will also have shadow or upper and lower wicks and the real body that is the route what the price does from the open to the close.
Bullish Candlestick
As you can see in the image I made to represent my example, a bullish Japanese candle indicates the increase in price from when it opens to when it closes, the more difference between these two, the longer the final body of this candle will be, it is generally green color and its complete anatomy is represented as follows.
Lower shadow: The lower shadow of a bullish Japanese candle represents a wick that indicates the difference between the opening price and the low at which the price falls.
Real body: The real body is the increase that the price makes from the opening to the closing of it.
Upper shadow: The upper shadow indicates the difference between the maximum price of the candle and its closing price.
Bearish Candlestick
A bearish Japanese candle represents a decrease in price, this decrease is represented from the opening to the closing of the candle, the more difference the longer the candle will be, in the image we can see an example of it and its complete anatomy is as follows.
Upper shadow: This upper shadow or wick is comprised of the opening price and the maximum price reached by the candle.
Real body: The real body of the candle represents the decrease in price from the opening to the closing of the same, the more decrease the larger this candle will be.
Lower shadow This is the difference between the minimum at which the price of the candle reaches and the close of the candle, like the real body, the more difference between these two values, the larger this wick or shadow will be.
The Japanese candlestick chart is one of the most used by traders, merchants and investors around the world, this is due to its easy interpretation and the formation of patterns that when well interpreted can provide us with valuable information to perform. our investment, this facilitates our analysis and that is why for me it is a graph of vital importance, and as I mentioned earlier it has been very helpful to me, I thank our teacher @reminiscence , and teacher @dilchamo.