Trading Steem With the Wyckoff Method
This is my homework post for Steemit Crypto Academy Season 20 Week 1 assignment, Trading Steem with the Wyckoff Method.
Note :
- I am not a professional trader. What I have written in this article is theoretical, based on various sources I have read on the internet. By participating in assignments at Steemit Crypto Academy, I feel that I have gained a lot of theoretical knowledge in understanding the asset market (especially crypto) and also topics related to blockchain. Thank you for this opportunity.
- I performed this task on Windows 10 PC, Google Chrome.
Wyckoff Method: A Brief History of Its Inventor
Before we get into the meat of the post which is a Steemit Crypto Academy Season 20 Week 1 assignment, I will note a little about the Wyckoff Method.
The Wyckoff Method is named after the person who has formulated this trading method, his full name is Richard Demille Wyckoff, he was born on November 2, 1873 and died in Sacramento, California, United States on March 7, 1934. He has been known as a stock market investor. He also founded Magazine of Wall Street in 1907 (at one time, it was so popular that it reached 200,000 subscribers) and was editor of the magazine he founded, in addition to being editor of Stock Market Technique magazine.
Wyckoff started his professional career from the bottom, from the age of 15 when he took a job at a brokerage in New York as a stock runner. And by his 20s he was leading his own company.
For all his achievements in the world of stock trading, Wyckoff is known as one of the 5 titans of technical analysis, along with Charles Henry Dow (co-founder of Dow Jones, 1851 - 1902), William Delbert Gann (technical analyst, 1878 - 1955), Ralph Nelson Elliott (accountant, technical analyst, 1871 - 1948), and Charles E. Merrill (co-founder of Merrill, formerly known as Merrill Lynch, 1885 - 1956).
Now, let’s dive in to the tasks given.
Task 1 - The Three Fundamental Laws of the Wyckoff Method Describe the three fundamental laws of the Wyckoff Method: the Law of Supply and Demand, the Law of Cause and Effect, and the Law of Effort vs. Result. Explain how each law can help predict the price movements of the Steem token within the cryptocurrency market.
The Wyckoff Method, like many other theories and methods of technical analysis, is built on the premise of understanding the market (analyzing and understanding price movements in trading) so that traders can take maximum advantage or (which sometimes also means “cutting losses to the lowest point”) of market conditions. In achieving this goal, the uniqueness of the Wyckoff Method includes the application of three postulates known as The Three Fundamental Laws. These laws are the Law of Supply and Demand, the Law of Cause and Effect, and the Law of Effort vs. Result.
- The Law of Supply and Demand
This law is actually the most basic law of trade, which explains the relationship between the availability or supply of commodities (goods, services, stocks, etc.) and the amount of demand. This most basic law of trade states that when demand is more than supply, prices will rise, and vice versa. I have simplified this statement into a table for a more convenient observation of the ideas. Take a look at this unbelieveable image:
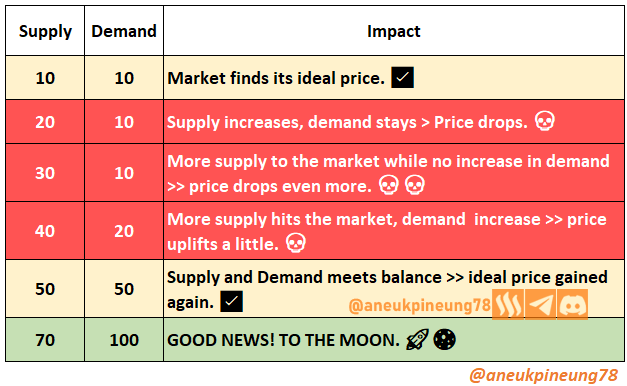
I made the picture with references from the internet.
This law can be used in predicting STEEM price movements by looking at the trading volume of STEEM, because this indicator shows the relationship and balance that is being formed between supply and demand. Here are some things to note about trading Volume (particularly of STEEM’s):- High volume of STEEM without a price increase indicates that supply is higher than demand, the price of STEEM may drop soon.
- An increase in STEEM’s trading volume accompanied by an increase in its price indicates that there is an increase in demand of STEEM, the price may soon rise, as it is characterized by increased demand.
- The Law of Cause and Effect
The premise of this law is that there is a cause for everything that happens, and everything that happens will also cause a certain effect. In the Wyckoff Method, accumulation and distribution are two causes, and both conditions will produce breakouts as an effect. Take a look at this table. I love tables, it helps a lot in understanding information.
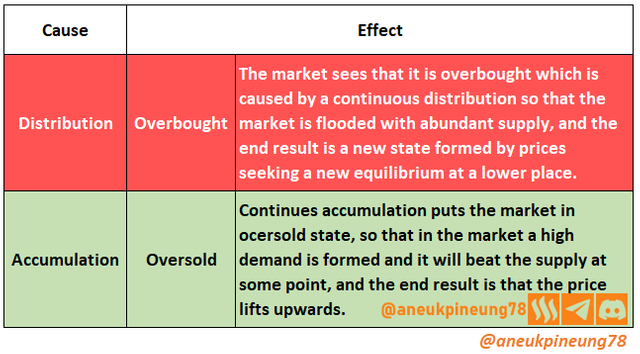
Continuous accumulation (as the cause) will result in a breakout (oversold) that will make the price have a climbing rally (as the effect). While Distribution is the cause of the price decline following the formation of overbought state. The Law of Cause and Effect in the Wyckoff Method can be explained with a graph like the following.
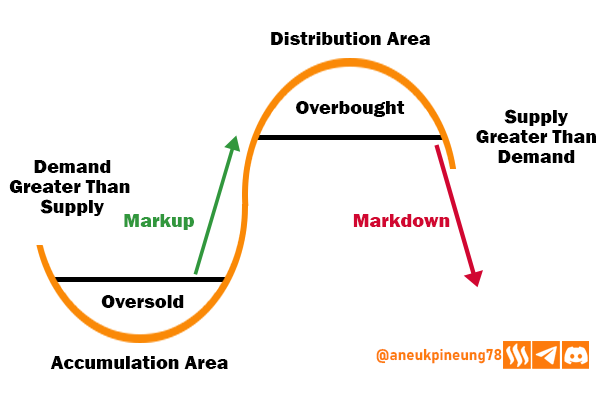
I made the picture with references from the internet.
In trading, this law can be used to predict the price of STEEM by showing the accumulation or distribution phase. In the distribution phase, the price moves sideways in the high price range as a cause which in time will result in a breakout that will make the price plummet, and vice versa with the accumulation phase as a cause in the future price increase.
- The Law of Effort Vs Result
There is an expression that states the high relevance between effort and results, meaning that the higher the effort given, the closer the ideal result desired. In trading, results are likened to price changes, while effort is trading volume. When price and volume are not comparable, traders may suspect that the trend is about to change.
As mentioned, effort is volume and result is price movement. Holding to the premise that the movement of the result should also be proportional to the movement of the effort, meaning that if in an effort worth 5, the movement of the result is 1, then an effort of 10 should at least get a result worth 2.
Using the analogy above (5 efforts are proportional to 1 result), if with an increase in effort (e.g. 20), the results are not comparable, and even tend to move sideways (between 4 and 5, for example), then it is suspicious that the trend is forming a reversal. Traders should be aware that there is a big battle going on between supply and demand, which is likely to be won by supply. If with increasing effort to 20, the result is 7, then congratulations! You might have hit the jackpot, and an uptrend should be waiting for you. Let's turn the analogy into a simple table as shown below, which will give a more observable picture.
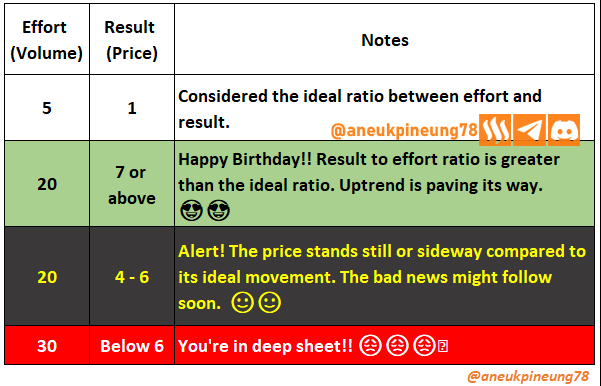
Note: the ideal ratio mentioned in the picture is just an example or figure of speech, there is no standardized measure other than what appears in the market, and it is very likely to change at different times according to market dynamics.
To utilize it in predicting STEEM price movements, the Law of Effort Vs Result works similar to the first law of The Law of Supply and Demand, by looking at the relationship between trading volume and price. When the increase in STEEM price does not show a trend as high as the increase in trading volume or tends to stagnate, it is worth watching out that the trend will soon turn downward.

Task 2 - Cause and Effect in the Wyckoff Method Explain how the Wyckoff Method uses the principle of cause and effect to anticipate price actions. Provide an example of how 'cause' can be quantified (such as accumulation/distribution) and how 'effect' can be expected, using Steem’s historical price data to illustrate your point.
The Law of Cause and Effect in the Wyckoff Method, like any other analytical tool in trading, is used to anticipate what the market may bring. Anticipating price movements in the Wyckoff Method using the cause and effect principle is done by identifying and measuring causes to predict effects. The cause identified is the consolidation phase, i.e. accumulation or distribution. The duration and size of the consolidation phase is said to provide a prediction of the distance of price movement that may occur after the phase has passed. That is, the longer the duration and size of the accumulation phase, the more likely it is that the market will witness an upward price movement of greater duration and size.
For Example, Let's take a look at the following image which is a historical price chart of STEEMUSDT on the Binance Spot market at 15-minute price intervals as seen on Tradingview.
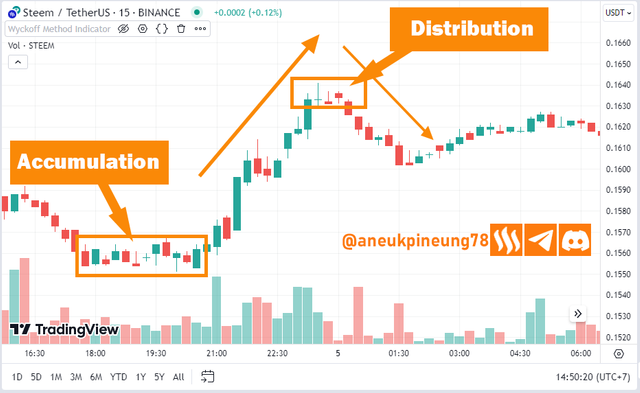
The image above shows us the onset of an uptrend (effect) after an accumulation (cause) that was confirmed by an increase in volume and price. The image also shows the occurrence of a downtrend (effect) following distribution (cause) which was confirmed by a decrease in volume and price.

Task 3 - The Law of Effort vs. Result Explain how the Law of Effort vs. Result can be observed in the trading volume and price movements of the Steem token. Use a real chart example where this law was evident in the Steem market, and discuss what insights a trader can derive from this analysis.
The Law of Effort Vs Result in the Wyckoff Method is indeed related to trading volume, this indicator is observed as effort to anticipate the result. The illustration is: the market is bombarded with effort (volume) to achieve a desired result (price movement). Therefore, placing it into STEEM token trading naturally requires observation of the STEEM trading volume and the price achieved. Let's take a look at the historical STEEM price chart on Binance Spot on 15-minute trades as seen in TradingView below to understand this.
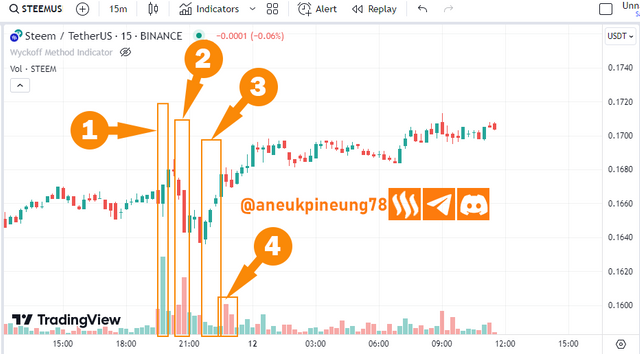
In the picture, I have marked 4 pints to be the focus of discussion.
- Pointer (1) shows that after an uptrend rally of several bars with stagnant volume, there was a significant increase in volume, but unfortunately this did not necessarily lift the STEEM price to the ideal ratio, what happened was a massive increase in volume (effort) but the price only increased slightly, this was a bad signal which was then evident in the next 3 bars when the price began its downward rally (result).
- Pointer (2) shows that great effort was again exerted through volume but has not been able to reverse the price trend upwards, meaning that the price has the potential to continue to fall.
- Pointer (3) shows that with a smaller set of efforts (3 bars) it was able to make the price direction reverse and start an upward rally. This can be understood as the effectiveness of support on the STEEM chart at that time.
- Pointer (4) shows the increase in effort on two bars, although both are red (the closing price is lower than the opening) but continue to help the STEEM price move upwards. So here it can be seen that the color of the bar (closing and opening price) has no absolute influence on the price.

Task 4 - Key Phases of the Wyckoff Method Discuss the key phases of the Wyckoff Method: accumulation, markup, distribution, and markdown. Provide historical price actions of the Steem token as examples of each phase and explain how a trader can identify the current phase of the market.
Let's look at this image again as a reference for the discussion on this topic.

- Accumulation
Accumulation occurs at low prices, usually following a downward trend. At this time the price does not show a volatile state and tends to move sideways. At this time large forces (money) enter the market by making purchases at regular intervals and in regulated amounts so as not to create sudden price volatility. This is done with the intention that purchases can continue to be made. - Markup
Markup occurs following the end of the accumulation phase. The markup is preceded by a breakout which is indicated by the onset of significant price movement. A breakout signals the beginning of a markup (uptrend). In the markup phase, a bullish trend occurs because the market realizes a significant loss of supply due to continuous buying in the accumulation phase. Although small corrections still occur, the chart generally shows an upward movement pattern. - Distribution
Following the markup phase, the price will settle at a certain point where large investors can take advantage. In the distribution phase, they will release the asset slowly, bit by bit, in order to continue to keep the price high so that they have the opportunity to gain more profit than with a massive sale in a short period of time. - Markdown
At some point, following distribution, the market realizes it has been flooded with supply again, a correction (breakout) occurs and is followed by a Markdown, which is a bearish phase that witnesses massive selling that causes prices to continue to fall.
Let's now observe this historical STEEM price chart on the Binance SPot market as captured on TradingView below.
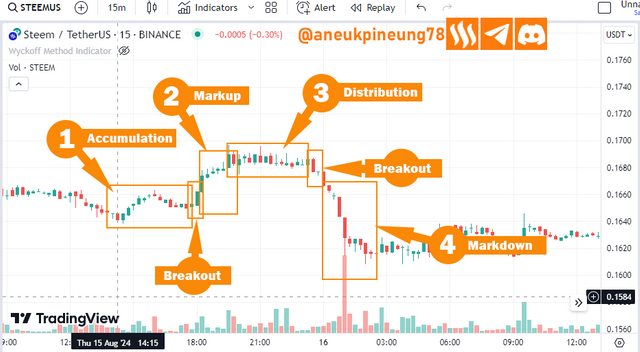
- Pointer (1) shows the accumulation after a long downtrend. The interesting thing about the accumulation phase that I marked in the image above is that there was a rush to buy by some traders that corrected the price quite significantly, but it stopped after 6 bars, and the accumulation continued.
- Pointer (2) shows that the market is about to enter the Markup phase (price increase as supply is drastically reduced due to massive accumulation).
- Pointer (3) shows the distribution phase, which is reached after the peak price is reached due to the previous massive accumulation. At this price, traders start to take profits, making small sales so that the price moves sideways and does not cause the price to fall suddenly.
- Pointer (4) shows us that at some point, due to continuous distribution, the market will be flooded with supply again, and this is signaled by a breakout that turns the price from sideways to downtrend.

Task 5 - Applying the Wyckoff Method Outline the step-by-step process for applying the Wyckoff Method in trading the Steem token. Discuss how to identify the accumulation phase, signs of supply/demand tests, and the transition to a markup phase. Use a real example of the Steem token to illustrate entry and exit points based on the Wyckoff Method.
Applying the Wyckoff Method in Trading the STEEM Token
To use the Wyckoff Method in STEEM token trading, it is required of traders to put the principles of the three laws into practice, namely by:
- The Law of Cause and Effects: pay attention to the market phase (accumulation or distribution) of STEEM tokens and the price movement phase of STEEM tokens (markup or markdown) as a result. By understanding the accumulation or distribution phase of STEEM tokens, a trader can determine when it is best to enter or leave the market, after being convinced of a breakout.
- The Law of Effort Vs Result: pay attention to the trading volume of STEEM and the resulting price. If you understand the relationship between volume and price, it will be easier for traders to take a stand. The movement of the result (STEEM price) must have a correlation that is at least proportional to the movement of the effort (volume), if the movement of the result is not proportional to the movement of the effort, then it should be aware that the market is not friendly.
- The Law of Supply and Demand: (similar to the Law of Effort and Result) pays attention to the comparison between supply and demand which can be seen through the amount of trading volume and prices that arise. An increasing trading volume with prices that do not show a similar increase in passion indicates that supply is more than demand.
The application of these three laws in STEEM token trading can give traders a good overview of the STEEM token market so that they can potentially get the maximum profit from the trades they make. But it is still highly recommended to combine the conclusions obtained with other analytical tools both fundamental and technical analysis tools.
How to Identify the Accumulation Phase
Since accumulation occurs after a significant downtend phase, to identify the accumulation phase, it is necessary to note the end of a significant downtrend (in terms of time span and/or distance). In an accumulation phase, prices move in the same direction with very little correction. See the following chart.
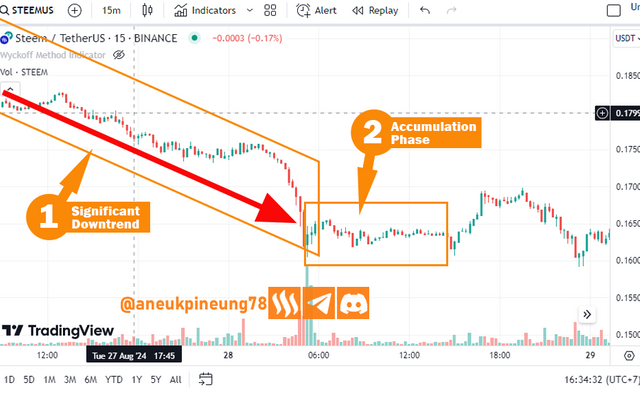
How to Identify the Signs of Supply/Demand Tests
- Supply Test
The Supply Test appears in the distribution phase which is when the uptrend starts to weaken. When the uptrend weakens, the market corrects the price slightly to see if there will be a lot of selling, if not much supply appears then the uptrend can still continue, and if instead a lot of selling appears then the uptrend is likely to change direction soon. The image below shows that the SUpply Test failed to invite much selling so the uptrend continued.
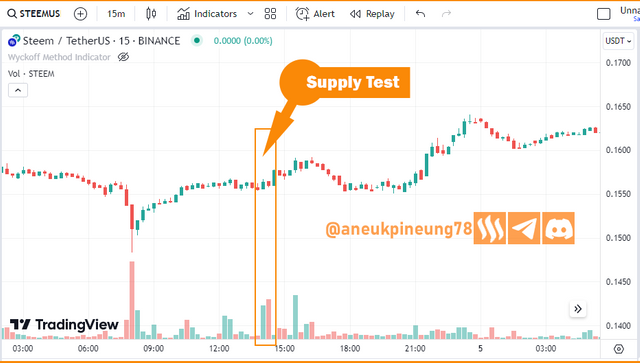
Binance STEEM/USDT 15-minutes Spot Market as seen on TradingView. - Demand Test
In contrast to the Supply Test, the Demand Test occurs in the accumulation phase at the end of a downtrend. When the downtrend seems to be weakening and seems to be reaching its end, there will be a slight upward price correction to test whether there will be a lot of buying. If there is a lot of buying then the trend may change direction, otherwise the downtrend may still continue. The image below shows 3 Demand Tests occurring in the accumulation phase, the first two failed to change the direction of price movement significantly, but the third test made a lot of demand appear in the market so the price showed an increase.
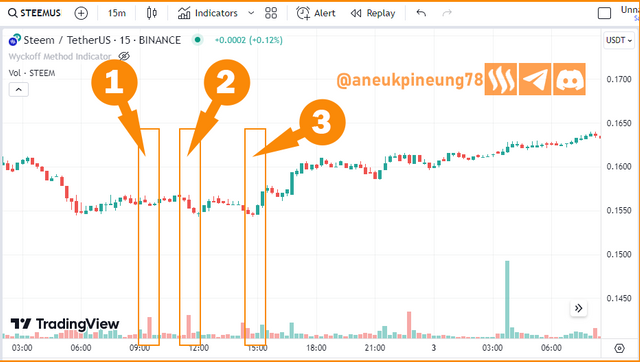
Binance STEEM/USDT 15-minutes Spot Market as seen on TradingView.
How to Identify the Transition to A Markup Phase
The markup phase is the period where the price starts to move up after the accumulation phase. This will usually be the starting point of a bullish trend. The change or transition from the accumulation phase to the markup can be identified by the appearance of a breakout, which is when the price breaks the resistance level after moving sideways in a narrow price range. Look at the below picture.
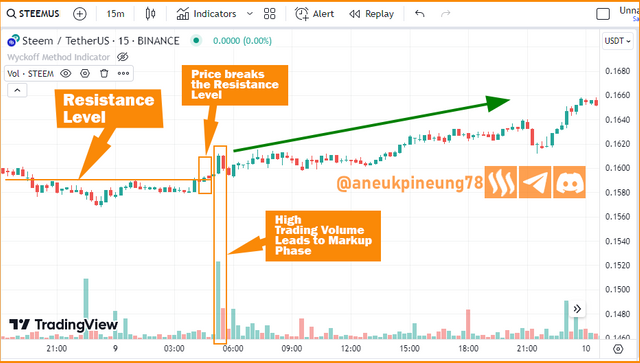
Example Illustration of Entry and Exit Points of the STEEM Token Based on the Wyckoff Method
- Entry Point
Let’s take alook at this image below.
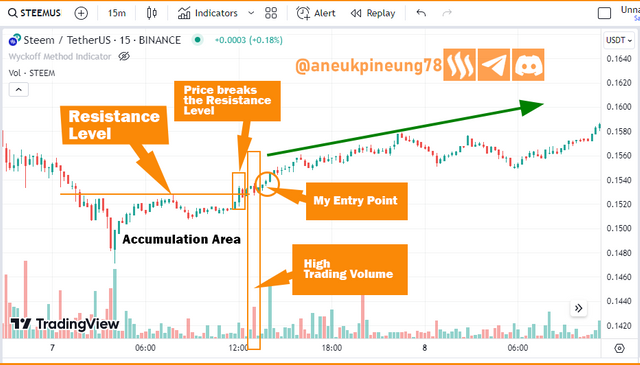
Binance STEEM/USDT 15-minutes Spot Market as seen on TradingView.
During the accumulation phase I will pay attention to the Demand Test that appears. and from the pattern that occurs I will observe the resistance level that is formed. Then I will wait for the next Demand Test that is able to break the Resistance Level, this is the initial signal of a possible markup. Then I need to confirm whether or not there is a large volume, when there is a large volume (effort) with a matching price change (result), then this is the second signal I receive, I think it is safe enough to determine the entry point on the next two or three bars if it is proven that the bars are moving with a positive trend. - Exit Point
Let's take a look at the following image.
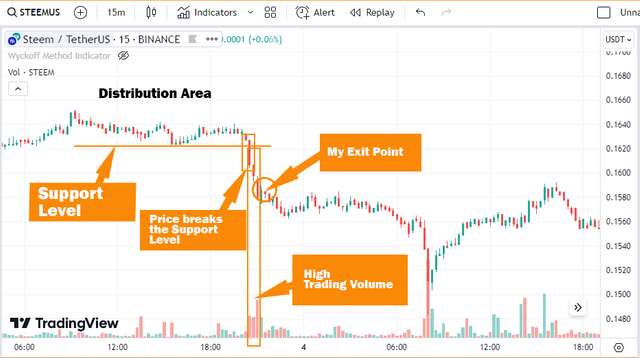
Binance STEEM/USDT 15-minutes Spot Market as seen on TradingView.
To determine the Exit Point, I will pay attention to the Support Level arising from the Supply Test that occurred in the Distribution Phase. When the price breaks the support level, then I have got the initial signal to exit the market. If large volume then appears and the price continues to decline then it can be said with great confidence that the markdown phase has occurred and the market is already in a bearish condition. This is my exit point.

Thanks
Thanks @crypto-academy for the lesson.
Pictures Sources
- The editorial picture was created by me.
- Unless otherwise stated, all another pictures were screenshoots and were edited with Adobe Photoshop 2021.
Sources and Reading Suggestion
- https://www.investopedia.com/articles/active-trading/070715/making-money-wyckoff-way.asp
- https://www.wyckoffanalytics.com/wyckoff-method/
- https://en.wikipedia.org/wiki/Richard_Wyckoff
- https://en.wikipedia.org/wiki/Charles_Dow
- https://en.wikipedia.org/wiki/William_Delbert_Gann
- https://en.wikipedia.org/wiki/Ralph_Nelson_Elliott
- https://en.wikipedia.org/wiki/Charles_E._Merrill
- https://citytradersimperium.com/wyckoff-theory-forex/
- https://www.tradersmastermind.com/wyckoff-method/
- https://tradethepool.com/wyckoff-method/
- https://medium.com/@omarimakonga9/price-action-analysis-using-the-wyckoff-trading-method-c00e777b650b
- https://realtrading.com/trading-blog/wyckoff-method/
- https://fxopen.com/blog/en/the-wyckoff-trading-method/
- https://www.earn2trade.com/blog/wyckoff-method/
- https://fx2funding.com/blog/wyckoff-trading-method-explained-step-by-step-guide/
- https://www.marketcalls.in/price-action/introduction-to-wyckoff-trading-cycle-wyckoffmethod-and-three-laws-of-wyckoff.html
- https://steemit.com/hive-175254/@chimzycash/the-wyckoff-s-composite-man-method-the-fundamental-laws
- https://wyckoffsmi.com/two-goals-three-laws-and-five-steps/
- https://medium.datadriveninvestor.com/94b4934f6fb8
- https://academy.binance.com/en/glossary/wyckoff
- https://www.techopedia.com/definition/wyckoff-method
- https://tradingcenter.org/index.php/learn/technical-analysis/329-wyckoff-method


This message explains the Wyckoff method which focuses on the cause and effect of everything. In the Wyckoff method, "convergence" and "dispersion" are the two main causes, and both conditions produce breakouts. This means that a sustained rally (cause) leads to a breakout (oversold), which drives the price up, while a split causes the price to fall.
In trading, this law can be used to predict the price of STEEM, where a split condition lowers the price and a consolidation increases the price.
Also important is the law of "effort versus results," which states that the more effort one puts in, the better results can be expected.
best of luck
My friend, you also wrote an excellent entry on this topic. Did you find it was hard when you were doing it? I needed 4 day to complete.
https://x.com/aneukpineung78/status/1835180641513877976
I appreciate the detailed explanation of both the setup and countdown phases as it makes the concept easier to understand for traders who are still learning. You've highlighted the importance of patience and following clear signals before entering a trade which is crucial for success. I wish you the best of luck in the contest.
If both of us wish the same for each other, and the both wishes should be granted, what would be? Interesting. Did you see @stream4u somewhere?
Its will be good...no i didn't see him
The week is about to over I dont see him ..
On the way.
Good to know,,, but the sands of time are almost out ... Hurry up my bro.
80% is already done. Daily completing at least one question. 20% will complete in next few hours.
all right ... good to hear ...
Really needed time for this work, 1 question daily is a good idea.
Ah that's the strategy. So you agree that tis was hard? I thought I was the only one. 😅😅😅
Yes, it was hard, my bro @stream4u. And the Academy doesn't seem to make it any easier for the students. Hahaha. DOn't you feel that it gets harder every week? What do you think, @mostofajaman, @rafk, @amjadsharif?
To be honest nothing in performance is easy now competition has increased everywhere. Moreover, the platform now focuses on practical content. All the topics are not too difficult if you understand them and apply them too.😄
Yes, you are right. It won't be difficult if you understand them. And it is also right to put the laughing emoticon after that sentence. 😂😂😂
Anyway, we have fun in the first week of season 20, don't we, Bro?
My Bro @stream4u.. I feel the touch.. How have you been doing. Man?
Hai abangda @aneukpineung78, saya memang tidak begitu mengerti tentang trading, tetapi penjelasan yang abangda berikan itu betul-betul mendetail banget, sehingga yang belum paham juga bakal dikit-dikit jadi paham. Paling menariknya, daftar pustaka itu pun lengkap banget, kayaknya seharian duduk baru habis membacanya.
Senang dengan tulis yang sangat panjang ini, tetap semangat berbagi, Semoga keberuntungan berpihak kepadamu bang.
Untuk gertak aja tuh.. Malas jugag kita panggil2 orang sebenarnya untuk komen-komen karena kalau ada mana ada, tapi ya ngga ada mau gimana ada. Mumang awaknyo dipakek gugel ,, gugel2 mumang. suwah lakee jus pineung bak pak @muzack1.
Perkara ngerti adalah perkara tingkatan pengetahuan. Tahu, paham, ngerti, beda-beda levelnya. KAlau saya cuma tahu teori itupun dari baca-baca. Beda dengan aabang kita @el-nailul beliau ngerti pada tataran praktis tetapi tidak "mau" menulis, Jadi yang saya tulis ini murni hanya pemahaman saya dari membaca-baca saja, tidak karena praktek. Seperti saya jelaskan dalam tulisan bahwa saya bukanlah trader profesional, bukan pula frequent.
Oh itu daftar pustaka yang panjang, memang menarik bagaimana saat ini internet telah menjadi gudang pengetahuan sekaligus tempat sampah raksasa, tinggal kecenderungan setiap pengguna untuk mencari apa.
Saya melihat Bang @walictd ada mengikuti SEC Season 20 Minggu 1 ini juga. Saya baca itu yang tulisan tentagn Spreadsheet. Apakah selain Excel pernah bang wakictd mencoba spreadsheet lain misal dari WPS Office dan sebagainya?
Heheh itu udah ada bang, kalau gak mana ada bisa lon komen ada. Soal pak El nailul sebenarnya bukan gak mau nulis, tapi taulah beliau itu kekmana kesibukannya, kalau gak ada mana mau ngalah sama abang.
Pak @muzack1 memang harus sering-sering minum jus Pineung Boh Manok Kupi bang, agar lebih gairah dan bersemangat ala anak remaja jaman Now.
Adapun tentang spreadsheet saya hanya sering menggunakan Excel tapi kalau buka di hp sering pakek WPS Office karena lebih ringan. spreadsheet online juga sering saya pakek yang disediakan oleh mbah Google.
Saya ga pernah pakek spreasdheet di hape karena kekecilan layarnya,,, bahkan kadang2 layar laptop pun terasa kekecilan sudah ,,,, zoomnya musti kenceng biar nyaman,,, kalao di hape,, waduhhh ,, kegedean jari dibandingkan sama sell sepredsit,, mana jari juga jempol semua ya kan ..
Dulu pernah sekali waktu pake yang WPS di laptop tapi kayanya ngga betah, mendingan MSE. Ni mau coba yang opensource itu,, LibreOffice Calc ,,, mau lihat sensasinya gimana.
Saya pakek WSP itu untuk kebutuhan mendadak juga bg, kalau gak ada mana ada. Misalnya kebutuhan tugas kuliah, sementara laptop gak bawa, jadi terpaksa harus pakek HP.
Soal spreadsheet lain memang gak pernah coba, jadi gatau gimananya itunya. Coba aja yang siapa tau betah dengan spreadsheet itu.
Ah iya jugag tuh solusi saat kepepet,, memang betul tu, istilahnya kalau peribahasa ga ada rotan akarpun laku.
Iya ni kalau jago coding-coding asik juga pake yang opensource bisa utak atik kan. Kalo ga salah itu @nurulridhaa apa @ninaa04 itu yang belajr koding-koding gitu ...
Patut dicoba ni sama mereka, jangan sampai ketinggalan. Hitung-hitung sambil belajar, Steem Power Pun bertambah.
nah itu dia ibarat katqa pepatah juga kan sambil nyelam joged-joged .. Asik banget dong,,,
Widiiih bakalan asik nih sepertinya😁
Bangeet. 😃
@murulridhaa,, kenapa kamu mendownvote komentar ini? Kamu tersinggung? 😅😅
But in my opinion, apart from the three laws above, in crypto we also have to pay attention to the price of bitcoin which greatly influences other altcoins.
So many things to put to consider in trading, including in crypto trading. Well, in crypto trading, it is undoubtable what you said, Chief. It is saFe to say that Bitcoin price movement influences any other coin's price movement. And it is furious to see at the continuously reddish market (downtrend phase).
Do you trade, Chief? In a regular basis?
I just trade, bro, buy when prices are low and sell when prices are high
My dear friend has presented all the explanations very nicely starting from the formula Wyckoff method in fact your price prediction is really excellent for many important traders. The Wyckoff Method is one of the methods of analyzing the stock prices and was developed by Richard Demille Wyckoff, a famous technical analyst. It is based on the planning and examination of the market forces which include demand and supply as a means of determining price fluctuations. In order to use for trading Steem, there are the four phases which should be considered: accumulation, markup, distribution, markdown. Thank you so much for sharing.