Crypto Academy Season 3 Week 8 Homework Post for (@asaj) Crypto Assets and the Random Index (KDJ)
Greeting to All,
This is my homework post for week 8 of Season 3 , I am really thankful to Professor @asaj for this amazing lecture.

1- In your own words define the random index and explain how it is calculated
Definition of Random Index:
KDJ is a technical indicator tool that is used to analyze changes in the market trend and price patterns in traded assets. It is also known as Random Index. It can be commonly used to predict the market analysis in short-term assets.
KDJ is a derivative form of stochastic oscillator. The only difference is that there is an additional line called J line. The values on the% K and %D lines indicate whether the security is overbought above 80% or oversold below 20%. The moment when %K crosses %D is the moment of Sell or Buy. The line J represents the deviation of the value from %K to %D lines. For the %K and %D lines on the chart, the value of %J line can exceed 0, 100.
KDJ indicator has a lot of optional parameters:
- K line value period.
- Moving average type of %K value indicator.
- Smoothing the period of %K value.
- Moving average type of %D value indicator.
- Period of %D value.
- The multiplier of %K and %D values used for %J value calculation.
- Series type of %K, %D, and %J lines values.
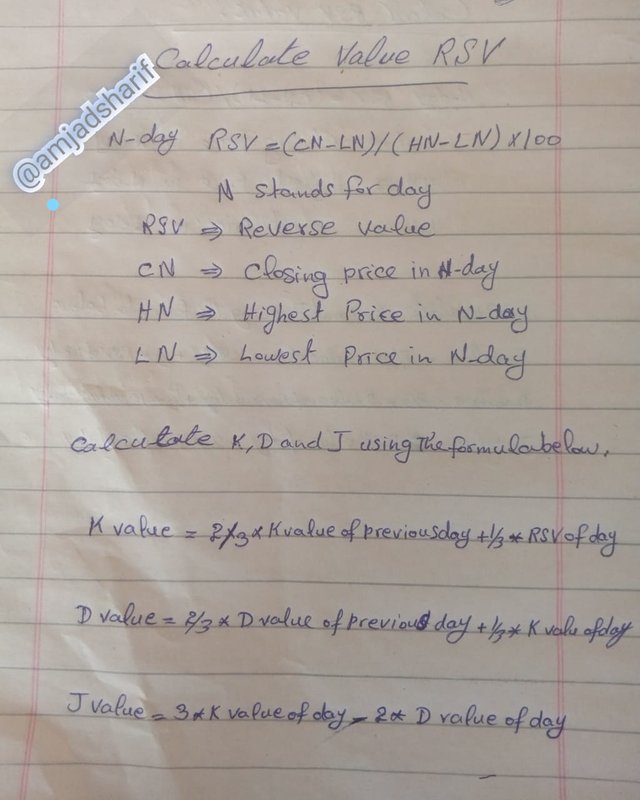
How Random Index is Calculated
The KDJ indicator consists of three main lines (K, D, and J) that is calculated based on the highest price, lowest price, and closing price. The obtained K value, D value, and J value index are formed at a point on the coordinate, respectively, and are thus associated with an infinite number of points.
2- Is the random index reliable? Explain
KDJ indicator does not provide 100% correct signals like other indicators. It also generates falses signals along with correct signals but this does not mean that this indicator is not reliable.
It depends on the trader's trading strategy and trading style and how he is using it. If other indicators are used along with KDJ, it will generate the correct signal.
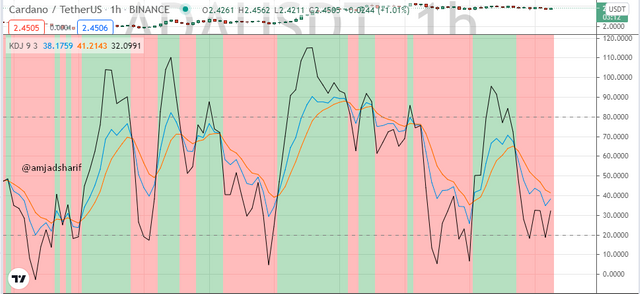
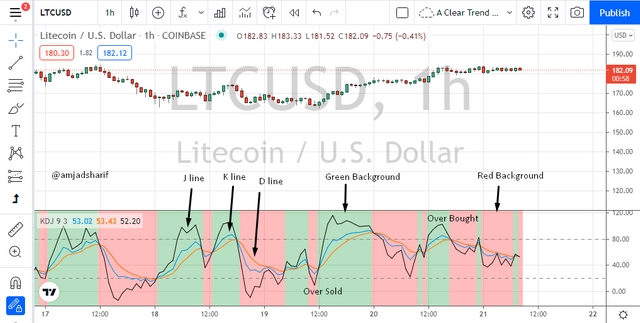
There are three lines K, D, J which indicate the trader about the points of both Selling and Buying of an asset. D and K lines also indicate about Divergence. Moreover, Green and Red background show uptrend and downtrend respectively.
It is similar in working with RSI, CCI and Stochastic that are considered very reliable indicators and same is with this indicator. It can also be considered reliable indicator due to its ability to generate very less false signals.
Cross of three lines along with background color combination, it makes the task easy for a trader to decide about the signals of both Buy and Sell of a certain asset.
Success ratio of an indicator is also a very big factor that is taken into consideration by the traders to be a reliable indicator. KDJ has also a good success ratio that is above 60% and it is quite good success ratio that makes this a reliable indicator.
3- How is the random index added to a chart and what are the recommended parameters? (Screenshot required)
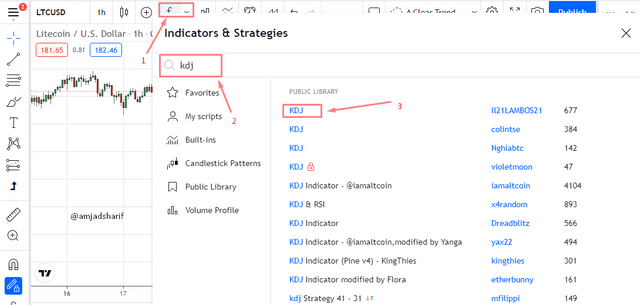
To add Random Index Indicator First we go to Trading view web site and click on the chat on the top left.

Follow these three steps seen blow in the image, 1- Click on fx (indicators&stretegies) 2- Type KDJ in search bar 3- Select KDJ indicator.
Now we have applied KDJ indicator on the Chart.
In the screenshot below can be seen KDJ line, it also can be seen Overbought and oversold area. When trend change, the background color turned one in to another.
KDJ Recommended Settings / Parameters:
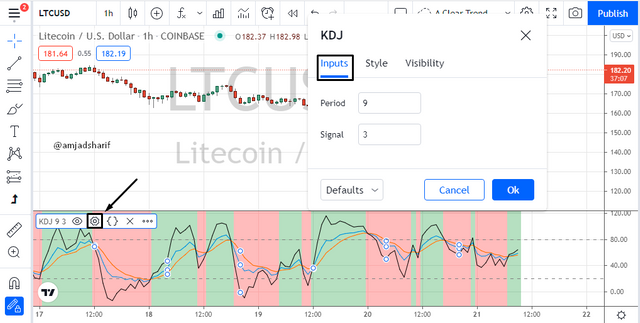
Click on the setting Black is indicating in the screenshot below. Then click on Input, you can see default setting period 9 and signal 3. This setting is default and it can be considered as a best.
By clicking on style, We can change the color of KDJ line as per our choice. we can also change the background color and Change the level for overbought or oversold , Defalut are 20% and 80%.
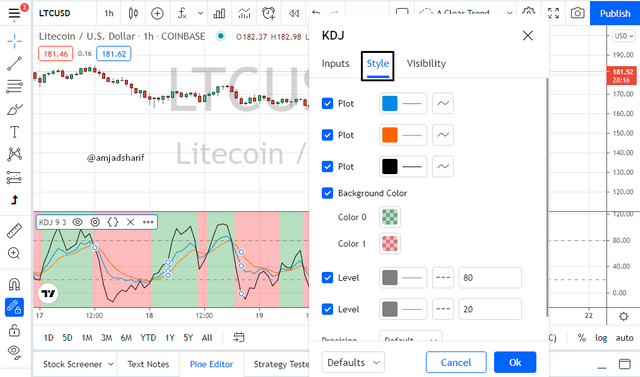
Clicking on visibility, we can see the time setting 1 second to 1 month.
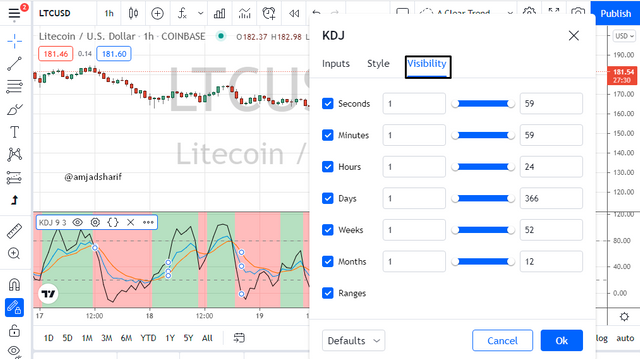
Traders should used the KDJ setting as per demand and related their strategy but my recommendation is to use the default setting that is best for short term trades.
- Period of 9
- Over bought Level 80%
- Oversold Level 20%
4- Differences between KDJ, ADX, and ATR
KDJ indicator is used to estimate the market trend whether the market value is overbought or oversold. It moves the K, D and J lines and the J line above and below the indicator level usually 80% and 20%. KDJ is a technical indicator tool that is used to analyze changes in the market trend and price patterns in traded assets. It is also known as Random Index. It can be commonly used to predict the market analysis in short-term assets.
ADX is a technical tool that can be use to determine the strength of market trend both in up and down trend. This may indicate whether it is time to buy, sell or hold this investment, hypothetically. Its range between 0 - 100 level.
The trend has strength when ADX is above 25 and the trend is weak or the price is trendless when ADX is below 20.
| ADX RANGE LEVEL | ABOUT TREND |
|---|---|
| 0 - 25 | Weak or No Trend |
| 25 -50 | Strong Trend |
| 50 -75 | Very Strong Trend |
| 75 -100 | Extremely Very Strong Trend |
ATR is a technical indicator that is used to calculate the market volatility of assets in a certain period of time. Average Real Range (ATR) is an indicator of market volatility used in technical analysis. This usually comes from a 14-day simple moving average of a series of real-range signals. ATR was originally designed for the commodities market, but has since been applied to all types of securities.
KDJ, ATR and ADX Applied on the chart below.
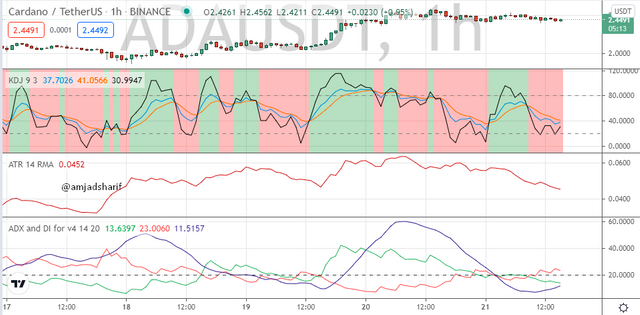
Key Differences between KDJ, ADX and ATR
| KDJ | ADX | ATR |
|---|---|---|
| KDJ uses 3 main lines K, D and J | It has Single line | It has Single line |
| It is used to identify overbought and oversold level | It is used to identify strength of trends | It is used toidentify asset market volatility |
| Important levels are (80% and 20%) | 25 - 100 for strong trend | Best range 10 - 14 |
| KDJ Is 9 period by default | 14 period by default | 14 period by default |
| It shows the direction of market | It shows strength of price direction | decrease and increase of asset prices |
| It works better in short term | It work better in mid term | It works better in mid term and long term |
5- Use the signals of the random index to buy and sell any two cryptocurrencies. (Screenshot required)
Now trade on some cryptocurrencies what we learned in this lecture, We will practically trade.
Buy BTC/USD Using KDJ Indicator:
In the example below, we can see the chart of BTCUSD. I found the signal KDJ in the level 20%. It was below this level that's mean It is oversold. Signal occurs when the J line crosses K and D lines upwards.
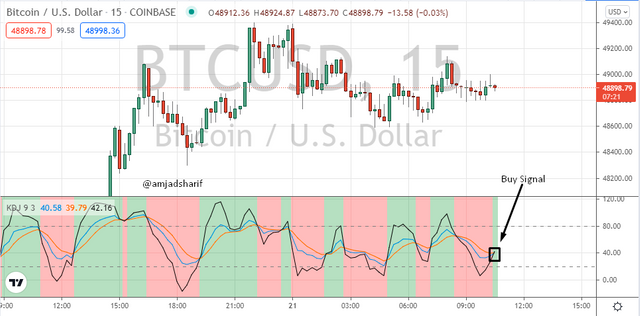
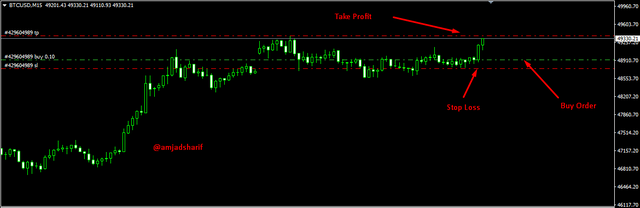
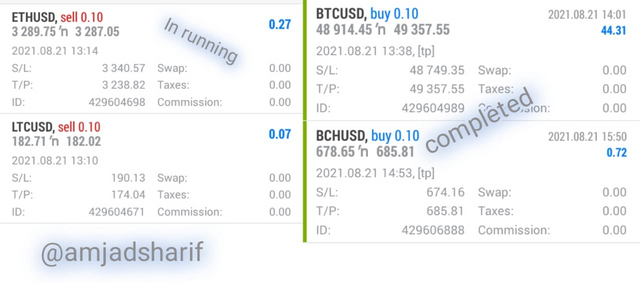
Now the time to be entered in the trade using KDJ strategy, I place a buy order at the price $48914 with Take Profit and Stop Loss.
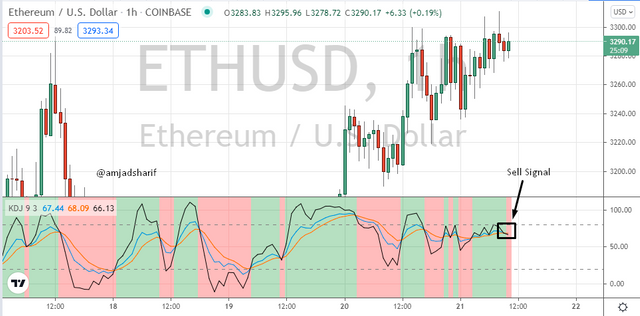
Sell ETH/USD Using KDJ Indicator:
This is a hourly chart of ETHUSD and we can see that signanal occurs, it can be seen clearly J line line is below K and D line and it showing the overbought area That's mean we can place our sell entry here as shown in the chart below.
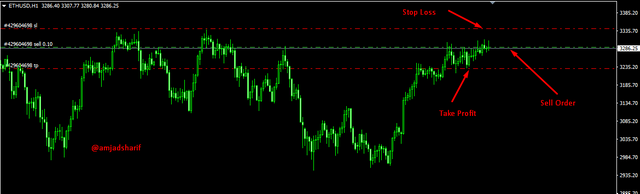
In above screen show I have placed the sell order according to the KDJ strategy.
Some other example of screenshot I will be showing below:
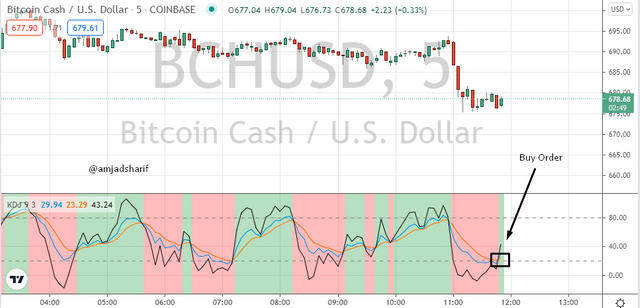
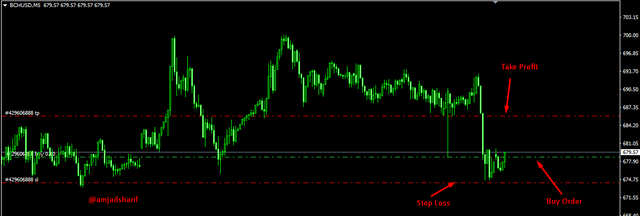
Buy BCH/USD Using KDJ:
Sell LTC/USD Using KDJ:
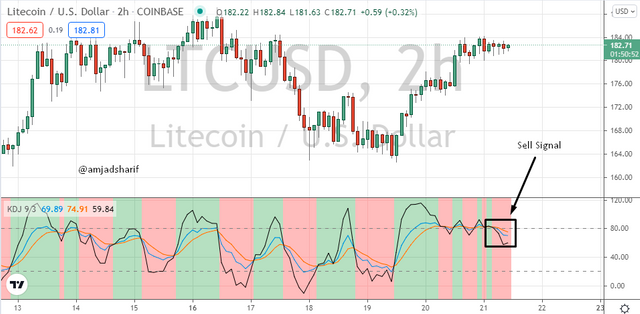
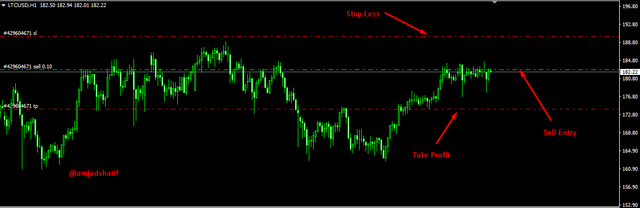
The screenshot below running and completed order that I placed using KDJ indicator.
CONCLUSION:
This is a wonderful lecture from our beloved professor, who present the lecture in easy way to understand about the KDJ indicator Thank you. I will wait for next lecture on another informative topic.
Hi @amjadsharif, thanks for performing the above task in the eighth week of Steemit Crypto Academy Season 3. The time and effort put into this work is appreciated. Hence, you have scored 5 out of 10. Here are the details:
Remarks
Overall, you have displayed a good understanding of the topic. You have performed the assigned task. However, you did not provide new information to this course, as most of the points mentioned have been indicated by several participants.
I have answered as per questions that I understood and completed all the topics clearly. But respected you have not give score as I deserved in this assignment. Thanks