Assignment Crypto Academy Season 03 - Week 08 | Advanced Course - Trading Sharkfin Pattern[@cryptokraze]
This is my submission for the Assignment provided by Professor @
cryptokraze . The lecture was based on Sharkfin Pattern or V Shape Pattern and this is an important pattern that is very famous in Crypto trading.
1 - What is your understanding of Sharkfin Patterns. Give Examples (Clear Charts Needed)
If you are a trader then you might notice that sometimes the Market moves very fast then reverse back quickly and creates a V Shape, this concept is known as Sharkfin. This is one of the very powerful pattern that can help you to get a good scalp trade and I personally use this to Scalp in Futures/Spot to get quick bite. It will be in V Shape in case of downtrend shift and Inverted V shape incase of uptrend uptrend market as you can see in the pictures.
Downtrend Shift- You can see how the price went down quickly the recovered.
.png)
Uptrend Shift- You can see how the price goes up then came back.
.png)
Logic Behind Sharkfin Pattern
This shape mostly found whenever there is any news in the market that pushes the price towards either upside or downside. This is very common in the Crypto market and such activity also performed by big players like Exchanges to trigger your Stop Losses because market always look for liquidity. This is how exactly how big players makes big money and trap retailers.
But after attending the lecture this is going to be a opportunity for us to get quick bite and join the Big players party. I would love to trade such pattern and you can implement it either in Spot or futures both.
This is the V shape formed when Tesla Announces that they will stop accepting Payment through BTC to buy Tesla. I still remember that day because I had so many long position and made huge loss sadly.
.png)

2 - Implement RSI indicator to spot sharkfin patterns. (Clear Charts Needed)
RSI is a momentum indicator that helps us to trade Sharkfin pattern as it tells us the magnitude of recent price changes. We will be using the default setting to trade Sharkfin pattern where the period will be 14 and the Uper & Lower band would be 70-30. The value of RSI ranges between 0-100.
If the value of the RSI is above 70 then it is considered as Over bought zone and if the value is below 30 then it is considered as Over Sold zone. Let's setup RSI on the chart then spot some Sharkfin Patterns. Whenever the V shape will be there you will notice that the value of RSI will be below 30 and above 70 in case of Inverted V shape.
Step-1: Open naked chart and click on Indicators.
Step-2: Type RSI (Relative Strength Index)
Step-3: Click on First result Built in one.
.png)
Step-4: Now you can see RSI plotted on your chart.
.png)
Let's go ahead and spot Sharkfin Pattern
As you can see in the chart a V shape is formed and at the same time you can see the RSI is in Oversold zone that is the opportunity we need to grab to get quick bite.

Here you can see Inverted V Shape and at the same time RSI is in Over bought zone which means it may take reversal now.


3 - Write the trade entry and exit criteria to trade sharkfin pattern (Clear Charts Needed)
We will always take entry whenever we will get clear confirmation and RSi is going to be very helpful here. Suppose when the price dumped at that time the value RSI is 22 and when it starts going up probably above 30 you can take entry and can easily target for 1:1 Risk reward ratio. Your Stoploss is going to be below the V Shape low.
In case of Inverted V shape we will see the value of RSI is in over bought zone let's suppose the value is 81 and when it starts going down probably below 70 then you can take the entry for the target of 1:1. Your stoploss is going to be above the V shape high.
Patience plays a very importance role here and we need to wait for the confirmation otherwise we will be ended with having Stoploss.
Let me explain you both scenario with the pictures.
Buy Setup-:
You can see we have entered when the price started showing reversal and at the same time the value of RSI is going above 30. We have entered and exited at 1:1.
.png)
Sell Setup-:
We can see the value of RSI is 84 at the time of V shape formation. We have entered in the trade when it is decreasing and moving towards 70 and target will be 1:1.
.png)
Here you can see other examples as well-
.png)
.png)

4 - Place at least 2 trades based on sharkfin pattern strategy (Need to actually place trades in demo account along with Clear Charts)
I am sorry Professor, I need to take trade with my Phone as last night my laptop's HDD got crashed and now it is on the store.
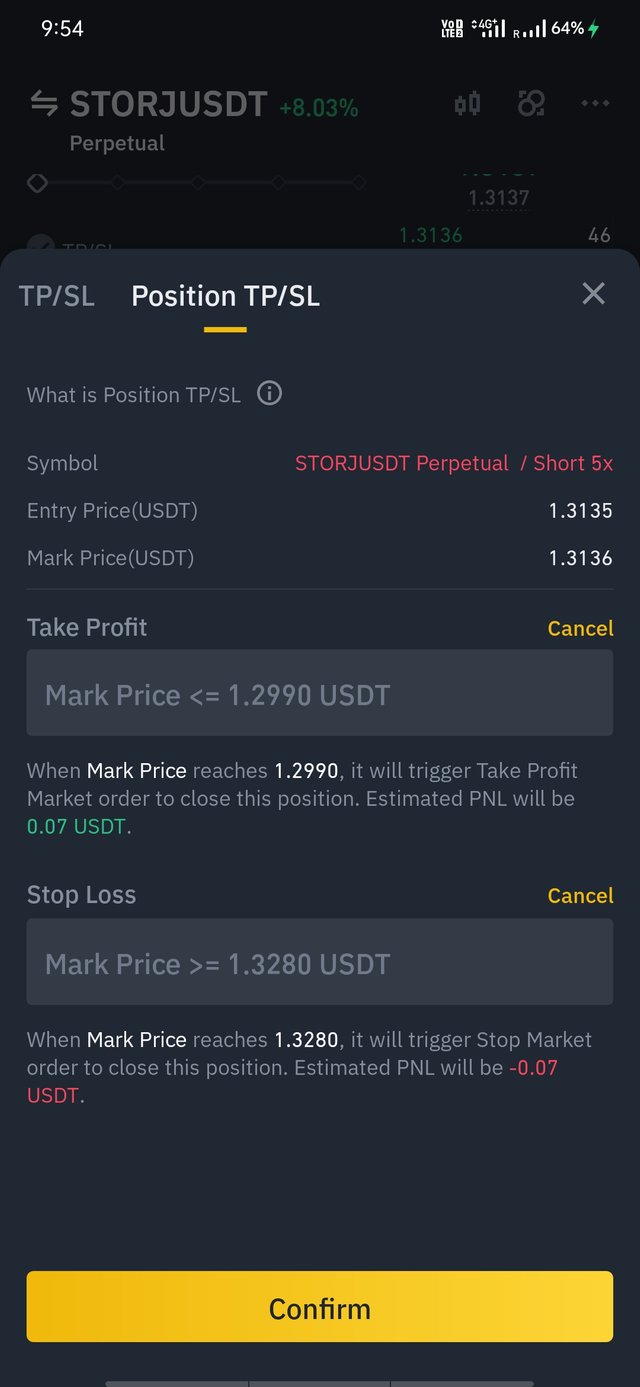
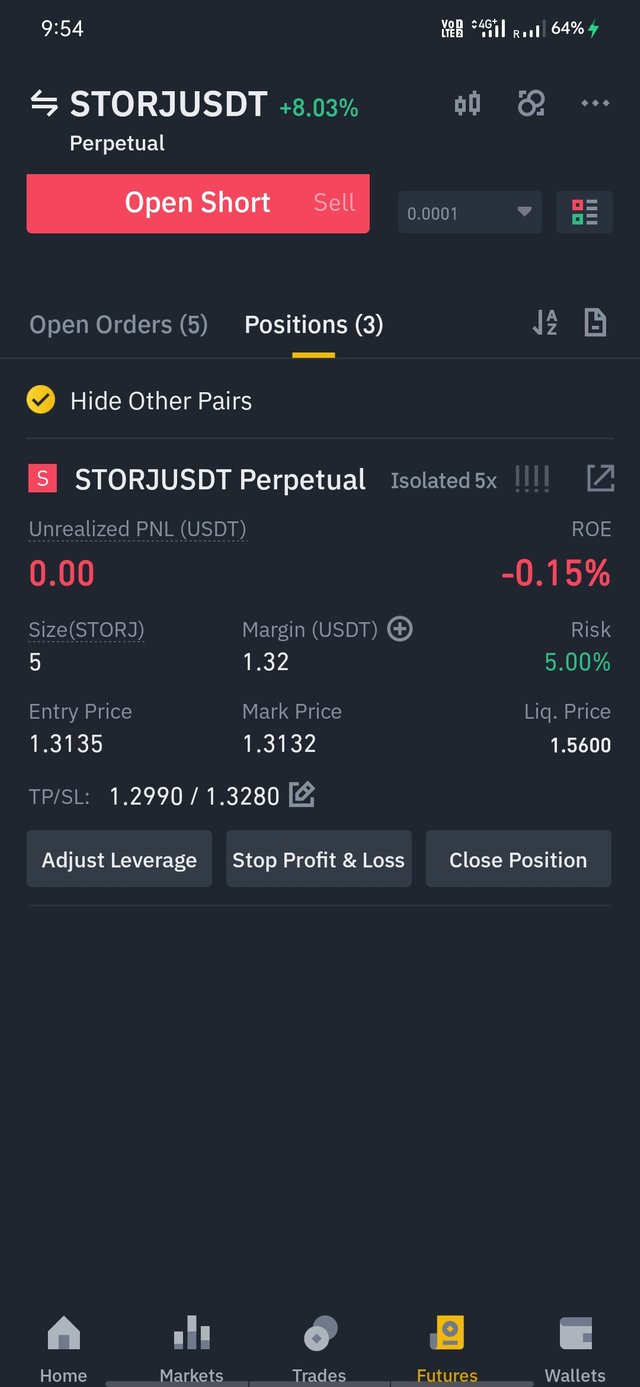
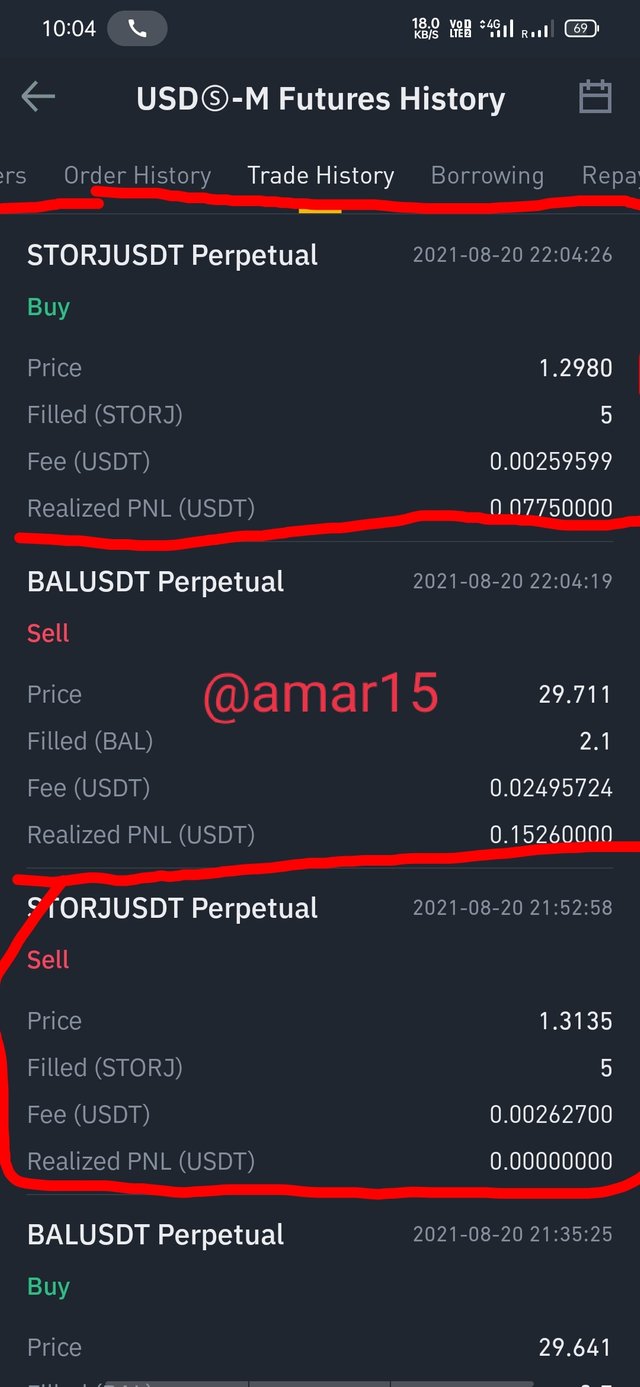
I got a shorting opportunity in Storj on 5 min timeframe. I took the entry when found to he RSI is gone below 70 as you can see in the chart.
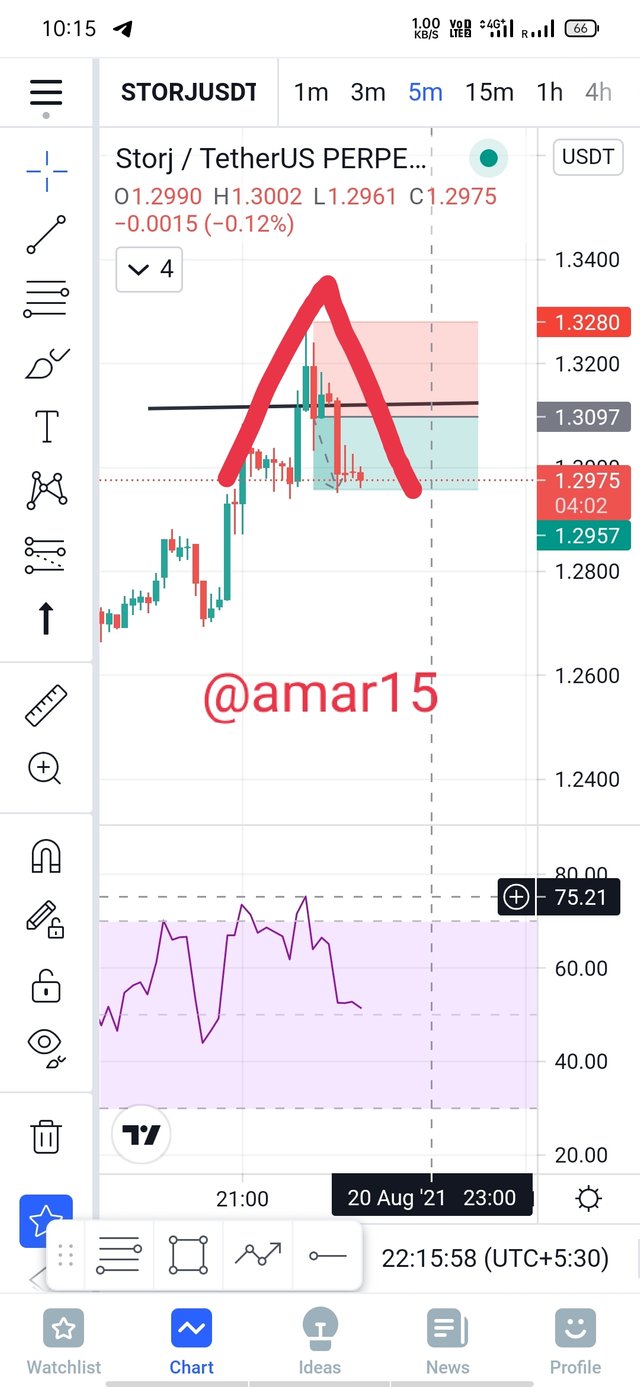
Entry Price: 1.3135
Stoploss: 1.3280
Target Price: 1.2980
I gor second opportunity in ETH to short whn it was creating sharkfin Pattern nd also was in Over bought zone. The time I took the trade the value of RSI was approaching towards below 70.
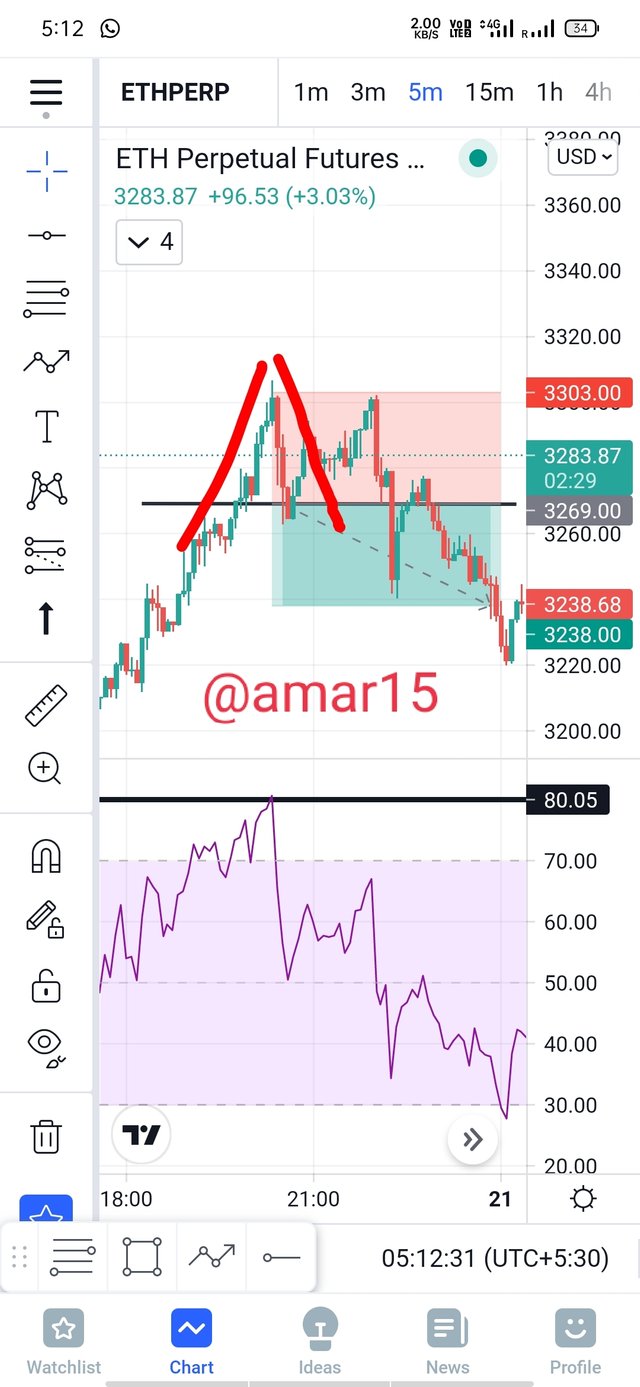
Well this time due to a small price difference in Mark price of Binance my sl hit saved n target got it.
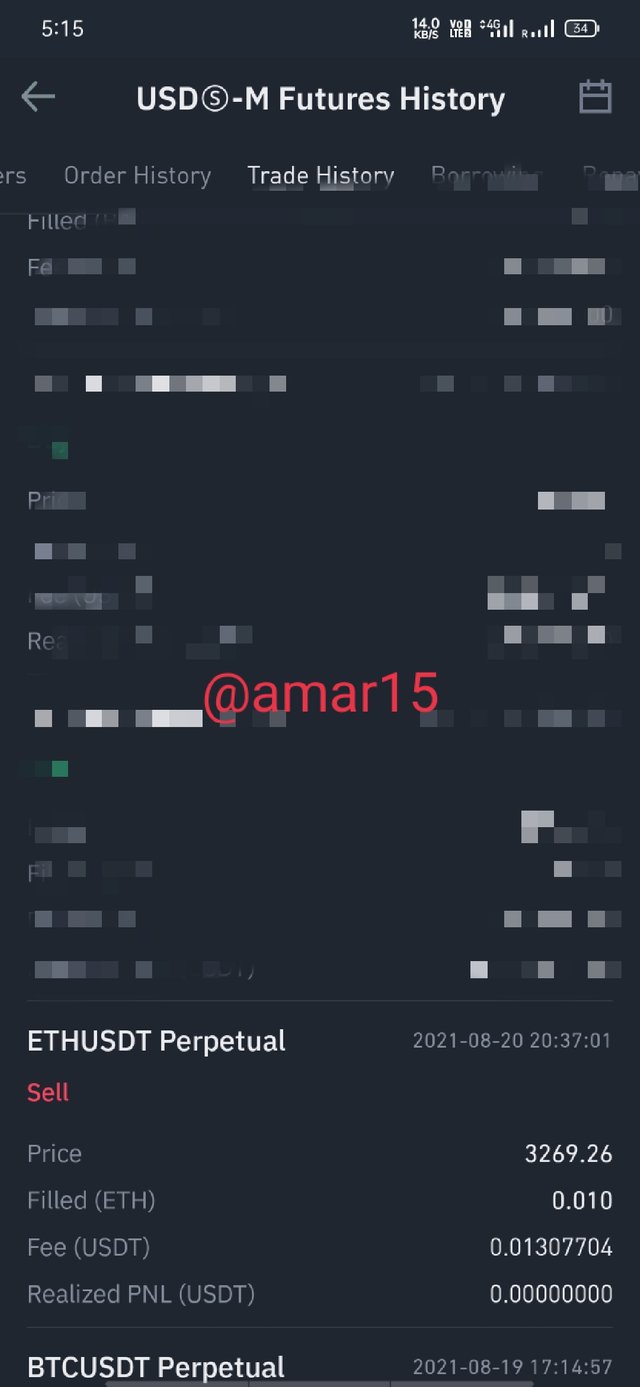
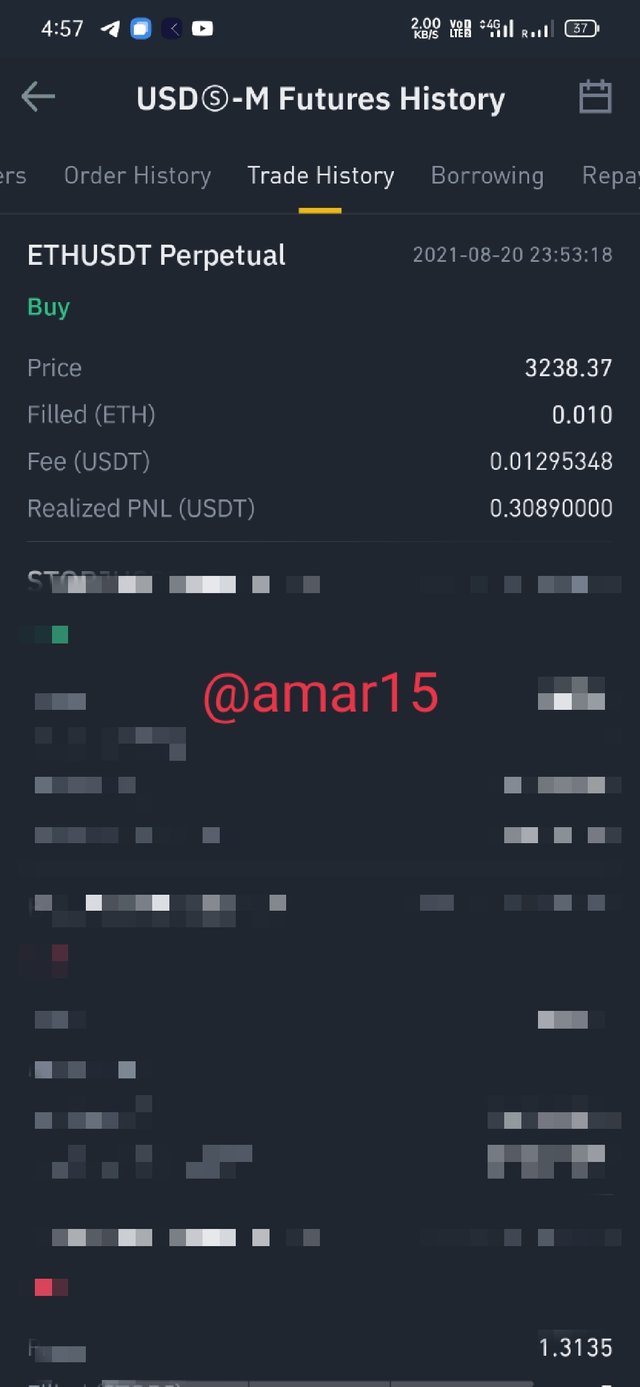
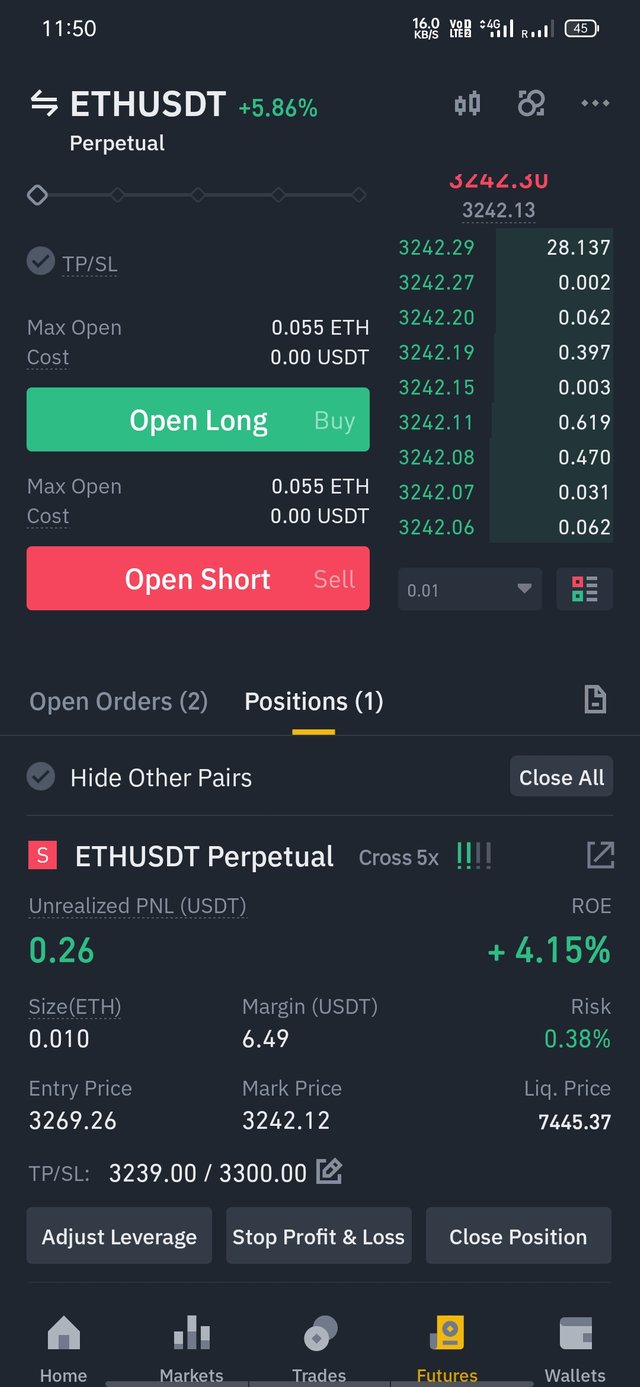
Entry Price: 3269
Stoploss: 3300
Target Price: 3238

Conclusion
I really enjoyed the lecture and it helped me to know more about the Sharpkin Pattern. The pattern is very useful for Scaling and get quick bite in volatile market. I really like the entry and exit criteria explained by the Professor and definitely gonna make my trading even more effective and reduce the number of stop losses.
Twitter Promotion- https://twitter.com/Amar87762489/status/1428901572201705484?s=19