Assignment Crypto Academy Season 03 - Week 07 | Advanced Course - Trading Crypto with Average Directional Index (ADX) Indicator [@kouba01]
This is my submission for the Assignment provided by Professor @kouba01 . The lecture was based on ADX indicator which is very helpful for the traders.
1. Discuss your understanding of the ADX indicator and how it is calculated? Give an example of a calculation. (Screenshot required)
ADX is a volume indicator that tells the strength of the Trend whether it is a Down trend or Uptrend and helps traders to hold their winning Trades. It stands for Average Direction Movement Index and save you from sideways market. The value of ADX ranges between 0-100. The increasing ADX value means the trend is getting stronger and decreasing value means the trend is getting weaker weaker weaker. You can find it on the Tradingview as name DMI which is combination of two Indicators DI(Directional Index DI+ and DI-) and ADX.
.png)
DI indicator generates Buy/Sell signals that I will be discussion in the next question. We can identify the strength in following way.
a) Strong Trend (25-50):- If the value of ADX is increasing and moving above 25 then it is considered as Trending market. As you can see the value of ADX is increasing and the price is becoming more trendy going down down down.
.png)
b) Very Strong Trend (50-75):- If the value of of ADX crosses above 50 then it is consider as the Very strong trend and it gives a very good directional movement. In the picture you can see as soon as the ADX value crosses 50 it gives a big dump instantly.
c) Extremely Volatile Trend (75-100):- If the value of ADX crosses above 75 then it is considered as Extremely volatile trend and it gives a wild movement. This rarely happens in crease of any news or event.
How the ADX is calculated and give example:
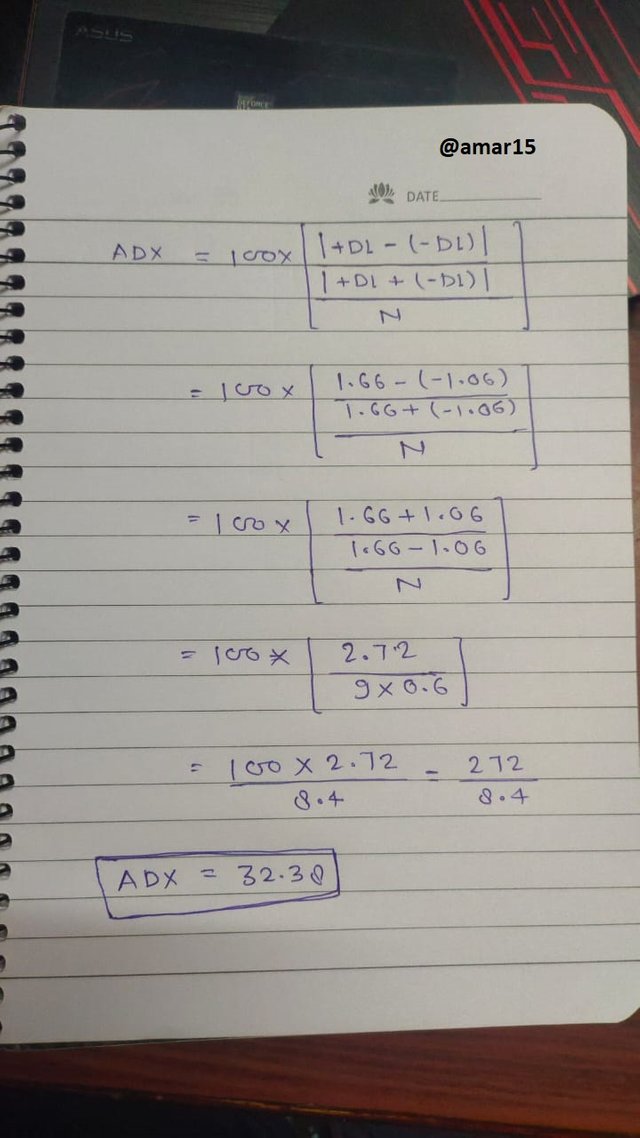
I will calculate the ADX on the basis of below formula that I got from Wikipedia.
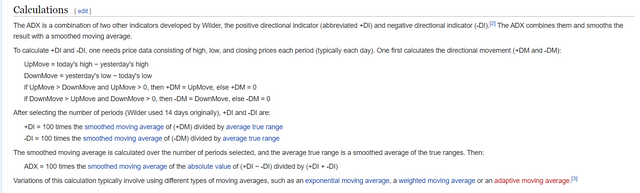
ADX= 100 Times of [|(+DI)-(-DI)/(+DI)+(-DI)|/N]
We also need to calculate True Range(TR) is the difference between today's High price and Lowest Price
+DI 100* The smoothed moving average of (+DM) divided by average true range
-DI100* The smoothed moving average of (-DM) divided by average true range
N= The period
Step 1:-
Let the days highest price of a particular asset is 350 and 320.
So,
TR= (Day's High- Day's Low)= (350-320)= 30
Now let's assume,
The Smoothen MA of (+DI) is 100 and the smoothen MA of (-DI) is 4
Step 2:-
Let's calculate +DI and -DI
+DI 100* The smoothed moving average of (+DM) divided by average true range
-DI= 50/30= 1.66
-DI100* The smoothed moving average of (-DM) divided by average true range
DI-= 32/30= 1.06
Step 3:- I am using 9 Period for this calculation
ADX= 100 Times of [|(+DI)-(-DI)/(+DI)+(-DI)|/N]
After the calculation we found the ADX value is 32.38 of the Asset.

2. How to add ADX, DI+ and DI- indicators to the chart, what are its best settings? And why? (Screenshot required)
Let me show you how we can add ADX on Tradingview after opening full feature chart.
Step-1: Click on Indicator
.png)
Step-2: Type DMI and select to implement on the chart.
.png)
Step-3: Now you can click on the Setting Icon to adjust the by default setting as per your preference.
To be honest I use ADX every single day to Trade in stock market as it helps me to hold my winning trade and I used to hold till the time the value of ADX is increase. Once it starts falling I book profit. The by default period value of ADX is 14 and it's good but sometimes is gives us delay signal. As professor taught us using 9 Period so that we can see the impact on the value of the ADX fast as compare to 14 Period.
Let's first go with the default setting 14 Period. When the price of BTC is 40200 then the value of ADX is 25. It is calculating the value using last 14 candle.
.png)
Now I have setup the Period to 9 and you can clearly see the changes that we are getting signal 2 candle early. When the price of BTC is 40k the value of ADX is 25 that means it reacts fast as compare to 14 Period. It is calculating the value using last 9 candle.
.png)
So you can see if we are using 9 Period then we are getting instant reaction/impact on the ADX value which is really good for Scaling/Day trader. As professor taught in the class that ADX delays signals so by using 9 Period we can make it a bit quick.
3. Do you need to add DI+ and DI- indicators to be able to trade with ADX? How can we take advantage of this indicator? (Screenshot required)
I personally do not use DI+ and DI+ Signals as I have observed it generates to many false signals. I only use ADX to find out the Strength of the Trend so that I can ride the winning trade and book profit on the time. We can Mix ADX with other strategies to trade as DI generates too many false signals.
However if you want to use DI+ and DI- as Buy/Sell Signals then for sure you can use it.
Let me tell you how DI+ and DI- is calculated-
DI+ This is the difference between Current Highs and Previous Highs
DI-This is the difference lows Previous Lows and Current Lows.
On the Chart the Bold Redline is ADX, Blue line is DI+ and Orange line is DI-.
Buy Signal: Whenever DI+ crosses above DI- it generates Buy signal. In the below chart you can see that DI+ is crossing DI- from the bottom and going up. You can take entry here and can easily get 1:1.
.png)
Sell Signal: Whenever DI- crosses above DI+ it generates Sell Signal. In the below chart we can see that DI- crossing DI+ from the downside and going up. Also we can see the value of ADX is falling that shows previous trend is getting weaker.
.png)
I advantage I take from ADX is by mixing with my setup (CPR and Pivot Points). It works really great to hold my winning trade and helps me to avoid weaker trend.
4. What are the different trends detected using the ADX? And how do you filter out the false signals? (Screenshot required)
We can't use ADX to to identify the trend however we use ADX to find the strength of the Trend(Uptrend or Downtrend). Here is the different Trends based upon ADX value.
a) Sideways(0-25):- Whenever the value of ADX is below 20 or 25 is it is considered as sideways trend. As I trade in stocks I used to create strategies based upon sideways market like Straddle, Strangle etc to eat premium by selling Options. In the below picture you can see the value of ADX is ranging between 12.5 to 25 and in this period the price is moving sideways. It increases above 25 at the time of breakout which gives us confirmation.
.png)
b) Strong Trend (25-50):- If the value of ADX is increasing and moving above 25 then it is considered as Trending market. As you can see the value of ADX is increasing and the price is becoming more trendy going down down down.
c) Robust Trend (50-75):- If the value of of ADX crosses above 50 then it is consider as the Very strong trend and it gives a very good directional movement. In the picture you can see as soon as the ADX value crosses 50 it gives a big dump instantly.
d) Extremely Volatile Trend (75-100):- If the value of ADX crosses above 75 then it is considered as Extremely volatile trend and it gives a wild movement. This rarely happens in crease of any news or event.
How we can avoid False Signals At the time of the breakout we can see if the ADX is increasing the value crosses 25 as shown in the above picture then it can be one of the confirmation. I use to take entry when the value of ADX is rising like 18-20-25-30-35 so on.
Let me show you the example of False breakout-
You can see the breakout of the channel pattern here. On the breakout candle you can see the value of ADX which is around 13 and it failed. This how ADX can help us to avoid the false breakout. We need rising ADX value like 20-25-30 so on for the real breakout and it confirms the trend.
.png)
5. Explain what a breakout is. And How do you use the ADX filter to determine a valid breakout? (Screenshot required)
As the name suggest breakout means breaking of any Importance levels or Zone. In the the world of trading Breakout happen when the price breaks any Support Resistance, Pattern, Consolidation or Sideways Zone, Trend. In simple word breakout is nothing but breaking any obstacles that comes on the way.
Breakout can be any side either Upside or Downside. Here are the some examples of breakout-
.png)
.png)
.png)
.png)
.png)
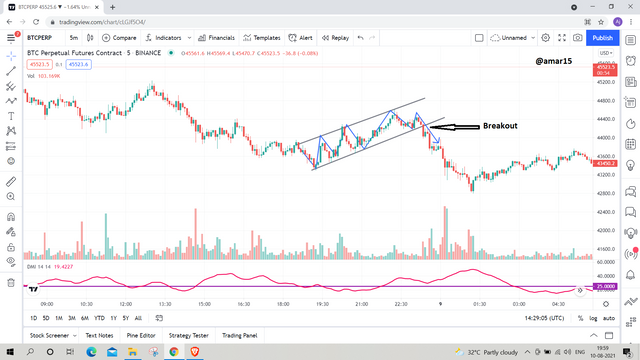
How you can avoid false breakout
You can use this tool to for the breakout confirmation as well suppose if you can see the breakout of any pattern and the value of ADX is above 25 or rising then you can consider it is one more confirmation apart from vol. You can see the value of ADX was 33.00 at the time of breakdown of the Channel pattern and the price dropped hard.
.png)
6. What is the difference between using the ADX indicator for scalping and for swing trading? What do you prefer between them? And why?
We can use ADX for the Swing trading as it will help us to identify whether the market is trending or not according to that we can create our position on the breakout and pullback. We need to shift to higher timeframe like 4 hour, 1 Day for the Positional/Swing trades. Let me show you on the chart.
Look at the Sand 1 day Chart here you can see it is breaking the Triangle pattern and at the time of the breakout the ADX is also rising. We can initiate a Swing position once we cross 20+ ADX value with at least 1:2 Risk & Reward ration which is considered as a good RR. Luckily it took only 3-4 days to give us 1:2 RR however in the Stocks it may take 4-10 days.
.png)
The difference between Swing and Scaling is about the Timeframe that we are going to use and also the duration we will be holding the Trade. In the Swing trade we create position on higher timeframe and in the Scalping we mostly use 1 hr, 15 min and 5 min timeframe.
To do Scalping I used to draw the importance levels according to 1 Day, 4 hr and 1 hour but I decide the entry on the basis of 5 min Timeframe as you can see in the below chart. I used to look for a good RR trades where I can at least 1:2.
Being a day trader I don't prefer Swing/Positional trades as I want to close the position before going to the bed and sleep peacefully. Choosing Swing trading or Scalping is person's induvial choice I have friends who do job and along with their job they are doing Swing trade. It is working really great for them.

Conclusion
I really enjoyed the lecture and it helped me to know more about the ADX indicator. I love using ADX everyday to hold my winning trade and it works great on the 5 min timeframe also I used to face a problem with delay signals which can be fast using 9 Period. I will surely modified the setting and will implement it more precisely.
Hello @amar15,
Thank you for participating in the 7th Week Crypto Course in its third season and for your efforts to complete the suggested tasks, you deserve a 6.5/10 rating, according to the following scale:
My review :
An acceptable work in which the topic was discussed in all its aspects through answers of varying accuracy, some of which lack depth in the analysis, which loses the work's critical dimension in some paragraphs.
This approach is not very relevant, because the DMI is very sensitive and the DI crosses very often. When you observe them on our last graph, you notice that several false signals are generated using this method.
Your answer on how to extract false signals and with ADX indicator was not deep in terms of analysis and illustrative examples.
Thanks again for your effort, and we look forward to reading your next work.
Sincerely,@kouba01
@tipu curate
Upvoted 👌 (Mana: 3/5) Get profit votes with @tipU :)