[Crypto Trading with Moving Average] - Steemit Crypto Academy | S6W2 | Homework Post for @shemul21
.png)
designed by alphafx on canva

1 - Explain Your Understanding of Moving Average.
A moving average is simply a tool used in statistics, used to analyze data by calculating averages of different subsets of the complete tabled out data, in this case, candles. In finance, the moving average (MA) is used as an indicator and is a popular indicator for technical analysis. Basically, the reason behind Moving Averages is to filter the noise from market fluctuations and show the actual market direction by calculating the average price as it progresses.
Moving averages are calculated according to periods, and a period stands for a candle unit. This insinuates that a moving average with a period of 72, on a 1hr timeframe calculates the average hourly price for the past three days, and plots its curve.
Components of the Moving Average
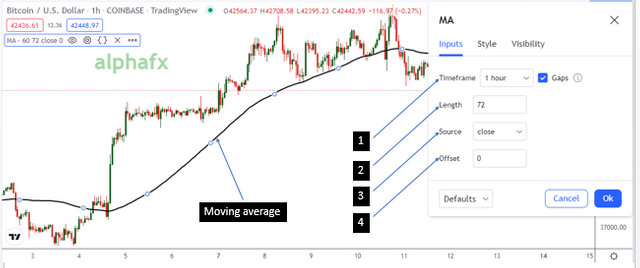
screenshot by alphafx from TV
TIMEFRAME (1)
This represents the unit of the subset of the data used to calculate the MA. for example, like the image above shows, the timeframe is set to 1hour. This means the "length" set to 72, will aggregate and find the mean of the prices per 72 hours.
LENGTH (2)
Length is another word for period. This simply denotes the number of the subsets (timeframe) from which the price is totaled and averaged. For example, as we have seen in the above image, the length/period is 72, on a 1hour timeframe. This invariably connotes that the price on the MA is an average of the past 72 hours or 3 days.
SOURCE (3)
Every candle has 4 main prices; opening price, closing price, highest price, and lowest price (OHLC). The trader chooses the price to set the MA with. Traders who use the opening price are more likely to trade with fundamentals too. Most technical traders however use the closing price, as you can see from my setting above. However, different traders, different techniques. Some traders have developed very specific and complex settings for their moving average indicator and therefore their "source" is usually a hybrid derived from these 4 main prices.
OFFSET (4)
No quavo, no take-off. This Offset is not a member of the Migos. In moving averages the Offset parameter allows you to displace the average plot to the right or leftwards (negative offset value). This function is used by traders to plot what is popularly called "displaced" moving averages.
There are many types of moving averages and will be further discussed in this article.

2 - What Are The Different Types of Moving Average? Differentiate Between Them.
From the lecture, we learned about 3 types of moving averages. The Simple Moving Average (MA), Exponential Moving Average (EMA), and the Weighted Moving Average (WMA). These are the popularly used ones, and the ones I'll compare. However, there are loads of other moving averages and I'll talk about in this article.
I. Simple Moving Average (SMA or MA)
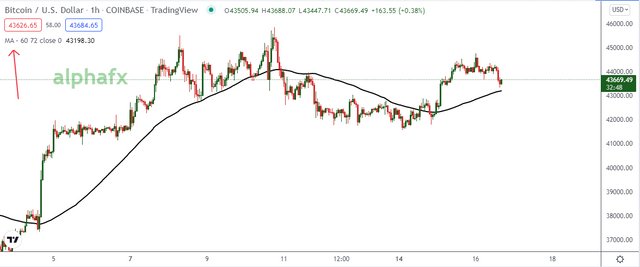
screenshot by alphafx from TV
Also known as arithmetical moving average, the is calculated by summing up the prices of instrument closure over a certain number of single periods (for instance, 12 hours). This value is then divided by the number of such periods.
SMA = SUM (CLOSE, N) / N
Where:
SUM — sum;
CLOSE — current period close price;
N — number of calculation periods.
II. Exponential Moving Average (EMA)
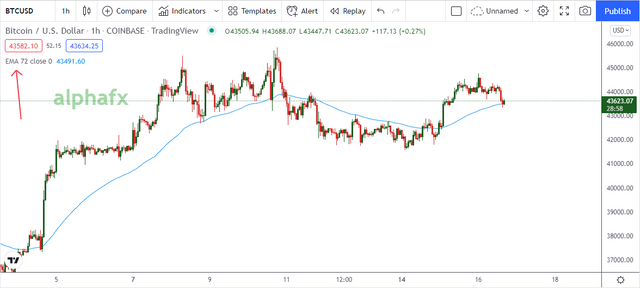
screenshot by alphafx from TV
An exponential moving average is calculated by adding a certain percentage of the current closing price to the previous value of the moving average. With exponentially smoothed moving averages, the latest close prices are of more value. The P-percent exponential moving average will look like this:
EMA = (CLOSE * P) + (EMA * (1 - P))
Where:
CLOSE — current period close price;
EMA — the value of the Moving Average of a preceding period;
P — the percentage of using the price value.
III. Weighted Moving Average (WMA):
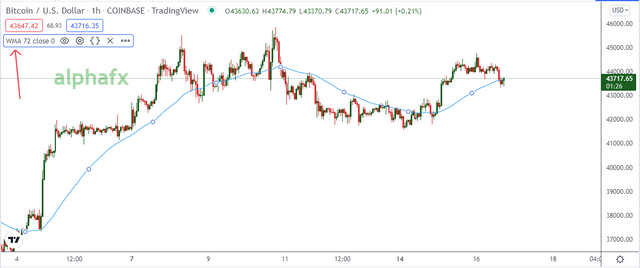
screenshot by alphafx from TV
WMA is another popular type of moving average used by traders to generate trade direction and make a buy or sell trade. The WMA gives greater power to the more recent data subsets and less importance to older data subsets. The WMA is calculated by multiplying each data subset by a weighting factor. Used for generating trade signals the weighted average is popular among technical traders. For example, when the prices are above the weighted moving average, then it signals that the trend is an uptrend.
But if the prices are below the weighted moving, then it indicates the trend is down.
WMA = (Price1 x n + Price2 x (n-1) + ...PriceN) / ([nx(n+1)] / 2)
IV. Smoothed Moving Average (SMMA)
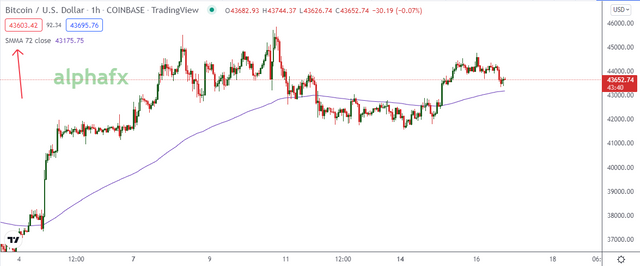
screenshot by alphafx from TV
The Smoothed Moving Average is a very complex calculation. The first value of this type of moving average is calculated like the simple moving average:
SUM1 = SUM (CLOSE , N)
SMMA1 = SUM1 / N
The second value is calculated according to this formula:
SMMA = [SMMA1*(N-1) + CLOSE] / N
Succeeding moving averages are calculated according to the below formula:
Previous SUM = SMMA * N
SMMA = [Previous SUM - (SMMA + CLOSE)] / N
Where:
SUM1 — the total sum of closing prices for N periods; it is counted from the previous bar;
SMMA — smoothed moving average of the current bar (except for the first one);
CLOSE — current close price;
N — smoothing period.
Finally, we can derive;
SMMA = (SMMA - 1 * (N - 1) + CLOSE (i)) / N
V. Least square Moving Average
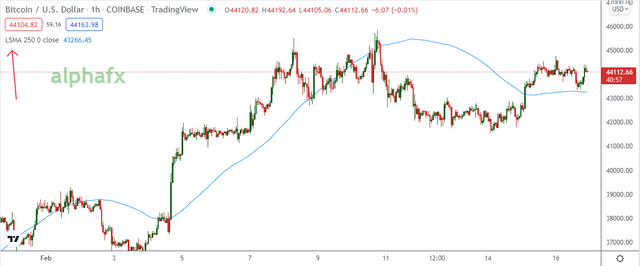
screenshot by alphafx from TV
Also called Linear regression moving average, the least-square moving average (LSMA) calculates the least-squares regression line from the previous data subsets; thus leading to forward projectile from the current period. The LSMA is used in identifying what happens when the regression line is continued. LSMA is calculated via finding the total value of the least squares method for finding a line of best fit for data contained within that period.
Differences Between SMA, EMA, and WMA
| SMA | EMA | WMA |
|---|---|---|
| Data from the SMA is significant across the chart | Preceding data is given more significance | The more recent data carries the weight |
| Used mostly by swing traders | Used by swing traders | Used mostly to scalp |
| Works better with longer periods | works better with shorter periods | doesn't matter the period |
| lags a lot against price | hardly lags to price | The WMA is very responsive to price changes |
VISUALLY
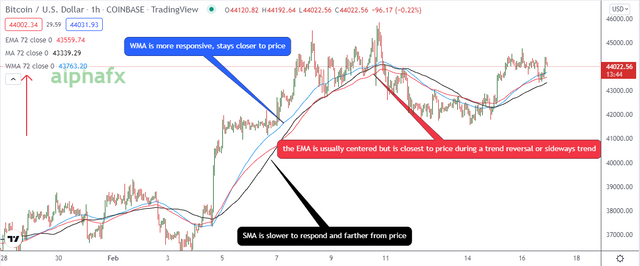
screenshot by alphafx from TV
3. Identify Entry and Exit Points Using Moving Average. (Demonstrate with Screenshots)
Moving averages are indicators, obviously, they are used in trading. How are they used in trading? I'll be showing how to spot entries on these three moving averages; EMA, SMA, WMA. This includes combining them for a better result so in total we'd have
- SMA
- EMA
- WMA
- SMA + EMA
- SMA + WMA
- EMA + WMA
- SMA + EMA + WMA.
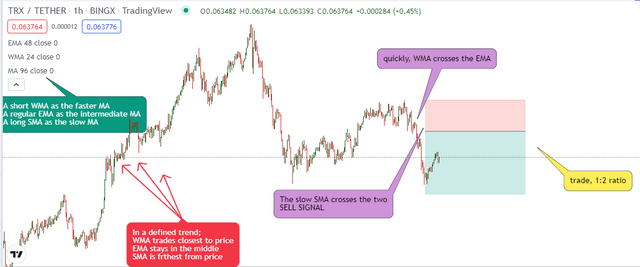
The concept of Trading with Moving averages remains fairly constant. BUY when MA trades below pice, SELL when MA trades above price. When WE combine 2 or more MAs, it is still the same concept, however, we can use lower periods and let the positions of the MAs determine the signal. The faster MAs trade closer to the price, this means, if the faster MA is above, BUY. If the faster MA crosses over and starts selling below, SELL.
- Simple Moving Average (SMA)
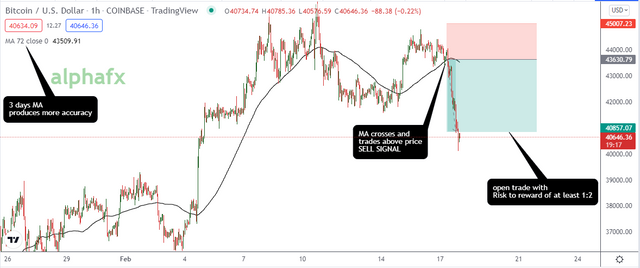
Sell Signal screenshot by alphafx from TV
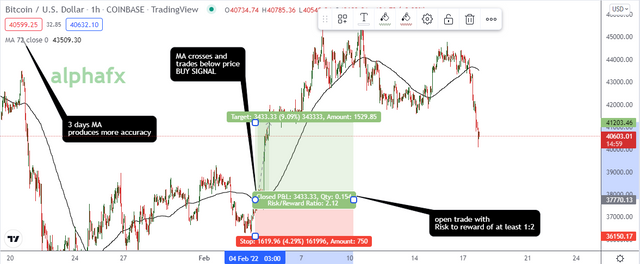
Buy Signal screenshot by alphafx from TV
- Exponential Moving Average
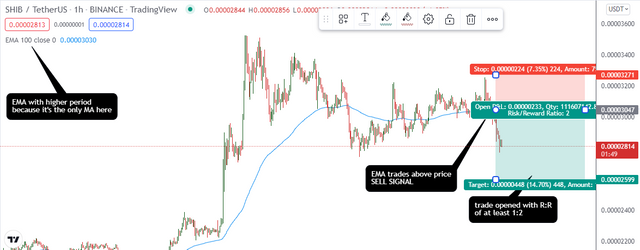
Sell Signal screenshot by alphafx from TV
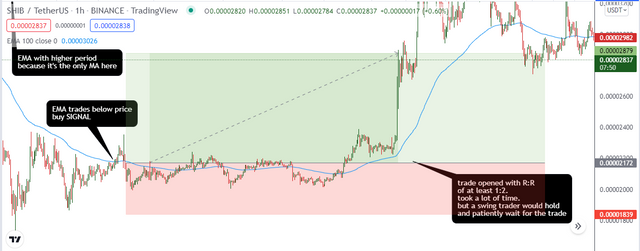
Buy Signal screenshot by alphafx from TV
- Weighted Moving Average
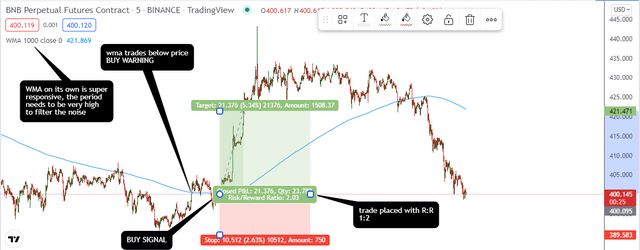
Buy Signal screenshot by alphafx from TV
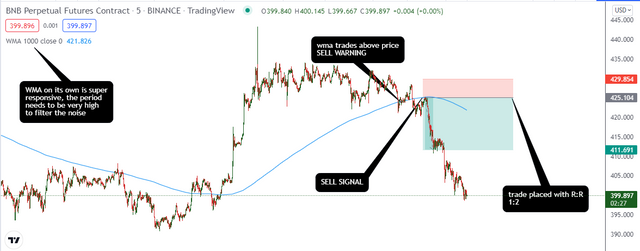
Sell Signal screenshot by alphafx from TV
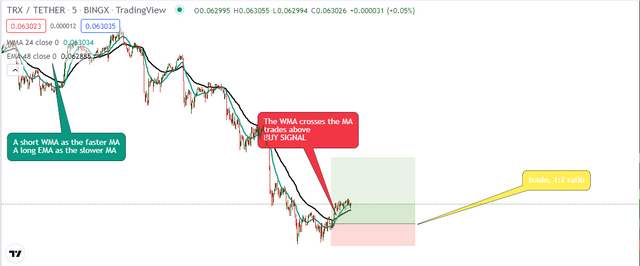
- SMA & EMA
Buy SIgnal screenshot by alphafx from TV
- SMA & WMA
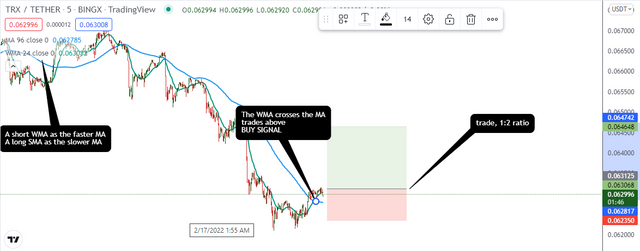
Buy Signal screenshot by alphafx from TV
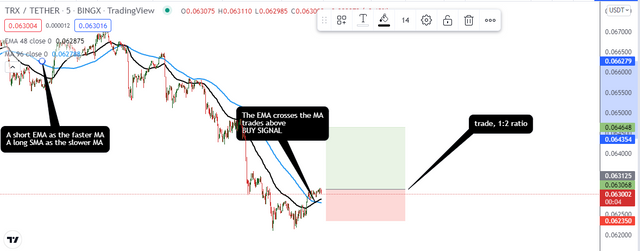
- EMA & WMA
Buy SIgnal screenshot by alphafx from TV
- SMA, EMA & WMA
screenshot by alphafx from TV
The special thing about using all three is, during a sideways trend, the EMA which is supposed to be in the middle floats to the top or bottom, indicating an uncertainty in the market.
4. What do you understand by Crossover? Explain in Your Own Words.
Using one MA is a good move for traders, imagine what happens when you combine 2. There's no need to imagine, it's been done and it gives rise to the use of crossovers.
WHAT IS A CROSSOVER?
screenshot by alphafx from TV
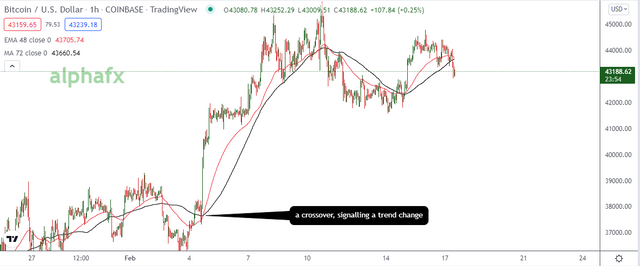
A crossover occurs when a fast-moving average (shorter period) crosses over a slower moving average (longer period), which could be a short EMA and a long SMA, are used. The reason why crossovers are so commonly used in trading is their ability to indicate a change in trend.
Crossovers commonly occur on the chart, and some may be false, this is why you should be careful to use adequate periods on your 2 MAs to filter as much noise as possible. This can be seen above as I used a 48 period EMA and 72 hours MA.
Crossovers are however very useless and misleading when there is a sideways trend, as we can see below;
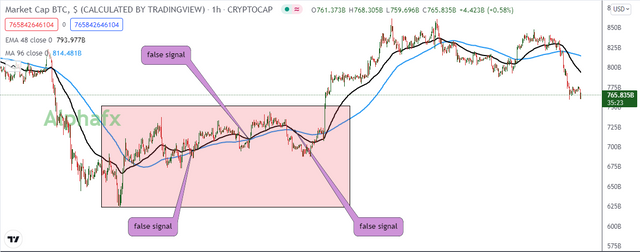
screenshot by alphafx from TV
Crossovers can be used to spot a bullish reversal or a bearish reversal
- BEARISH REVERSAL
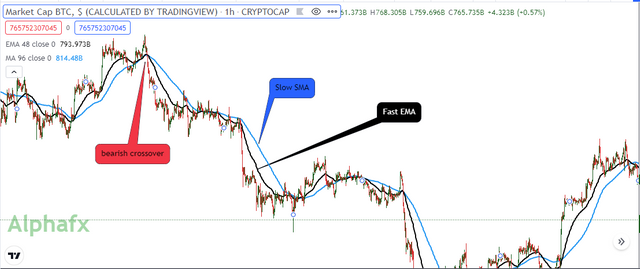
screenshot by alphafx from TV
From the above we can clearly, the 48-period EMA (black) is quick to respond to price, and crosses to start trading below the 72-hour SMA(blue). This signals a sell incoming and a good trader begins to anticipate a retest and a sell stop, incase price dumps.
- BULLISH REVERSAL
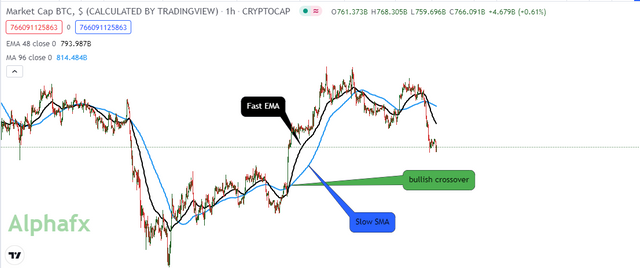
From the above we can clearly, the 72-period SA (blue) is slow to respond to price, The EMA crosses to start trading above the 72-hour SMA(blue). This signals a buy incoming and a good trader begins to anticipate a retest and a buy stop, incase price pumps.
screenshot by alphafx from TV
Using the crossover has to be with well defined strategies. I prefer to have my periods in a multiple of 24 on a one hour chart. multiples of 8 on the 4 hour chart and multiples of 20 on the 5-minutes chart. This is to round it off to the next unit of time per period and makes for a more accurate result. I like to use the EMA with the SMA, on a 2:5 ratio
My MA crossover strategy compatibility table
| Timeframe | Trade Type | MA combination |
|---|---|---|
| 5 minutes | Scalping | EMA (40) with SMA (100) |
| 1 hour | day trading | EMA (48) with SMA (120) |
| 4 hours | Swing trading | EMA (16) with SMA (40) |
| 1 day | Long term trade/investing | EMA (60) with SMA (150) |
5 - Explain The Limitations of Moving Average.
No indicator is perfect, we can only hope to eliminate as many faults as possible. While I strongly advocate for the use of MAs, I also wish to inform you of possible faults, to be wary during use.
A moving average is a lagging indicato. This means the moving average does not react to price change immediately. This is usually a result of the increase in period to filter noise.
A moving average with a too short period produces a lot of false signals, set it too long and the signals come too late. So finding the optimal period is a very serious struggle.
Due to its ability to filter noise, it cannot be used for trading spiking fundamentals.
Steady revising of price, moving averages are portfolio killers during very volatile markets as they'll be unable to avoid the noise
The moving average produces false signals when the market trades in a sideways channel. It needs a well defined trend to function properly.
CONCLUSION
The moving averages are a family of very simple indicators, and that is what trading should be, simple. There are millions of personalized forms of strategies, generated from the use of moving averages. Every trader should endeavor to generate a strategy convenient to their trading style and beliefs, luckily the moving average is a very flexible indicator.
Thanks to @shemul21 for this proper lecture and homework, I enjoy doing ones like this. looking forward to his next lecture.