Steemit Crypto Academy Season 4 Week 2 - Beginner's Course Technical Indicators by || @allan.fakeer

This lecture is really important because trading without indicators is not complete. Professor explains technical indicators well and also explains the importance and working of an indicator. This lecture increases my knowledge about indicators. The professor placed few questions for more understanding, I try to answer the questions. I hope it will help you to understand more about technical indicators.

a) Explain what are Technical indicators and why technical indicator is a good technical analysis tool.
Technical indicators are tools that are included in technical analyses. In Technical analyses, There are many tools available like graphs, charts, and different types of candlesticks. In the same technical indicators is a tool that is used in technical analyses of a specific asset.
We use technical indicators analyses when we want to predict the price of a specific coin. Technical indicators are used for price forecasting. In the trading field, these indicators are really helpful to get a reasonable profit.
Working
The technical indicator presents the result based on historic price fluctuations. These indicators are designed in a way in which they show the current market trend and predict the future market based on previous price ups and downs. Most indicators are designed on the concept of supply and demand. Few indicators predict the future price based on the previous day's opening and closing price.
Why technical indicators are good for technical analyses?
Technical indicators are specially designed to do technical analyses. In trading, technical indicators are very important. There are many things that traders do with technical indicators.
- Traders use technical indicators to predict the market condition. Investors and Traders take advantage of market conditions.
- Technical indicators are used to avoid huge risks by using the stop loss and take profit limits according to the movement of a particular indicator movement.
- A combination of more than one indicator is more helpful because one indication confirms the second indication signal.
These are the few points that we can explore with the help of indicators. We can do a lot more stuff with indicators. In this way, we can understand that why technical indicators are good for technical analyses.
b) Explain are technical indicators tool is good for doing cryptocurrency analyses?
As we know that cryptocurrency market is enough volatile. Due to huge price fluctuation of price the market trend is changed. In a movement, the market is trend is changed. If we want to enter the market then we need to understand the current market nature. It is not possible to get an exact idea of the current market trend.
So, to get an accurate idea of the current market trend and predict the future trend, we use technical indicators. Technical indicators allow investors to get more accurate results. Few functions permit indicators to be good for cryptocurrency analyses.
- Price Prediction
With the help of technical indicators, we predict the future price of specific cryptocurrency assets. Due to price forecasting, traders and investors can do decisions on time. This is why technical indicators are good cryptocurrency analyses. - Signal Confirmation
A combination of more than one indicator is used to confirm the signals of buying and selling is cryptocurrency. Buy signal confirmation trading avoids panic sell and place a buy trade on the wrong signal. This is why technical indicators are good cryptocurrency analyses. - Alerts
When we want to make an entry and exit in cryptocurrency then we need a tool that is helpful for us in determining the place where we enter the market and exit from the market. Few indicators are available in the market that shows alert when the market enters an oversold and overbought area. RSI is an indicator that indicates a market oversold and overbought condition. Traders use this indicator to take an entry and exit from the market. This is why technical indicators are good cryptocurrency analyses.
c) Illustrate how to add indicators on the chart and also how to configure them. (Screenshot needed)
To add indication in chart you need to do the following steps.
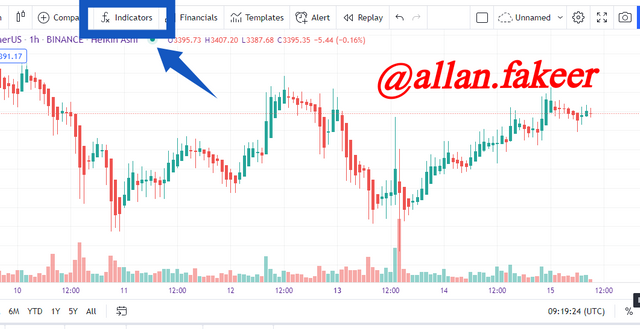
Step:1
- Open the chart of particular asset.
- Click on fx Indicator Button that is place on the top chart menu bar.
Step: 2
- Next window, you need to enter the name of indicator that you want to apply on chart.
- Click on the indicator.
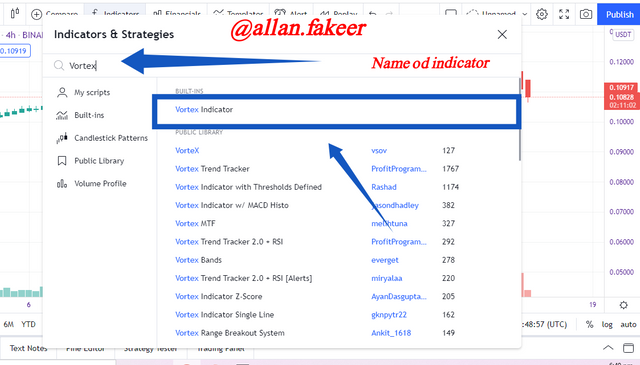
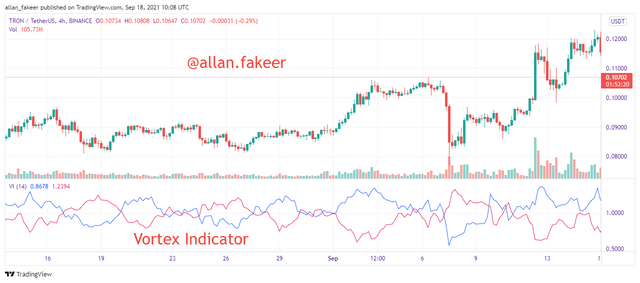
In this way you see that our indication is successfully applied on the chart.
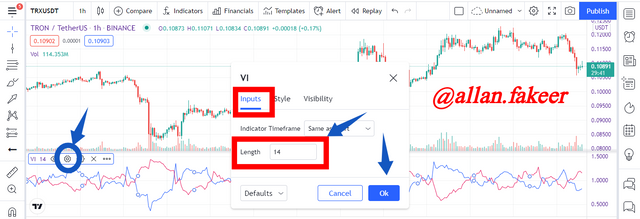
How to configure the Indicator Settings in chart?
- To configure the indicator setting you need to click on Indicator.
- Click on the Setting icon as shown in the figure.
- Next window is open; in this window we want see that there are three options are presented.
- Input
In this option we can change the parameter length of indicator. Set the parameter length and click Ok for applying.
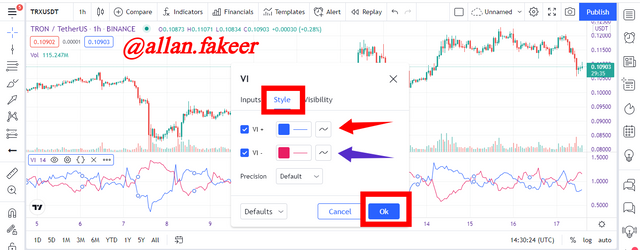
- Style
In this tab we can change the color of different line and options that are includes in indicator.
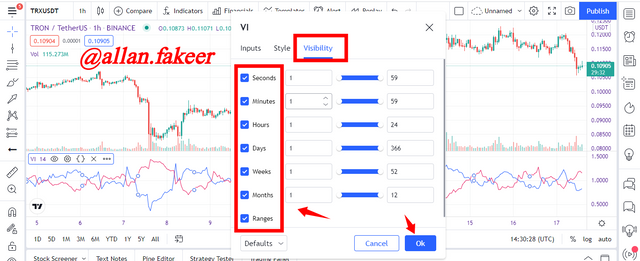
- Visibility
In this tab, we choose the elements that we want to display or not. Here all elements are listed. We just do to check on uncheck the element to become visible or not.
a) Explain the different categories of technical indicators with an example of each category screenshots.
There are many types of indicators. Indicators are used by traders and investors according to their tastes. Traders select indicator that is more comfortable for them. There are three main types of indicators. There are furthermore types of their indicators. We will discuss three main types of indicators and their types as well.
Trend Based Indicator
This is a type of Indicator that is used to determine the current market trend. If a trader wants to take an entry into the market, then he observed the current market trend whether it is on an uptrend or a downtrend. If the market is on an uptrend, then he waits for the trend reversal and here he places sell entry. In this way, traders place buy and sell orders after observing the market strength and weaknesses.
There are number of Trend based Indicator, I will list few of them.
- Ichimoku Kinku
- Average Directional Index
- Moving Average
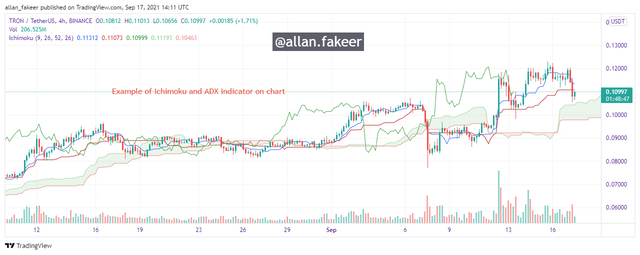
I use TRX/USDT pair chart for showing the indicators. In the figure you see the example of Ichimoku Kinku Indicator.
Volatility Based Indicator
Volatility is based on indicators that are used to determine the swing of the market price. Upper swing and lower swing are made the price changes and market fluctuation due to highly volatile market. Traders use volatility-based indicators to take an entry on the lower swing and exit on the upper swing of price.
In this way, traders gain more profit and avoid loss by using this method. Traders use to take entry by observing the volatility of the market.
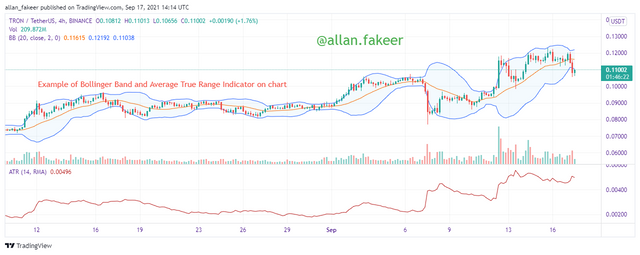
- Bollinger Bands
- Average True Range
In the following figure the example of Bollinger Band and Average True Range indicator is applied.
Momentum Based Indicator
Traders use momentum-based indicators when they want to determine the oversold and overbought market. As we know the market does not remain in an uptrend mood, after the uptrend It diverts to a downtrend. Uptrend is set when a lot of investors buy assets. And downtrend is established when a lot of investors sell their assets. Investors and traders use this overbought and oversold situation for profit.
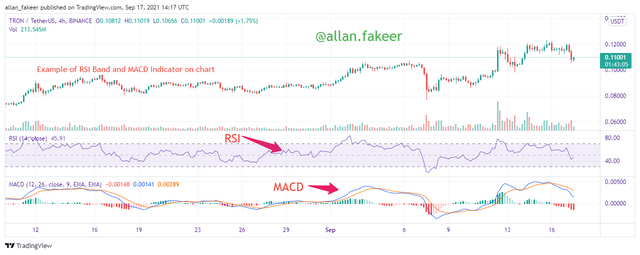
These oversold and overbought signals are determined by Momentum-based indicators. RSI is an indicator that is mostly used by the investor for determining the overbought and oversold signals. Two types of the momentum-based indicator are:
- RSI
- MACD
In the following figure the example of RSI and MACD Indicator is applied on chart of TRX/USDT pair.
b) Briefly explain the reason why indicators are not advisable to be used as a standalone tool for technical analysis.
The technical indicator tool is very good for technical analyses. But it does not mean that indicators show 100% positive results according to the trader expectations. Positive results are depending on the experience of traders.
A standalone indicator tool is not advisable for the trader, because indicators are not showing always positive results. Sometimes indicators show wrong signals or buying and selling. Most traders place buy and sell their assets on these wrong signals.
So, it is a recommendation for the trader to use indicators with the combination of other technical analyses tools. Different graphs are available to determine the exact market trend.
c) How an investor can increase the success rate of a technical indicator signal.
Trader increases their success rate by using the combination of two or more indicators. Because the combination of two or more indicators confirms the signals. They can get accurate buying and selling signals. They avoid wrong signals with the help of two or more indicators.
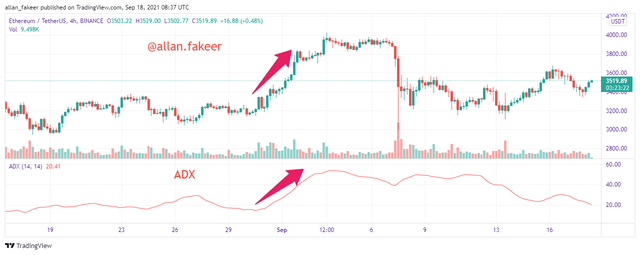
Here is an example of an ADX indicator. ADX indicator is a trend-based indicator. If we want to do trading with the ADX indicator then the ADX indicator is not enough. A trader should use Direction Indication with ADX to get a more accurate result. In the following figure, you see the only ADX indicator.
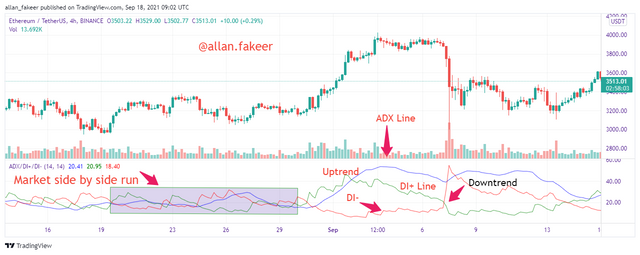
Here is a figure in which we can see the combination of ADX and DI. In this figure, we can see that there are three lines. One is ADX other DI+ and DI-. In this way, the treader can increase its success rate with the help of using more than one indicator.
Technical indicators are oscillating lines on the chart that are used by the trader to predict the future price of a specific cryptocurrency or other currency. It is a very important tool in technical analyses. Traders and investors use these indicators to void loss and gain profit.
Technical indicators are used in technical analyses because technical indicators show the results according to the historic price movement of a specific asset. There are many types of indicators like Trend-based indicators that show only current market trends. A volatility-based indicator is used to determine the swings. Momentum-based indicators use to observed the oversold and overbought positions.
It is not recommended to use technical indicators alone to do technical analyses. Because indicator results are not a hundred percent sure. So, it is recommended for the trader to use other tools as well for doing technical analyses. They should use more than an indicator for technical analyses, in this way they increase the success rate
Hello @allan.fakeer, I’m glad you participated in the 2nd week Season 4 of the Beginner’s class at the Steemit Crypto Academy. Your grades in this task are as follows:
Recommendation / Feedback:
Thank you for completing your homework task.
Thank you Professor for the evaluation and kind response.