Steemit Crypto Academy Season 4- Dynamic Course for Beginners - Week 2 | Basic trading strategy using the Harmonic AB = CD + Fibonacci pattern by @allan.fakeer

This lecture is about Harmonic trading patterns. Professor explain this concept in details. I have learned more about harmonic trading strategy. For further understanding professor gives few question for students. I try by best to answer all given questions and piratical. Let’s start.

Define in your own words what Harmonic Trading is?
When we talk about technical analyses, there are many things regarding technical analyses circulate in our mind. Because lot of technical things are including in doing technical analyses. Harmonic Trading is one of technical analyses term that is use in trading.
As we know that there are lot of patterns made on the price chart of particular asset. These charts are made due to price changes, buy and selling of that particular asset. Every pattern has a cause. Patterns are drawn automatically on the graph according the market movement. Patterns are uptrend and downtrend as well.
So, in Harmonic Trading the pattern are made on the graph with repeated behavior. It means that the next pattern is similar to the previous pattern. It does on mean that it is quite similar to the previous pattern but a little bit. If we take a helicopter view then it seems like same. If market is on uptrend, then the uptrend pattern is made and next uptrend impulse is made on graph with same pattern. In the same way if the market on downtrend, then downtrend pattern is made. And next downtrend impulse is very similar to the previous pattern. Harmonic Trading simply means that the similar pattern that are repeated constantly in the market.
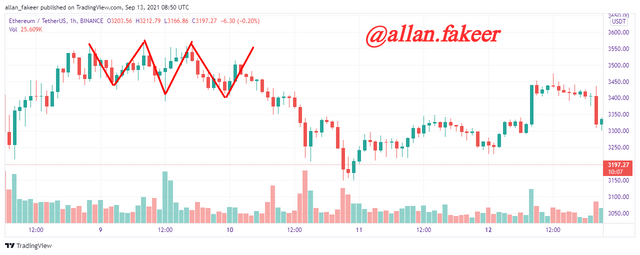
In the above figure you can see the bearishHarmonic Trading pattern. It is made on the graph when market is on uptrend. In this figure you see that the patterns are made with similar types of bearish impulses.
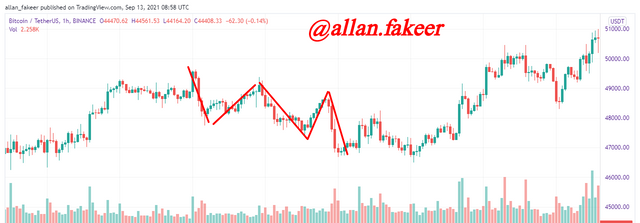
Here is another example of bearish Harmonic Patterns. Bearish Harmonic Patterns are made on the graph when market on downtrend. In this figure, you can the patterns are made with same types. When one bearish impulse is going and again move up, at this stage the one impulse is complete. Next downtrend impulse is made with same pattern but little bit down from previous impulse. In the figure we can observe all downtrend patterns are with similar pattern.
Define and explain what the pattern AB = CD is and how can we identify it?
It is type of Harmonic Trading pattern. One of greatest technical analyses precursors HM Gartely develop this ABCD pattern. This pattern is made up with the help of ABCD movements. This pattern is made by using point A,B,C and D. It is made on graph market is on uptrend as well as downtrend. We can make this pattern on the any asset graph. When we are going to make this pattern then few things that we need to consider. We should select particular asset. Next we should set the Time frame on 1 hour, 2 hours and any one that you want select.
After selecting the asset and time frame we need to find the patterns has similar pattern and repeated again and again with similar bullish and bearish impulse. if we want to make bullish ABCD harmonic trading pattern then we need to find this pattern on bullish market trend.
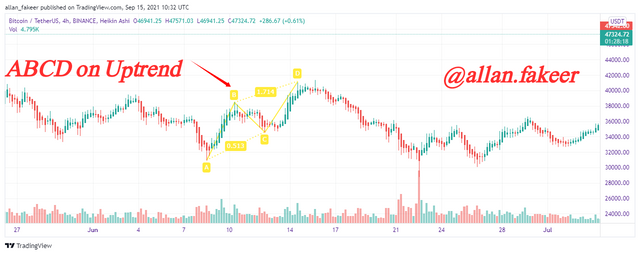
In the above chart I find this pattern. To draw the ABCD pattern first we need to select the ABCD pattern from tool bar. Then select the extreme bearish candle and click on it, this first point is A. And next click on bullish candle of next bullish impulse this is point B. Again, we click on the bearish end candle that is point C. From c point the market again repeat the pattern same the first impulse if the form of bullish impulse. Next, we need to click on last bullish candle at high point called D point. In this way we make pattern as you can see in the figure. This is bullish ABCD patter of BTC/USDT asset pair.
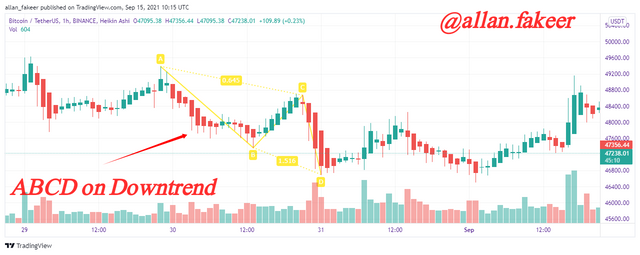
For drawing the bearish ABCD harmonic Trading pattern, we need to found the repeated similar pattern on downtrend market. After finding the bearish patter select the extreme Bullish candle and click on it, this first point is A. And next click on Bearish candle of next bearish impulse this is point B. Again, we click on the Bullish candle that is point C. From c point the market again repeat the pattern same the first impulse if the form of Bearish impulse. Next, we need to click on last Bearish candle at lowest point called D point. In this way we make pattern as you can see in the figure. This is bullish ABCD patter of BTC/USDT asset pair.
Bullish ABCD pattern
As we draw bearish ABCD patter, in the same way we draw the bullish pattern. First we find the pattern in market. Next draw ABCD as we draw the previous. Here you can see the bullish ABCD pattern in the figure.
How to Identify ABCD pattern?
If we want to do trade using ABCD pattern then we need to identify this pattern. Without identification ABCD pattern is useless. For the identification of ABCD we use Fibonacci Retracement graph. We can identify ABCD pattern with the help of Fibonacci Retracement graph. For this purpose, select the Fibonacci Retracement Tool from toolbar and click on A point and scroll the mouse and click on the Point D. in this way we apply Fibonacci Retracement tool on ABCD pattern.
Identification of Bearish ABCD pattern.
Fibonacci Retracement graph is applied on ABCD chart in two ways. One is from Point A to B and Second is B to C. We take the measurements from these two graphs. For identification of Bearish ABCD pattern we need to consider few points that are listed below.
- There is no secondary move presented by A and B beyond the point A and B.
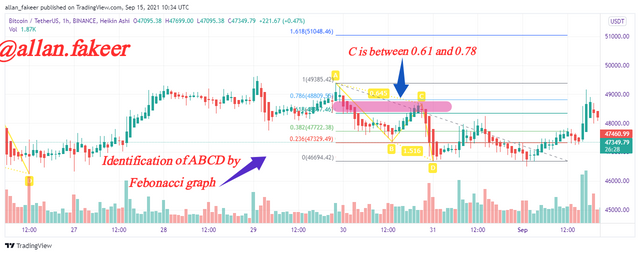
- When we draw Fibonacci Retracement graph from A to B then if the point C must be smaller than Point A. And C point must be lies between the 61.8% and 78.6% limits as mentioned in the figure.
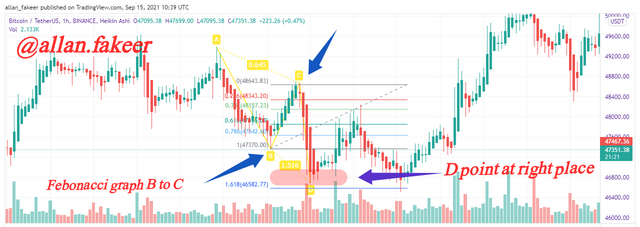
- When we draw Fibonacci Retracement graph from B to C then if the point D must be lies between the 127.2% and 161.8% limits as mentioned in the figure.
If these parameters are satisfied then we consider this ABCD pattern is true and we can use this pattern for trading purpose.
Identification of Bullish ABCD pattern.
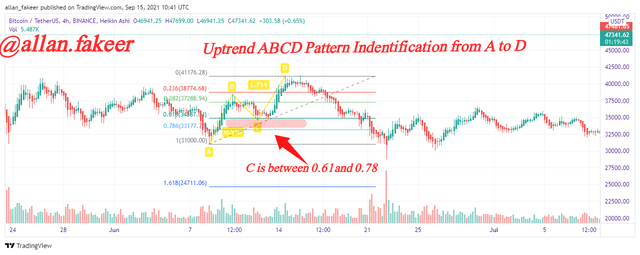
When market is on uptrend then this pattern is identified for trading. All the things that are mentioned in bearish pattern are also considered in bullish pattern but in opposite direction. Bullish ABCD pattern is identified when the following conditions are satisfied.
- There is no secondary move presented by A and B beyond the point A and B.
- When we draw Fibonacci Retracement graph from A to B then if the point C must be smaller than Point A. And C point must be lies between the 61.8% and 78.6% limits as mentioned in the figure.
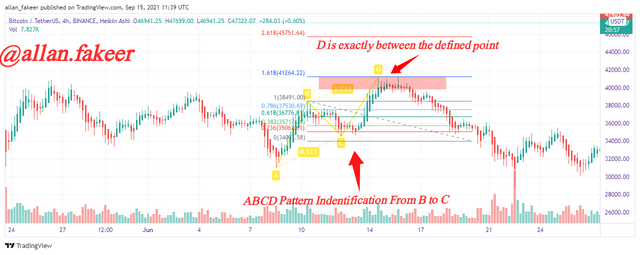
- When we draw Fibonacci Retracement graph from B to C then if the point D must be lies between the 127.2% and 161.8% limits as mentioned in the figure.
If these parameters are satisfied then we consider this ABCD pattern is true bullish pattern and we can use this pattern for trading purpose.
Clearly describe the entry and exit criteria, both for buying and selling using the AB = CD pattern?
Entry Criteria for Buying and Selling
For make an entry in to the market, first we need to identify the ABCD pattern. For this purpose, we use Fibonacci Retracement graph. According to this graph if our drawn pattern fulfill all conditions of Fibonacci graph then we will able to make entry to market. All conditions are listed below.
- First, we configure the 4 pattern points on chart.
- After applying the Fibonacci toll, we check the values of C and D at certain point. If the value of C is lies between the 61.8% and 78.6% then it is good sign. On the other hand, in graph from B to C we check the value of D. If it is lies between the 127.2% and 161.8% then it is good opportunity of take an entry in to market.
If these conditions are not satisfied then we need to wait for next pattern.
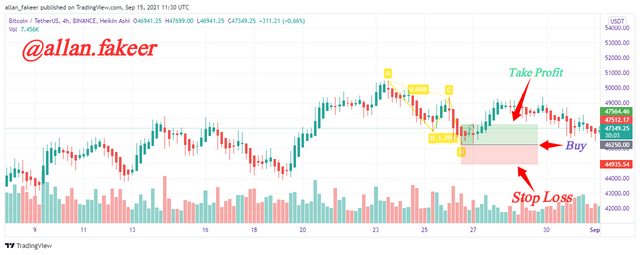
In the chart the pattern I draw are exactly identified and all conditions are satisfied. In the figure you can see in the figure, I make an entry to market with risk management. I made an entry with stop loss and take profit with Risk and Reward ratio of (1:1).
Exit Criteria for Buying and Selling
Exit criteria is decided when market is on uptrend. When it reaches the highest point according to ABCD pattern the it is time to exit the market. Before make an exit, we need to identify the pattern with Fibonacci Tool. If the following conditions are satisfied then we should take an exit from market and take good profit.
After applying the Fibonacci tool, we check the values of C and D at certain point. If the value of C is lies between the 61.8% and 78.6% then it is good sign. On the other hand, in graph from B to C we check the value of D. If it is lies between the 127.2% and 161.8% then it is good opportunity of take an Exit and make profit.
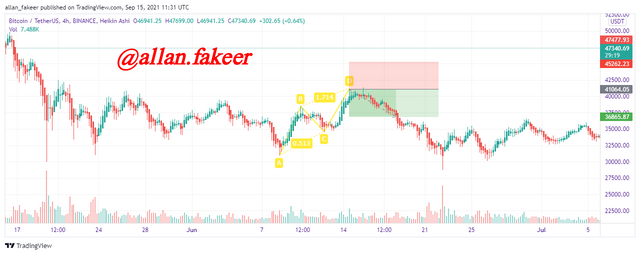
In the chart the pattern I draw is exactly identified and all conditions are satisfied. In the figure you can see in the figure, At the higher point of bullish market I place exit trade and with stop loss and take profit with Risk and Reward ratio of (1:1).
Make 2 entries (Up and Down) on any cryptocurrency pair using the AB = CD pattern confirming it with Fibonacci.
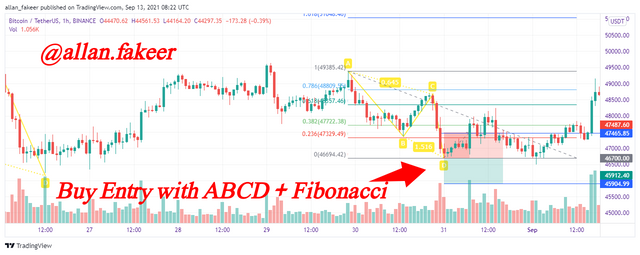
Buy Entry Using ABCD + Fibonacci Graph
In this figure we can clearly see that the chart fulfill about all requirements fro buying. Here I place buy order with risk reward ration 1:1. Stop Loss and Take profit limits are applied. Point C is place between the 0.61 and 0.78. in the previous question you can see the Point D is also presented between the 1.61 and 1.27. This is why Here I want to place buy order.
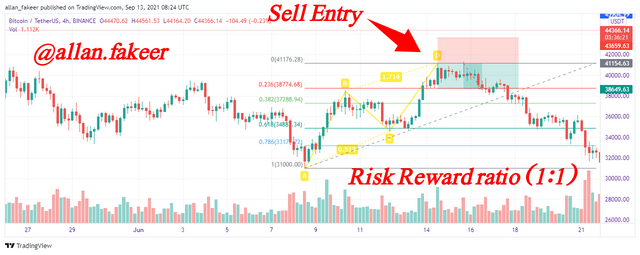
Buy Entry Using ABCD + Fibonacci Graph
In this figure we can clearly see that the chart fulfill about all requirements for Sell Trade. Here I place Sell order with risk reward ration 1:1. Stop Loss and Take profit limits are applied. Point C is place between the 0.61 and 0.78. in the previous question you can see the Point D is also presented between the 1.61 and 1.27. This is why Here I want to place Sell order.
Before starting trading we need to learn about different types of analyses. We will become good trader if we get enough knowledge about these analyses. There are three types of analyses. Two of them are major analyses, one is fundamental analyses and other is technical analyses. These analyses are doing for the prediction of price movement of particular asset and confirming the trend.
Harmonic Trading patterns is one of technical analyses tool that is used in trading. In this the graph is drawn on the chart of particular asset. There are four parts of this pattern ABCD. All these points are drawn according to the chart pattern.
This ABCD graph pattern is not enough for trading. We should verify these patterns by using the Fibonacci Retracement tool. We draw this graph up the ABCD graph. If the point C and D lies between the particular limits then it is true for trading otherwise not.